2289 Lewis St · Jacksonville, FL
Flood risk No data
- FEMA flood zone
- —
- Chance of flooding over 30 yrs
- —
- Est. flood insurance / yr
- —
Fire risk No data
- Est. fire insurance / yr
- —
Heat risk No data
- Hot days now (above threshold)
- —
- Hot days in 30 yrs
- —
Wind risk No data
- Chance of severe wind over 30 yrs
- —
Air-quality risk No data
- Unhealthy air days now
- —
- Unhealthy air days in 30 yrs
- —
Risk factors via First Street. Map © Google.
Why this score? — see what drove the D+ grade
The composite is a weighted blend of 9 inputs, each scored 0–100. Each bar is that input's sub-score; the figure is the points it added to the 100-point composite (weight × sub-score).
- ARV discount +15.0/15.0
- Cash flow +10.0/30.0
- Livability +4.2/5.0
- Condition / age +4.0/5.0
- Schools +3.9/10.0
- Rent growth +3.7/5.0
- 1% rule +3.0/10.0
- DSCR +2.9/10.0
- Appreciation +0.0/10.0
$217,900
🖨 Deal sheet (PDF) 📄 Offer letter ✓ Due diligence
Listing remarks
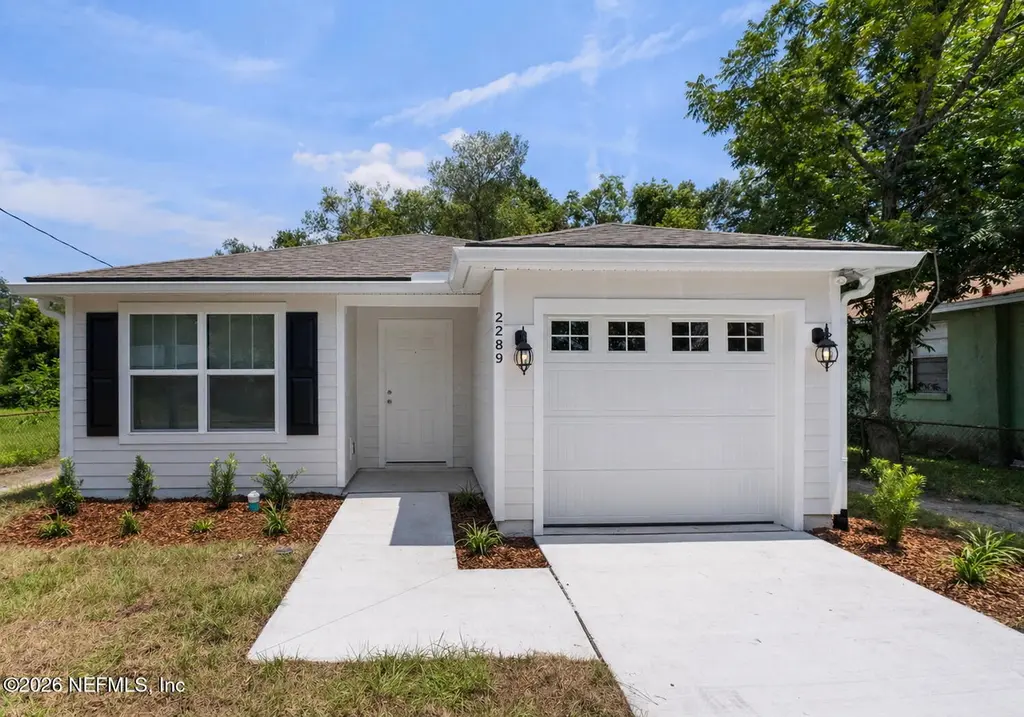
* * Call to learn more about our Exclusive Builder Incentives from Team Proffit Home Loans * * This BRAND NEW home offers a spacious floorplan with 3 bedrooms and 2 bathrooms and built around today home owners needs. Step inside this beautifully designed home, where a large living area seamlessly flows into a modern kitchen featuring brand-new stainless steel appliances, sleek shaker cabinets, and an open view of the inviting dining space. All bedrooms are thoughtfully positioned for privacy, creating a peaceful retreat away from the main living areas. Additional highlights include a dedicated laundry room, a single-car garage, and a builder's warranty for added assurance. Conveniently l
Key facts
- Spacious floorplan
- Shaker cabinets
- Modern kitchen
Tags
Property features AI
Exterior
- Parking: Garage; Additional parking; 1-car garage
- Utilities: Cable available; Electricity connected; Sewer connected; Water connected
- Home design: Single family residence; One story
- Construction: Shingle roof
- Exterior features: Corner lot
Interior
- Kitchen: Dishwasher; Electric range
- Bedrooms: 3 bedrooms
- Flooring: Tile
- Bathrooms: 2 full bathrooms
- Heating & cooling: Heat pump heating; Central air conditioning
- Interior features: Breakfast bar; Ceiling fan(s); Open floorplan; Split bedrooms; Walk-in closet(s)
Neighborhood map
What this means for you Summary
Snapshot
- This is a 3-bed/2.0-bath single-family listed at $218k. Condition is rated good.
Deal economics
- At list price, monthly cash flow is $-130 ($-2k/yr) — negative.
- To cash-flow at today's rent, offer at most $199k (8.7% below list).
- To meet the 1% rule (rent ≥ 1% of price), the offer needs to be $174k (20.1% below list).
- Recommended offer: $174k (20.1% below list) — sets the bar for 1% rule.
- Cap rate 5.6% vs local median 3.9% in Jacksonville — top-decile yield for the area; either an underpriced asset or a hidden risk that comps aren't pricing in. Stress-test before assuming the spread holds.
Location & tenants
- Location reads 83/100 on livability (#50 in FL, #911 nationally) — a professional / high-income tenant draw. Strengths: amenities A+, commute A+, housing A+.
- Duval (urban): math 46% / reading 45% proficiency, ranked #48 of 73 in FL (top 66%) — families likely to look elsewhere, expect single-tenant / working-renter base with shorter leases.
- Zoned schools: Smart Pope Livingston Elementary (428 students, 91% FRL); Joseph Stilwell Middle School (math 31% / reading 33%, grade F, #448 of 571 statewide, top 79%, 612 students, 68% FRL); Riverside High School (math 24% / reading 39%, grade F, #424 of 667 statewide, top 64%, 1,567 students, 60% FRL) — zoned schools average 73% FRL vs 49% district-wide (24 pts higher); higher-poverty schools than district average — tighter screening recommended.
- Zoned-school proficiency averages 32% at this address vs 46% district-wide (-14 pts) — the specific schools serving this property underperform the Duval average; the district grade overstates school quality for this exact location.
- Market conditions: Rents rising fast (+4.7%/yr); 78 active listings in the ZIP; 40 comparable units currently listed for rent nearby; rentals at typical pace (median 19d on market — plan ~3-4 weeks tenant-placement turnaround); 6,503 units permitted in Duval County in 2024 (1,131 in 5+ unit buildings).
- This rent runs 32% of the median local income ($65k/yr) — at the standard rent-burdened threshold; future hikes will face affordability resistance.
Forward outlook
- Local home prices are declining (-3.0%/yr); year-one equity from $2k of loan paydown is wiped out by about $7k of value loss. Plan a longer hold.
- Duval County population projected at +19% by 2050 — long-run rental-demand tailwind backs the buy-and-hold thesis.
Negotiation context
- It's been on market 54 days — a 3% lower offer ($211k) is reasonable based on typical stale-listing flexibility.
Questions for the listing agent
- What do current leases actually rent for vs. the listed asking? Can we see a recent rent roll and the last 12 months of T-12 income?
- It's been on market 54 days. Have you received any prior offers? Is the seller open to a 20% concession, seller financing, or rate buy-down credit?
- Is there a deadline driving the sale (1031 exchange, divorce, estate, relocation)? That informs how much negotiation room exists.
- Schools are B-rated — typically a magnet for longer-tenancy family renters. What's the average tenant stay here, and is there a school-zone premium baked into asking?
- The area grade is low — what's the realistic commute time and amenity access for the typical tenant pool here? Any planned neighborhood developments (good or bad) we should know about?
- What's the average days-on-market for RENTAL listings here right now (not sales)? A rising rental-DOM trend means longer vacancies and softer asking-rent achievability than the comps imply.
- What's the recent tenant-quality profile in this submarket — average credit score on applications, eviction rate, late-payment / NSF rate, and stable-employment percentage? A property-management company in the area should have these aggregated.
- How much new for-sale + rental construction is in the pipeline within 1–3 miles? Heavy new supply typically softens prices + rents 12–24 months out; constrained supply supports both.
Investment metrics
- 1% rule
- 0.80% ✗
- Cap rate
- 5.58%
- Cash-on-cash
- -2.56%
- DSCR
- 0.89
- GRM
- 10.4
CMA / ARV
- ARV (on-the-fly)
- $273,154
- Comps found
- 12
Show comp detail 12 sales within ~0.75 mi
| Address | Dist | Beds/Ba | Sqft | Sold | Price | $/sf | Match |
|---|---|---|---|---|---|---|---|
| 332 Woodlawn Ave | 0.07mi | 3/2.0 | 1,230 (-2%) | 3mo | $235,100 | $191 | 91 |
| 2562 Summit St | 0.28mi | 3/2.0 | 1,268 (+1%) | 3mo | $205,000 | $162 | 83 |
| 306 Woodlawn Ave | 0.09mi | 3/2.0 | 1,100 (-12%) | 2mo | $70,000 | $64 | 74 |
| 2331 Myra St | 0.55mi | 3/1.0 | 1,280 (+2%) | 1mo | $366,000 | $286 | 66 |
| 411 King St | 0.43mi | 3/1.0 | 1,182 (-6%) | 4mo | $117,500 | $99 | 63 |
| 2550 Summit St | 0.26mi | 2/2.0 (-1) | 1,083 (-14%) | 1mo | $130,000 | $120 | 60 |
| 724 James St | 0.72mi | 3/2.0 | 1,207 (-4%) | 2mo | $265,000 | $220 | 59 |
| 2594 Haldumar Ter | 0.67mi | 2/1.0 (-1) | 1,260 (+1%) | 3mo | $285,000 | $226 | 56 |
| 2664 Ernest St | 0.57mi | 3/2.0 | 1,361 (+9%) | 4mo | $295,000 | $217 | 56 |
| 2343 Ernest St | 0.43mi | 3/1.0 | 1,092 (-13%) | 4mo | $265,000 | $243 | 51 |
| 2654 Green St | 0.72mi | 3/1.0 | 1,130 (-10%) | 3mo | $246,500 | $218 | 43 |
| 2578 Haldumar Ter | 0.67mi | 2/1.0 (-1) | 1,114 (-11%) | 1mo | $280,000 | $251 | 41 |
Match score weights: distance 35% · size 25% · config 20% · recency 20%. Top-matched comps best support the ARV.
Projected returns pro-forma
-3.0% appreciation · 4.69% rent growth · sell at horizon
- IRR
- -18.7%
- Equity multiple
- 0.33×
- Total profit
- $-40,574
- Equity at exit
- $32,490
- IRR
- -8.1%
- Equity multiple
- 0.46×
- Total profit
- $-33,127
- Equity at exit
- $18,840
Cash invested: $61,012 (down + closing). Projections, not guarantees.
Landlord ↔ Tenant lean methodology
- Overall (STATE)
- 87 Strongly Landlord-Friendly
- State Florida
- 87 Strongly Landlord-Friendly · R+3
- County
- — inherits STATE
- City
- — inherits STATE
ZIP-level market 32204
- Home prices YoY
- -28.2%
- Rents YoY
- 4.7%
- Active inventory
- 78
- Price-to-rent
- 10.4×
Monthly cashflow live
- Estimated rent
- $1,741 high interval (Pro) →
- Mortgage (P&I)
- −$1,143
- Tax est. 1.5%
- −$272 /mo · $3,268/yr
- Insurance
- −$91
- HOA
- −$0
- Vacancy / Maint / Mgmt
- −$366
- Net cashflow
- $-130
Break-even live
Sensitivity live
| Price | -10% $20 | -5% $-55 | +0% $-130 | +5% $-206 | +10% $-281 |
|---|---|---|---|---|---|
| Rent | -10% $-268 | -5% $-199 | +0% $-130 | +5% $-62 | +10% $7 |
| Rate | -1.0pp $-21 | -0.5pp $-75 | base $-130 | +0.5pp $-187 | +1.0pp $-244 |
UW: 25.0% down · 7.5% · 30yr · 1.5% tax · 5.0% vac · 8.0% maint · 8.0% mgmt
Financing live
Cash to close
- Down payment
- $54,475
- Closing costs
- $6,537
- Reserves months
- —
- Total cash needed
- —
Loan-product check · same deal, 3 products live
Conventional
25% down · 7.5% · 30yr
- Down + closing
- —
- Monthly P&I
- —
- Monthly cashflow
- —
- DSCR
- —
- Eligible?
- —
Personal DTI + credit; lowest rate.
DSCR
20% down · 8.5% · 30yr
- Down + closing
- —
- Monthly P&I
- —
- Monthly cashflow
- —
- DSCR
- —
- Eligible?
- —
No personal income docs; deal must DSCR.
Hard money
10% down · 12.0% · 12mo
- Down + closing
- —
- Monthly P&I
- —
- Monthly cashflow
- —
- DSCR
- —
- Eligible?
- —
Short-term bridge; refi at stabilization.
Rent comps 40 comps
| Address | Beds | Baths | Sqft | Rent | $/sqft | DOM | Units | Dist |
|---|---|---|---|---|---|---|---|---|
| 346 Acosta St Jacksonville, FL | 4.0 | 3.5 | 1536 | $1,600 | $1.04 | 25d | 1 | 0.24mi |
| 2526 Phyllis St Jacksonville, FL | 3.0 | 2.0 | 1300 | $1,800 | $1.38 | 25d | 1 | 0.33mi |
| 2561 Rosselle St #1 Jacksonville, FL | 3.0 | 3.0 | 1287 | $1,395 | $1.08 | 25d | 1 | 0.37mi |
| 371 Smith St Jacksonville, FL | 3.0 | 2.0 | 1050 | $1,325 | $1.26 | 6d | 1 | 0.41mi |
| 2002 Ernest St Unit A Jacksonville, FL | 2.0 | 1.0 | 1000 | $1,795 | $1.79 | 15d | 1 | 0.50mi |
| 2044 Dellwood Ave Jacksonville, FL | 2.0 | 1.0 | 1375 | $1,825 | $1.33 | 25d | 1 | 0.53mi |
| 2614 Dellwood Ave Jacksonville, FL | 3.0 | 1.0 | 1122 | $2,325 | $2.07 | 6d | 1 | 0.58mi |
| 2309 College St Jacksonville, FL | 2.0 | 1.0 | 1200 | $1,200 | $1.00 | 15d | 1 | 0.59mi |
| 715 Ralph St Jacksonville, FL | 4.0 | 2.0 | 1338 | $2,195 | $1.64 | 6d | 1 | 0.59mi |
| 2136 College St #4 Jacksonville, FL | 2.0 | 1.0 | 900 | $1,250 | $1.39 | 25d | 1 | 0.63mi |
| 717 King St Jacksonville, FL | 3.0 | 2.0 | 1132 | $1,800 | $1.59 | 19d | 1 | 0.63mi |
| 420 Sunshine St Jacksonville, FL | 3.0 | 2.0 | 1050 | $1,350 | $1.29 | 3d | 1 | 0.65mi |
| 2578 Haldumar Ter Jacksonville, FL | 2.0 | 1.0 | 1114 | $2,195 | $1.97 | 16d | 1 | 0.66mi |
| 2701 Myra St Jacksonville, FL | 3.0 | 1.0 | 1065 | $1,595 | $1.50 | 23d | 1 | 0.70mi |
| 2759 Dellwood Ave Jacksonville, FL | 3.0 | 2.0 | 1080 | $2,100 | $1.94 | 21d | 1 | 0.74mi |
| 2657 Post St Apt 2 Jacksonville, FL | 3.0 | 1.0 | 1100 | $1,700 | $1.55 | 4d | 1 | 0.78mi |
| 1923 Broadway Ave Jacksonville, FL | 3.0 | 2.0 | 1230 | $1,421 | $1.16 | 25d | 1 | 0.81mi |
| 226 Spruce St Jacksonville, FL | 4.0 | 2.0 | 1196 | $1,148 | $0.96 | 4d | 1 | 0.83mi |
| 2012 Baldwin St Jacksonville, FL | 3.0 | 2.0 | 1232 | $1,445 | $1.17 | 25d | 1 | 0.84mi |
| 2589 Park St Unit 2589 Jacksonville, FL | 2.0 | 1.0 | 1354 | $1,850 | $1.37 | 25d | 1 | 0.85mi |
| 2812 Ernest St Jacksonville, FL | 3.0 | 1.0 | 1461 | $2,800 | $1.92 | 25d | 1 | 0.85mi |
| 2803 College St Jacksonville, FL | 2.0 | 1.0 | 1100 | $1,550 | $1.41 | 15d | 1 | 0.87mi |
| 2777 Post St Jacksonville, FL | 2.0 | 1.0 | 1200 | $1,195 | $1.00 | 25d | 1 | 0.90mi |
| 1979 Yulee St Jacksonville, FL | 3.0 | 2.0 | 1050 | $1,500 | $1.43 | 25d | 1 | 0.94mi |
| 220 Riverside Ave Jacksonville, FL | 2.0 | 1.0–2.0 | 887 | $1,966 | $2.22 | 3d | 33 | 0.95mi |
| 1751 Broadway Ave Jacksonville, FL | 2.0 | 1.0 | 1000 | $1,525 | $1.52 | 6d | 1 | 0.95mi |
| 1607 Logan St Jacksonville, FL | 4.0 | 2.0 | 1232 | $1,800 | $1.46 | 25d | 1 | 0.97mi |
| 200 Riverside Ave Jacksonville, FL | 2.0 | 1.0–2.0 | 808 | $2,501 | $3.09 | 3d | 27 | 0.99mi |
| 100 Magnolia St Jacksonville, FL | 1.0–2.0 | 1.0–2.0 | 921 | $2,202 | $2.39 | 3d | 46 | 1.00mi |
| 1545 Union St W Jacksonville, FL | 3.0 | 2.0 | 1253 | $1,400 | $1.12 | 4d | 1 | 1.02mi |
| 1539 Union St W Jacksonville, FL | 3.0 | 1.5 | 1000 | $1,144 | $1.14 | 15d | 1 | 1.02mi |
| 2980 Ernest St Jacksonville, FL | 2.0 | 1.0 | 920 | $1,200 | $1.30 | 25d | 1 | 1.04mi |
| 2054 Riverside Ave Jacksonville, FL | 1.0–2.0 | 1.0–2.0 | 950 | $2,418 | $2.54 | 5d | 14 | 1.05mi |
| 3035 Fitzgerald St Jacksonville, FL | 2.0 | 1.0 | 900 | $1,021 | $1.13 | 4d | 1 | 1.07mi |
| 1448 Union St W Jacksonville, FL | 3.0 | 1.0 | 958 | $1,200 | $1.25 | 25d | 1 | 1.09mi |
| 809 McDuff Ave S Jacksonville, FL | 2.0 | 1.0 | 1006 | $995 | $0.99 | 6d | 1 | 1.09mi |
| 1470 Windle St Jacksonville, FL | 3.0 | 2.0 | 1170 | $1,425 | $1.22 | 16d | 1 | 1.10mi |
| 1846 Margaret St Unit 7A Jacksonville, FL | 2.0 | 1.5 | 1313 | $3,000 | $2.28 | 25d | 1 | 1.10mi |
| 1060 Cherry St Jacksonville, FL | 2.0 | 1.0 | 1356 | $1,623 | $1.20 | 23d | 1 | 1.11mi |
| 2410 McQuade St Jacksonville, FL | 3.0 | 2.0 | 1307 | $1,425 | $1.09 | 25d | 1 | 1.13mi |
Listing history 16 events
-
2026-06-21days on market $217,900 Active 54 DOM
-
2026-06-18days on market $217,900 Active 51 DOM
-
2026-06-17days on market $217,900 Active 50 DOM
-
2026-06-16days on market $217,900 Active 49 DOM
-
2026-06-15days on market $217,900 Active 48 DOM
-
2026-06-13days on market $217,900 Active 45 DOM
-
2026-06-10days on market $217,900 Active 42 DOM
-
2026-06-08pricedays on market $217,900 Active 41 DOM
-
2026-06-07days on market $219,900 Active 40 DOM
-
2026-06-05days on market $219,900 Active 37 DOM
-
2026-06-03days on market $219,900 Active 36 DOM
-
2026-06-02days on market $219,900 Active 35 DOM
-
2026-06-01days on market $219,900 Active 34 DOM
-
2026-05-31days on market $219,900 Active 33 DOM
-
2026-05-19price $219,900
-
2026-04-28$229,900 Active
ⓘ Source: listings_history table (triggers on properties + properties_extension) + one-shot
backfill from property_details.listing_events for pre-trigger history.
Nearby sold comps map
Loading sold comps map…
Walkable amenities ~0.75 mi
Loading nearby amenities…
Taxation est. · year 1
- Rental income
- $20,894
- − Mortgage interest
- −$12,206
- − Property taxes
- −$3,268
- − Insurance
- −$1,090
- − Repairs & maintenance
- −$1,672
- − Management
- −$1,672
- − Depreciation
- −$6,339
- Taxable loss
- −$5,352
- Est. tax savings @ 24.0%
- +$1,284
- After-tax cash flow
- $-280/yr
For passive investors: Depreciation is non-cash, so a rental often shows a tax loss while cash-flowing — sheltering income. Rental losses are passive: they offset passive income freely, and up to $25,000/yr can offset ordinary (W-2) income if you actively participate and your MAGI is under $100k (phasing out to $0 by $150k); unused losses carry forward. On sale, claimed depreciation is recaptured at up to 25%, and gains may owe capital-gains tax (a 1031 exchange can defer both). Figures are a year-1 estimate at your 24.0% rate — not tax advice; consult a CPA.
Condition & rehab AI · 12 photos
This home is in excellent condition with a good condition score of 80. It is move-in ready with a modern kitchen and bathrooms, fresh paint, and well-maintained exterior. The property has a good foundation and structure, and the landscaping adds to its curb appeal. The home is a great investment opportunity with high ROI potential.
Value-add opportunities
- Both Painting the exterior — Fresh paint can enhance curb appeal and property value.
- Both Landscaping improvements — Enhanced landscaping can improve curb appeal and attract potential buyers/tenants.
- Both Adding smart home features — Smart home features can increase property value and attract tech-savvy buyers/tenants.
- Both Upgrading lighting fixtures — Modern lighting can improve the home's ambiance and increase its appeal.
- Both Adding a smart thermostat — A smart thermostat can improve energy efficiency and attract tech-savvy buyers/tenants.
Renovation cost estimate screening
Value-add ROI direction
- Both Painting the exterior — Fresh paint can enhance curb appeal and property value. ↑
- Both Landscaping improvements — Enhanced landscaping can improve curb appeal and attract potential buyers/tenants. ↑
- Both Adding smart home features — Smart home features can increase property value and attract tech-savvy buyers/tenants. ↑
- Both Upgrading lighting fixtures — Modern lighting can improve the home's ambiance and increase its appeal. ↑
- Both Adding a smart thermostat — A smart thermostat can improve energy efficiency and attract tech-savvy buyers/tenants. ↑
ⓘ Cost ranges are severity-bucket heuristics (US national rule-of-thumb). Get contractor quotes + a written scope before underwriting a rehab budget.
Schools (NCES district)
- District
- Duval
- NCES district ID
- 1200480
- Math proficiency
- 46% ▼ -11.00%
- Reading proficiency
- 45% ▼ -4.00%
- Median HH income
- $48,987
- Composite
- 38.97/100
- National rank
- #4076
- State rank
- #48 of 73 in FL
Livability — Jacksonville
- Score
- 83/100
- State rank
- #50
- US rank
- #911
Category grades
Schools grade is shown separately in the Schools card above.
Census & demographics
- Census place
- Jacksonville, FL
- County
- Duval County · 1,015,274 people
- City population
- 979,034
- Metro
- Jacksonville, FL
- Population (ZIP)
- 9,151
- Household income
- $65,063
- Rent vs Own
- Severe rent burden
- 866.0
Population outlook (Duval County) Hauer SSP2
- Today (2025)
- 1,013,010 people
- By 2030
- 1,059,228 · +4.6%
- By 2040
- 1,141,439 · +12.7%
- By 2050
- 1,205,258 · +19.0%
- By 2075
- 1,324,282 · +30.7%
- By 2100
- 1,319,620 · +30.3%
Race, ethnicity, and origin ACS 2023
- Neighborhood character
- Diverse neighborhood (Simpson 0.60)
- Race & ethnicity
- White 55% Black 30% Hispanic / Latino 6% Asian 6% Two or more races 6%
- Hispanic origin (detail)
- Mexican 3% Puerto Rican 1%
- Common ancestry
- Slovak 2% Lithuanian 2% Italian 1%
- Foreign-born
- 7% · China, Canada, Philippines
- Languages at home
- 92% English-only · Spanish 3% Chinese 2% Other Asian/Pacific 2%
Political lean MEDSL · Duval
- 2024 margin
- Toss-up / Even · D 48.7% · R 50.1% · Other 1.2%
- 2008→2024 swing
- +0.4pp no change · 2008: -1.9pp · 2024: -1.5pp
- All cycles
- 2024: R+1.5 2020: D+3.8 2016: R+1.5 2012: R+3.6 2008: R+1.9
Not yet ingested
- Civics
- —
Market trends
- HPI YoY
- ▼ -123.96%
- Current HPI
- 316.3185
- Rent YoY
- ▲ 4.69%
- Metro
- Jacksonville, FL
- State GDP YoY
- ▲ 3.28%
- F500 in state
- 36
Industry mix (Fortune 500 HQ in FL)
| Industry | F500 HQs | Revenue |
|---|---|---|
| Industrial Technology | 2 | $29B |
|
||
| Insurance | 2 | $17B |
|
||
| Retail | 1 | $60B |
|
||
| Technology Distribution | 1 | $58B |
|
||
| Homebuilding | 1 | $35B |
|
||
| Technology Manufacturing | 1 | $35B |
|
||
Price history
-4.3% since first listed2 events — show timeline
- 2026-05-19 Price Changed $219,900 realMLS
- 2026-04-28 Listed $229,900 realMLS
Cash-flow waterfall
monthlySold comps — $/sqft
last 12 mo · ≤1 miLoading sold comps…