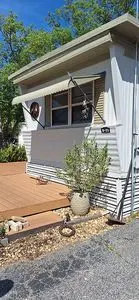
1310 Fleming Ave · Ormond Beach, FL
Flood risk No data
- FEMA flood zone
- —
- Chance of flooding over 30 yrs
- —
- Est. flood insurance / yr
- —
Fire risk No data
- Est. fire insurance / yr
- —
Heat risk No data
- Hot days now (above threshold)
- —
- Hot days in 30 yrs
- —
Wind risk No data
- Chance of severe wind over 30 yrs
- —
Air-quality risk No data
- Unhealthy air days now
- —
- Unhealthy air days in 30 yrs
- —
Risk factors via First Street. Map © Google.
Why this score? — see what drove the D+ grade
The composite is a weighted blend of 9 inputs, each scored 0–100. Each bar is that input's sub-score; the figure is the points it added to the 100-point composite (weight × sub-score).
- Cash flow +15.0/30.0
- ARV discount +7.5/15.0
- 1% rule +5.0/10.0
- DSCR +5.0/10.0
- Livability +4.2/5.0
- Schools +3.9/10.0
- Rent growth +2.9/5.0
- Condition / age +2.5/5.0
- Appreciation +0.0/10.0
$37,500
🖨 Deal sheet (PDF) 📄 Offer letter ✓ Due diligence
Listing remarks
Hot new listing! The perfect 2 bedroom 2 bath mobile home in a little vintage park. The shangrla ; in Ormond Beach park. Convenient location close to everything you need. a 1968 Mobile home with tons of upgrades that just feels like home! New kitchen cabinets and granite countertops, new stainless steel oven and microwave a retro refrigerator and new flooring. The most relaxing outdoor spaces to relax under the trees. New decking with space for entertaining and grilling with family. An abundance storage for all your toys. Covered parking for two vehicles. brand new flooring throughout. New plumbing, new 19 gallon water heater. An 8x16 screened in porch with windows as well, adds to the out
Key facts
- New flooring
- Retro refrigerator
- New kitchen cabinets
Tags
Neighborhood map
What this means for you Summary
Snapshot
- This is a 2-bed/2.0-bath other listed at $38k.
Deal economics
- At list price, monthly cash flow is $1k ($18k/yr) — positive.
- The deal already cash-flows at list — no discount required.
- Meets the 1% rule at list price ($2k rent vs $38k).
- Cap rate 54.2% vs local median 3.9% in Ormond Beach — top-decile yield for the area; either an underpriced asset or a hidden risk that comps aren't pricing in. Stress-test before assuming the spread holds.
Location & tenants
- Location reads 83/100 on livability (#55 in FL, #965 nationally) — a professional / high-income tenant draw. Strengths: amenities A+, housing A+, health & safety A+; Watch: commute F.
- Volusia (suburban): math 44% / reading 49% proficiency, ranked #47 of 73 in FL (top 64%) — families likely to look elsewhere, expect single-tenant / working-renter base with shorter leases.
- Market conditions: Rents rising (+1.6%/yr); 985 active listings in the ZIP; 10 comparable units currently listed for rent nearby; rentals at typical pace (median 24d on market — plan ~3-4 weeks tenant-placement turnaround); 3,402 units permitted in Volusia County in 2024 (681 in 5+ unit buildings).
- This rent runs 38% of the median local income ($71k/yr) — at the standard rent-burdened threshold; future hikes will face affordability resistance.
Forward outlook
- Local home prices are declining (-3.0%/yr); year-one equity from $259 of loan paydown is wiped out by about $1k of value loss. Plan a longer hold.
- Volusia County population projected at +19% by 2050 — long-run rental-demand tailwind backs the buy-and-hold thesis.
- At projected returns (-3.0% appreciation + 1.6% rent growth), your $10k cash investment doubles in ~1 year — after that, you're playing with house money.
Negotiation context
- Only 13 days on market — expect competitive offers; lowballing is unlikely to land.
- 2 sale attempts since 15y ago with the ask held roughly flat each time — persistent listings suggest the price (not the market) is what's stuck; bring a comps-based counter.
Questions for the listing agent
- Built in 1968 — when were the roof, HVAC, electrical panel, plumbing, and water heater last replaced?
- Is there a deadline driving the sale (1031 exchange, divorce, estate, relocation)? That informs how much negotiation room exists.
- Schools are B-rated — typically a magnet for longer-tenancy family renters. What's the average tenant stay here, and is there a school-zone premium baked into asking?
- The area grade is low — what's the realistic commute time and amenity access for the typical tenant pool here? Any planned neighborhood developments (good or bad) we should know about?
- What's the average days-on-market for RENTAL listings here right now (not sales)? A rising rental-DOM trend means longer vacancies and softer asking-rent achievability than the comps imply.
- What's the recent tenant-quality profile in this submarket — average credit score on applications, eviction rate, late-payment / NSF rate, and stable-employment percentage? A property-management company in the area should have these aggregated.
- How much new for-sale + rental construction is in the pipeline within 1–3 miles? Heavy new supply typically softens prices + rents 12–24 months out; constrained supply supports both.
Investment metrics
- 1% rule
- 5.93% ✓
- Cap rate
- 54.24%
- Cash-on-cash
- 171.26%
- DSCR
- 8.62
- GRM
- 1.4
CMA / ARV
No comps found within radius.
Projected returns pro-forma
-3.0% appreciation · 1.64% rent growth · sell at horizon
- IRR
- —
- Equity multiple
- 9.23×
- Total profit
- $86,393
- Equity at exit
- $5,591
- IRR
- —
- Equity multiple
- 18.74×
- Total profit
- $186,267
- Equity at exit
- $3,242
Cash invested: $10,500 (down + closing). Projections, not guarantees.
Landlord ↔ Tenant lean methodology
- Overall (STATE)
- 87 Strongly Landlord-Friendly
- State Florida
- 87 Strongly Landlord-Friendly · R+3
- County
- — inherits STATE
- City
- — inherits STATE
ZIP-level market 32174
- Rents YoY
- 1.6%
- Active inventory
- 985
- Price-to-rent
- 1.4×
Monthly cashflow live
- Estimated rent
- $2,225 high interval (Pro) →
- Mortgage (P&I)
- −$197
- Tax est. 1.5%
- −$47 /mo · $562/yr
- Insurance
- −$16
- HOA
- −$0
- Vacancy / Maint / Mgmt
- −$467
- Net cashflow
- $1,499
Break-even live
Sensitivity live
| Price | -10% $1,524 | -5% $1,511 | +0% $1,499 | +5% $1,486 | +10% $1,473 |
|---|---|---|---|---|---|
| Rent | -10% $1,323 | -5% $1,411 | +0% $1,499 | +5% $1,586 | +10% $1,674 |
| Rate | -1.0pp $1,517 | -0.5pp $1,508 | base $1,499 | +0.5pp $1,489 | +1.0pp $1,479 |
UW: 25.0% down · 7.5% · 30yr · 1.5% tax · 5.0% vac · 8.0% maint · 8.0% mgmt
Financing live
Cash to close
- Down payment
- $9,375
- Closing costs
- $1,125
- Reserves months
- —
- Total cash needed
- —
Loan-product check · same deal, 3 products live
Conventional
25% down · 7.5% · 30yr
- Down + closing
- —
- Monthly P&I
- —
- Monthly cashflow
- —
- DSCR
- —
- Eligible?
- —
Personal DTI + credit; lowest rate.
DSCR
20% down · 8.5% · 30yr
- Down + closing
- —
- Monthly P&I
- —
- Monthly cashflow
- —
- DSCR
- —
- Eligible?
- —
No personal income docs; deal must DSCR.
Hard money
10% down · 12.0% · 12mo
- Down + closing
- —
- Monthly P&I
- —
- Monthly cashflow
- —
- DSCR
- —
- Eligible?
- —
Short-term bridge; refi at stabilization.
Rent comps 10 comps
| Address | Beds | Baths | Sqft | Rent | $/sqft | DOM | Units | Dist |
|---|---|---|---|---|---|---|---|---|
| 559 Cameo Dr Ormond Beach, FL | 3.0 | 2.5 | 1668 | $2,310 | $1.38 | 24d | 1 | 0.36mi |
| 1235 Alcazar St Daytona Beach, FL | 3.0 | 2.0 | 1498 | $2,100 | $1.40 | 24d | 1 | 0.97mi |
| 145 Green Forest Dr Ormond Beach, FL | 3.0 | 2.0 | 1625 | $2,200 | $1.35 | 24d | 1 | 1.10mi |
| 67 Brookwood Dr Ormond Beach, FL | 3.0 | 2.0 | 1602 | $2,500 | $1.56 | 24d | 1 | 1.13mi |
| 108 San Mardeen Ct Daytona Beach, FL | 3.0 | 2.0 | 1500 | $2,650 | $1.77 | 24d | 1 | 1.16mi |
| 36 Spring Meadows Dr Ormond Beach, FL | 3.0 | 2.0 | 2036 | $2,700 | $1.33 | 24d | 1 | 1.18mi |
| 51 Brookwood Dr Ormond Beach, FL | 3.0 | 2.0 | 1791 | $2,100 | $1.17 | 24d | 1 | 1.19mi |
| 402 Fleming Ave Ormond Beach, FL | 3.0 | 2.0 | 1495 | $2,560 | $1.71 | 22d | 1 | 1.19mi |
| 1575 Megan Bay Cir Daytona Beach, FL | 3.0 | 2.0 | 1232 | $1,800 | $1.46 | 24d | 1 | 1.26mi |
| 35 Magnolia Ave Unit 35 Ormond Beach, FL | 2.0 | 2.0 | 1300 | $1,800 | $1.38 | 24d | 1 | 1.27mi |
Listing history 10 events
-
2026-06-18days on market $37,500 Active 13 DOM
-
2026-06-17days on market $37,500 Active 12 DOM
-
2026-06-16days on market $37,500 Active 11 DOM
-
2026-06-15days on market $37,500 Active 10 DOM
-
2026-06-14days on market $37,500 Active 8 DOM
-
2026-06-10days on market $37,500 Active 5 DOM
-
2026-06-09days on market $37,500 Active 4 DOM
-
2026-06-08days on market $37,500 Active 3 DOM
-
2026-06-07remarks 699-char remark
-
2026-06-07$37,500 Active 2 DOM
ⓘ Source: listings_history table (triggers on properties + properties_extension) + one-shot
backfill from property_details.listing_events for pre-trigger history.
Nearby sold comps map
Loading sold comps map…
Walkable amenities ~0.75 mi
Loading nearby amenities…
Taxation est. · year 1
- Rental income
- $26,699
- − Mortgage interest
- −$2,101
- − Property taxes
- −$562
- − Insurance
- −$188
- − Repairs & maintenance
- −$2,136
- − Management
- −$2,136
- − Depreciation
- −$1,091
- Taxable income
- $18,485
- Est. tax owed @ 24.0%
- −$4,436
- After-tax cash flow
- $13,546/yr
For passive investors: Depreciation is non-cash, so a rental often shows a tax loss while cash-flowing — sheltering income. Rental losses are passive: they offset passive income freely, and up to $25,000/yr can offset ordinary (W-2) income if you actively participate and your MAGI is under $100k (phasing out to $0 by $150k); unused losses carry forward. On sale, claimed depreciation is recaptured at up to 25%, and gains may owe capital-gains tax (a 1031 exchange can defer both). Figures are a year-1 estimate at your 24.0% rate — not tax advice; consult a CPA.
Schools (NCES district)
- District
- Volusia
- NCES district ID
- 1201920
- Math proficiency
- 44% ▼ -9.00%
- Reading proficiency
- 49% ▼ -3.00%
- Median HH income
- $42,946
- Composite
- 39.2/100
- National rank
- #4019
- State rank
- #47 of 73 in FL
Livability — Ormond Beach
- Score
- 83/100
- State rank
- #55
- US rank
- #965
Category grades
Schools grade is shown separately in the Schools card above.
Census & demographics
- County
- Volusia County · 556,871 people
- City population
- 69,624
- Metro
- Deltona-Daytona Beach-Ormond Beach, FL
- Population (ZIP)
- 54,783
- Household income
- $71,011
- Rent vs Own
- Severe rent burden
- 1158.0
Population outlook (Volusia County) Hauer SSP2
- Today (2025)
- 572,749 people
- By 2030
- 598,695 · +4.5%
- By 2040
- 644,880 · +12.6%
- By 2050
- 681,451 · +19.0%
- By 2075
- 759,957 · +32.7%
- By 2100
- 778,902 · +36.0%
Race, ethnicity, and origin ACS 2023
- Neighborhood character
- Predominantly White (82%)
- Race & ethnicity
- White 82% Black 6% Hispanic / Latino 5% Two or more races 5% Asian 3%
- Hispanic origin (detail)
- Puerto Rican 2%
- Common ancestry
- Romanian 4% Lithuanian 3% Slovak 3%
- Foreign-born
- 7% · Canada, China
- Languages at home
- 91% English-only · Spanish 3% Other Indo-European 1% German/W. Germanic 1%
Political lean MEDSL · Volusia
- 2024 margin
- Strong R (+21.8) · D 38.7% · R 60.5%
- 2008→2024 swing
- -27.4pp toward R · 2008: 5.7pp · 2024: -21.8pp
- All cycles
- 2024: R+21.8 2020: R+14.1 2016: R+13.1 2012: R+1.2 2008: D+5.7
Not yet ingested
- Civics
- —
Market trends
- HPI YoY
- ▼ -327.97%
- Current HPI
- 271.92
- Rent YoY
- ▲ 1.64%
- Metro
- Deltona-Daytona Beach-Ormond Beach, FL
- State GDP YoY
- ▲ 3.28%
- F500 in state
- 36
Industry mix (Fortune 500 HQ in FL)
| Industry | F500 HQs | Revenue |
|---|---|---|
| Industrial Technology | 2 | $29B |
|
||
| Insurance | 2 | $17B |
|
||
| Retail | 1 | $60B |
|
||
| Technology Distribution | 1 | $58B |
|
||
| Homebuilding | 1 | $35B |
|
||
| Technology Manufacturing | 1 | $35B |
|
||
Price history
-90.6% since first listed5 events — show timeline
- 2026-06-06 Listed $37,500 FSBO.com
- 2014-02-20 Sold (Public Records) $2,950,000 Public Records
- 2011-11-15 Listed $199,000 Daytona MLS
- 1995-03-23 Sold (Public Records) $2,400,000 Public Records
- 1973-03-01 Sold (Public Records) $400,500 Public Records
Property tax history
+4.6%/yrLatest (2025): $57,640 · +5.0% YoY. Source: county tax records.
Cash-flow waterfall
monthlySold comps — $/sqft
last 12 mo · ≤1 miLoading sold comps…