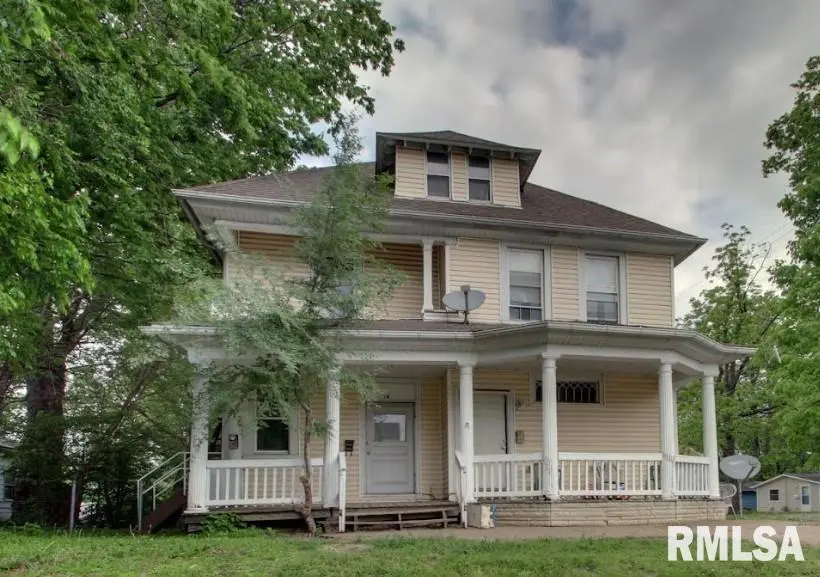
537 Locust St · Quincy, IL
Flood risk 1/10 · Minimal
- FEMA flood zone
- X (unshaded)
- Chance of flooding over 30 yrs
- 0.0%
- Est. flood insurance / yr
- $473 – $860
Fire risk 1/10 · Minimal
- Est. fire insurance / yr
- $804 – $1,492
Heat risk 3/10 · Minor
- Hot days now (above 107°F)
- 7 days/yr
- Hot days in 30 yrs
- 17 days/yr
Wind risk 2/10 · Minimal
- Chance of severe wind over 30 yrs
- —
Air-quality risk 2/10 · Minimal
- Unhealthy air days now
- 1 days/yr
- Unhealthy air days in 30 yrs
- 1 days/yr
Risk factors via First Street. Map © Google.
Why this score? — see what drove the D+ grade
The composite is a weighted blend of 9 inputs, each scored 0–100. Each bar is that input's sub-score; the figure is the points it added to the 100-point composite (weight × sub-score).
- Cash flow +18.5/30.0
- ARV discount +7.5/15.0
- DSCR +5.8/10.0
- Rent growth +5.0/5.0
- 1% rule +4.5/10.0
- Livability +3.4/5.0
- Condition / age +2.5/5.0
- Schools +2.2/10.0
- Appreciation +0.0/10.0
$165,000
🖨 Deal sheet (PDF) 📄 Offer letter ✓ Due diligence
Listing remarks MLS
Income producing! Updates include: roof, windows, siding, electric, plumbing, 3 units new appliances, 1E & 2E paint throughout. 1 E new kitchen. All units have separate water, gas, & electric. Detached garages could be rented for additional income. Property has a history of finding and keeping long term tenants., Stove included, Refrigerator included
Key facts
- 0.29 acre lot
- 4 parking spots
- Listed 40 days
Property features AI
Finance
- Financial info: 4-unit building; Reported rents: Unit 1 $600, Unit 2 $550, Unit 3 $0, Unit 4 $600
Exterior
- Parking: Total 4 parking spaces; Each unit includes 1 parking space (uncovered); Detached parking with alley access
- Utilities: Public water; Public sewer
- Home design: Residential income property; Two or more story structure; Building area approximately 3780 total
- Construction: Other-type roof; Year built not provided
- Exterior features: Level lot
Interior
- Bedrooms: Unit 1: 1 bedroom; Unit 2: 1 bedroom; Unit 3: 1 bedroom; Unit 4: 2 bedrooms
- Bathrooms: Each unit has 1 full bathroom
- Heating & cooling: Forced air heating
- Interior features: Full, unfinished basement
Neighborhood map
What this means for you Summary
Snapshot
- This is a 20-bed/16.0-bath single-family listed at $165k.
Deal economics
- At list price, monthly cash flow is $157 ($2k/yr) — positive.
- The deal already cash-flows at list — no discount required.
- To meet the 1% rule (rent ≥ 1% of price), the offer needs to be $156k (5.3% below list).
- Recommended offer: $156k (5.3% below list) — sets the bar for 1% rule.
- Cap rate 7.4% vs local median 4.3% in Quincy — top-decile yield for the area; either an underpriced asset or a hidden risk that comps aren't pricing in. Stress-test before assuming the spread holds.
Location & tenants
- Location reads 67/100 on livability (#506 in IL) — a middle-class / working-renter tenant base. Strengths: cost of living A+, housing A+; Watch: crime D, employment D, amenities D-.
- Quincy SD 172 (town): math 24% / reading 27% proficiency, ranked #328 of 620 in IL (top 53%) — low school quality limits family demand, transient renter base, plan for 1-2y turnover.
- Zoned schools: Colonel George Iles Elem Sch (math 29% / reading 29%, grade F, #727 of 2,056 statewide, top 36%, 519 students, 0% FRL); Quincy Jr High School (math 25% / reading 30%, grade F, #295 of 665 statewide, top 45%, 1,348 students, 0% FRL); Quincy Sr High School (math 21% / reading 28%, grade F, #256 of 693 statewide, top 44%, 1,924 students, 0% FRL) — zoned schools average 0% FRL vs 48% district-wide (48 pts lower); this property's tenant base skews higher-income than the district average.
- Market conditions: Rents rising fast (+10.8%/yr); 184 active listings in the ZIP; 68 units permitted in Adams County in 2024 (0 in 5+ unit buildings).
- This rent runs 36% of the median local income ($52k/yr) — at the standard rent-burdened threshold; future hikes will face affordability resistance.
Forward outlook
- Local home prices are declining (-3.0%/yr); year-one equity from $1k of loan paydown is wiped out by about $5k of value loss. Plan a longer hold.
- Adams County population projected at -14% by 2050 — secular population decline; favor cash flow + early exit over multi-decade hold.
- At projected returns (-3.0% appreciation + 8.0% rent growth), your $46k cash investment doubles in ~10 years — after that, you're playing with house money.
Negotiation context
- It's been on market 41 days — a 3% lower offer ($160k) is reasonable based on typical stale-listing flexibility.
- 7 sale attempts since 18y ago; this cycle's ask has dropped $15k (8%) from the opening price — seller is motivated, your offer sets the floor, not the list.
- Current owner paid $67k; list at $165k implies a 145% gain — meaningful room to come down on a strong offer.
Questions for the listing agent
- It's been on market 41 days. Have you received any prior offers? Is the seller open to a 5% concession, seller financing, or rate buy-down credit?
- Is there a deadline driving the sale (1031 exchange, divorce, estate, relocation)? That informs how much negotiation room exists.
- Schools are D-rated, which usually means shorter tenancies and higher turnover. Who's the typical renter profile here, and what's been the actual vacancy rate?
- Crime grade is D in this area — have there been break-ins, vandalism, or insurance claims at this property in the last 3 years? What carrier currently insures it and at what premium?
- The area grade is low — what's the realistic commute time and amenity access for the typical tenant pool here? Any planned neighborhood developments (good or bad) we should know about?
- What's the average days-on-market for RENTAL listings here right now (not sales)? A rising rental-DOM trend means longer vacancies and softer asking-rent achievability than the comps imply.
- What's the recent tenant-quality profile in this submarket — average credit score on applications, eviction rate, late-payment / NSF rate, and stable-employment percentage? A property-management company in the area should have these aggregated.
- How much new for-sale + rental construction is in the pipeline within 1–3 miles? Heavy new supply typically softens prices + rents 12–24 months out; constrained supply supports both.
Investment metrics
- 1% rule
- 0.95% ✗
- Cap rate
- 7.43%
- Cash-on-cash
- 4.08%
- DSCR
- 1.18
- GRM
- 8.8
CMA / ARV
- ARV (median comp)
- $66,121
- List price
- $165,000
- Delta
- 149.54%
- Verdict
- OVERPRICED
- Comps
- 8 within 1.0 mi
Projected returns pro-forma
-3.0% appreciation · 8.0% rent growth · sell at horizon
- IRR
- -4.7%
- Equity multiple
- 0.82×
- Total profit
- $-8,492
- Equity at exit
- $24,602
- IRR
- 9.9%
- Equity multiple
- 1.93×
- Total profit
- $43,011
- Equity at exit
- $14,266
Cash invested: $46,200 (down + closing). Projections, not guarantees.
Landlord ↔ Tenant lean methodology
- Overall (STATE)
- 43 Moderately Tenant-Leaning
- State Illinois
- 43 Moderately Tenant-Leaning · D+7
- County
- — inherits STATE
- City
- — inherits STATE
ZIP-level market 62301
- Rents YoY
- 10.8%
- Active inventory
- 184
- Price-to-rent
- 8.8×
Monthly cashflow live
- Estimated rent
- $1,563 medium interval (Pro) →
- Mortgage (P&I)
- −$865
- Tax from tax record
- −$144 /mo · $1,722/yr
- Insurance
- −$69
- HOA
- −$0
- Vacancy / Maint / Mgmt
- −$328
- Net cashflow
- $157
Break-even live
Sensitivity live
| Price | -10% $250 | -5% $204 | +0% $157 | +5% $110 | +10% $64 |
|---|---|---|---|---|---|
| Rent | -10% $34 | -5% $95 | +0% $157 | +5% $219 | +10% $280 |
| Rate | -1.0pp $240 | -0.5pp $199 | base $157 | +0.5pp $114 | +1.0pp $71 |
UW: 25.0% down · 7.5% · 30yr · 1.5% tax · 5.0% vac · 8.0% maint · 8.0% mgmt
Financing live
Cash to close
- Down payment
- $41,250
- Closing costs
- $4,950
- Reserves months
- —
- Total cash needed
- —
Loan-product check · same deal, 3 products live
Conventional
25% down · 7.5% · 30yr
- Down + closing
- —
- Monthly P&I
- —
- Monthly cashflow
- —
- DSCR
- —
- Eligible?
- —
Personal DTI + credit; lowest rate.
DSCR
20% down · 8.5% · 30yr
- Down + closing
- —
- Monthly P&I
- —
- Monthly cashflow
- —
- DSCR
- —
- Eligible?
- —
No personal income docs; deal must DSCR.
Hard money
10% down · 12.0% · 12mo
- Down + closing
- —
- Monthly P&I
- —
- Monthly cashflow
- —
- DSCR
- —
- Eligible?
- —
Short-term bridge; refi at stabilization.
Listing history 33 events
-
2026-06-22days on market $165,000 Active 41 DOM
-
2026-06-19days on market $165,000 Active 38 DOM
-
2026-06-18days on market $165,000 Active 37 DOM
-
2026-06-17days on market $165,000 Active 36 DOM
-
2026-06-16days on market $165,000 Active 35 DOM
-
2026-06-15days on market $165,000 Active 34 DOM
-
2026-06-14days on market $165,000 Active 32 DOM
-
2026-06-12days on market $165,000 Active 31 DOM
-
2026-06-09days on market $165,000 Active 28 DOM
-
2026-06-08days on market $165,000 Active 27 DOM
-
2026-06-07pricedays on market $165,000 Active 26 DOM
-
2026-06-03days on market $180,000 Active 22 DOM
-
2026-06-02days on market $180,000 Active 21 DOM
-
2026-06-01days on market $180,000 Active 20 DOM
-
2026-05-31days on market $180,000 Active 19 DOM
-
2026-05-30days on market $180,000 Active 18 DOM
-
2026-05-11$180,000 Active 329-char remark
-
2025-05-15price $179,500
-
2025-03-11$190,000 Active
-
2017-06-16soldstatus $67,357
-
2017-06-15soldstatus $67,357
Show marketing remark (360 chars)
Income producing! Updates include: roof, windows, siding, electric, plumbing, 3 units new appliances, 1E & 2E paint throughout. 1 E new kitchen. All units have separate water, gas, & electric. Detached garages could be rented for additional income. Property has a history of finding and keeping long term tenants., Stove included, Refrigerator included
-
2016-03-09$77,500
Show marketing remark (360 chars)
Income producing! Updates include: roof, windows, siding, electric, plumbing, 3 units new appliances, 1E & 2E paint throughout. 1 E new kitchen. All units have separate water, gas, & electric. Detached garages could be rented for additional income. Property has a history of finding and keeping long term tenants., Stove included, Refrigerator included
-
2016-03-09historical
Show marketing remark (360 chars)
Income producing! Updates include: roof, windows, siding, electric, plumbing, 3 units new appliances, 1E & 2E paint throughout. 1 E new kitchen. All units have separate water, gas, & electric. Detached garages could be rented for additional income. Property has a history of finding and keeping long term tenants., Stove included, Refrigerator included
-
2013-05-17soldstatus $149,000
-
2013-05-15soldstatus $74,500
-
2013-01-14$85,000
-
2008-10-03soldstatus $63,000
-
2008-10-01soldstatus $63,000
-
2008-08-16$69,500
ⓘ Source: listings_history table (triggers on properties + properties_extension) + one-shot
backfill from property_details.listing_events for pre-trigger history.
Tax reassessment forecast IL · Partial reset (capped growth)
- Current annual tax
- $1,722 · $144/mo
- Projected year-2 tax
- $2,734 · $228/mo
- Expected delta
- +$1,012/yr (+$84/mo · 58.7%)
ⓘ Screening estimate from a state-policy table — verify with the county assessor before closing.
Climate risk First Street
- Flood 1/10 Low FEMA zone X (unshaded) · 0% chance over 30 yrs
- Wildfire 1/10 Low
- Heat 3/10 Moderate 7 d/yr ≥107°F today · 17 d/yr by 30 yrs out
- Wind 2/10 Low
- Air quality 2/10 Low 1 unhealthy d/yr today · 1 by 30 yrs out
Nearby sold comps map
Loading sold comps map…
Walkable amenities ~0.75 mi
Loading nearby amenities…
Taxation est. · year 1
- Rental income
- $18,753
- − Mortgage interest
- −$9,243
- − Property taxes
- −$1,722
- − Insurance
- −$825
- − Repairs & maintenance
- −$1,500
- − Management
- −$1,500
- − Depreciation
- −$4,800
- Taxable loss
- −$837
- Est. tax savings @ 24.0%
- +$201
- After-tax cash flow
- $2,085/yr
For passive investors: Depreciation is non-cash, so a rental often shows a tax loss while cash-flowing — sheltering income. Rental losses are passive: they offset passive income freely, and up to $25,000/yr can offset ordinary (W-2) income if you actively participate and your MAGI is under $100k (phasing out to $0 by $150k); unused losses carry forward. On sale, claimed depreciation is recaptured at up to 25%, and gains may owe capital-gains tax (a 1031 exchange can defer both). Figures are a year-1 estimate at your 24.0% rate — not tax advice; consult a CPA.
Schools (NCES district)
- District
- Quincy SD 172
- NCES district ID
- 1733000
- Math proficiency
- 24% ▬ 0.00%
- Reading proficiency
- 27% ▬ 0.00%
- Median HH income
- $44,132
- Composite
- 21.91/100
- National rank
- #8229
- State rank
- #328 of 620 in IL
Livability — Quincy
- Score
- 67/100
- State rank
- #506
- US rank
- #10458
Category grades
Schools grade is shown separately in the Schools card above.
Census & demographics
- Census place
- Quincy, IL
- County
- Adams County · 30,746 people
- City population
- 30,746
- Metro
- Quincy, IL-MO
- Population (ZIP)
- 30,746
- Household income
- $52,055
- Rent vs Own
- Severe rent burden
- 1238.0
Population outlook (Adams County) Hauer SSP2
- Today (2025)
- 65,795 people
- By 2030
- 64,436 · -2.1%
- By 2040
- 61,007 · -7.3%
- By 2050
- 56,851 · -13.6%
- By 2075
- 46,424 · -29.4%
- By 2100
- 34,305 · -47.9%
Race, ethnicity, and origin ACS 2023
- Neighborhood character
- Predominantly White (84%)
- Race & ethnicity
- White 84% Two or more races 7% Black 6% Hispanic / Latino 3% Asian 1%
- Common ancestry
- Slovak 2% Iranian 1% Lithuanian 1%
- Foreign-born
- 2% · Canada
- Languages at home
- 96% English-only · Spanish 2%
Political lean MEDSL · Adams
- 2024 margin
- Solid R (+47.4) · D 25.6% · R 73.0% · Other 1.5%
- 2008→2024 swing
- -25.0pp toward R · 2008: -22.4pp · 2024: -47.4pp
- All cycles
- 2024: R+47.4 2020: R+46.5 2016: R+47.5 2012: R+35.2 2008: R+22.4
Not yet ingested
- Civics
- —
Market trends
- HPI YoY
- ▼ -121.44%
- Current HPI
- 131.7344
- Rent YoY
- ▲ 10.78%
- Metro
- Quincy, IL-MO
- State GDP YoY
- ▲ 1.59%
- F500 in state
- 60
Industry mix (Fortune 500 HQ in IL)
| Industry | F500 HQs | Revenue |
|---|---|---|
| Insurance | 4 | $201B |
|
||
| Consumer Goods | 4 | $87B |
|
||
| Industrial Machinery | 3 | $64B |
|
||
| Healthcare | 2 | $55B |
|
||
| Retail / Pharmacy | 1 | $148B |
|
||
| Agriculture / Food | 1 | $86B |
|
||
Price history
+137.4% since first listed18 events — show timeline
- 2026-06-06 Price Changed $165,000 RMLSA as Distributed by MLS Grid
- 2026-05-11 Listed $180,000 RMLSA as Distributed by MLS Grid
- 2025-05-15 Price Changed $179,500 MARIS as Distributed by MLS Grid
- 2025-03-11 Listed $190,000 MARIS as Distributed by MLS Grid
- 2017-06-16 Sold (Public Records) $67,357 Public Records
- 2017-06-15 Sold (MLS) $67,357 RMLSA as Distributed by MLS Grid
- 2017-06-15 Sold (MLS) $67,357 Quincy AOR
- 2017-06-15 Sold (MLS) $67,357 MRED as Distributed by MLS Grid
- 2016-03-09 Listing Removed — MRED as Distributed by MLS Grid
- 2016-03-09 Listed $77,500 RMLSA as Distributed by MLS Grid
- 2016-03-09 Listed $77,500 Quincy AOR
- 2016-03-09 Listed $77,500 MRED as Distributed by MLS Grid
- 2013-05-17 Sold (Public Records) $149,000 Public Records
- 2013-05-15 Sold (MLS) $74,500 MRED as Distributed by MLS Grid
- 2013-01-14 Listed $85,000 MRED as Distributed by MLS Grid
- 2008-10-03 Sold (MLS) $63,000 MRED as Distributed by MLS Grid
- 2008-10-01 Sold (Public Records) $63,000 Public Records
- 2008-08-16 Listed $69,500 MRED as Distributed by MLS Grid
Property tax history
-0.9%/yrLatest (2023): $1,722 · +5.8% YoY. Source: county tax records.
Cash-flow waterfall
monthlySold comps — $/sqft
last 12 mo · ≤1 miLoading sold comps…