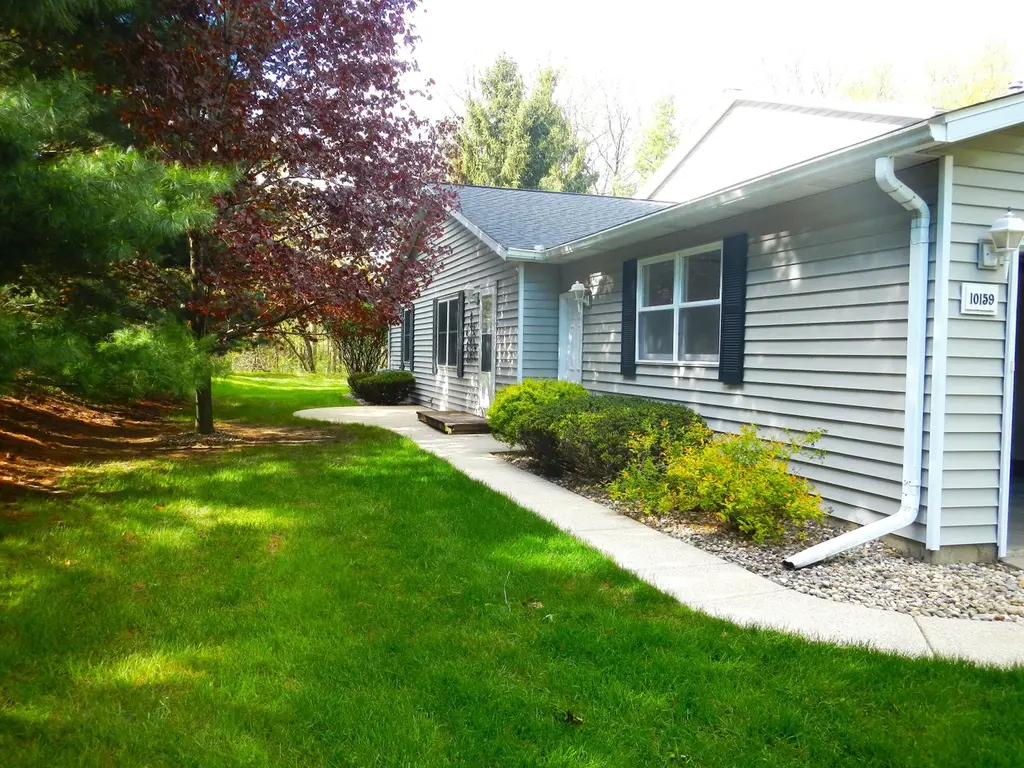
10159 S Pheasant Run · Portage, MI
Flood risk 1/10 · Minimal
- FEMA flood zone
- X (unshaded)
- Chance of flooding over 30 yrs
- 0.0%
- Est. flood insurance / yr
- $473 – $860
Fire risk 2/10 · Minimal
- Est. fire insurance / yr
- $784 – $1,456
Heat risk 2/10 · Minimal
- Hot days now (above 98°F)
- 7 days/yr
- Hot days in 30 yrs
- 16 days/yr
Wind risk 2/10 · Minimal
- Chance of severe wind over 30 yrs
- —
Air-quality risk 2/10 · Minimal
- Unhealthy air days now
- 1 days/yr
- Unhealthy air days in 30 yrs
- 1 days/yr
Risk factors via First Street. Map © Google.
Why this score? — see what drove the C+ grade
The composite is a weighted blend of 9 inputs, each scored 0–100. Each bar is that input's sub-score; the figure is the points it added to the 100-point composite (weight × sub-score).
- Cash flow +18.3/30.0
- ARV discount +15.0/15.0
- 1% rule +6.4/10.0
- DSCR +5.7/10.0
- Schools +4.8/10.0
- Rent growth +4.1/5.0
- Livability +4.0/5.0
- Condition / age +2.5/5.0
- Appreciation +0.0/10.0
$212,000
🖨 Deal sheet 📄 Offer letter ✓ Due diligence
Listing remarks MLS
This is a wonderful place to call home. Call for an appointment to see. Owner of Condo Mary Botsis is a Licensed Realtor in the state of michigan.
Key facts
- $280 HOA
- Garage
- Built 1974
Property features AI
Finance
- Financial info: Home warranty included
- HOA & community: Monthly association fee ($280) covering water, sewer, trash, snow removal, and lawn/yard care; Community clubhouse; Association present
Exterior
- Parking: Attached garage (1 space)
- Utilities: Public water; Natural gas available and connected; Electricity available; Natural gas water heater; Public sewer
- Home design: Ranch-style condominium; Built in 1974
- Construction: Vinyl siding
- Exterior features: Sidewalk; Wooded site; Site condominium; Paved road access; Composition roof
Interior
- Kitchen: Bar fridge; Dishwasher; Disposal; Microwave; Oven; Range; Refrigerator
- Bathrooms: 2 full bathrooms
- Heating & cooling: Forced air heating; Cooling (central)
- Interior features: Garage door opener; Wet bar; Pantry; Insulated windows
- Laundry & utility: Washer; Dryer; Full basement
Neighborhood map
What this means for you Summary
Snapshot
- This is a 3-bed/2.0-bath single-family listed at $212k.
Deal economics
- At list price, monthly cash flow is $193 ($2k/yr) — positive.
- The deal already cash-flows at list — no discount required.
- Meets the 1% rule at list price ($2k rent vs $212k).
- Recommended offer: $206k (3.0% below list) — sets the bar for market timing.
- Cap rate 7.4% vs local median 3.3% in Portage — top-decile yield for the area; either an underpriced asset or a hidden risk that comps aren't pricing in. Stress-test before assuming the spread holds.
Location & tenants
- Location reads 79/100 on livability (#90 in MI, #2,044 nationally) — a middle-class / working-renter tenant base. Strengths: cost of living A+, housing A+, health & safety A+; Watch: crime D+, amenities D-, commute F.
- Portage Public Schools (urban): math 48% / reading 63% proficiency, ranked #67 of 540 in MI (top 12%) — acceptable for families but not a draw, mixed tenant base, ~2y average lease.
- Market conditions: Rents rising fast (+6.4%/yr); 185 active listings in the ZIP; 3 comparable units currently listed for rent nearby; rentals lingering (median 44d on market — plan ~5-8 weeks vacancy on turnover, expect pricing pressure); 67% of comp listings sitting > 30 days — soft ceiling on asking rent; solid renter incomes; 339 units permitted in Kalamazoo County in 2024 (22 in 5+ unit buildings).
- This rent runs 32% of the median local income ($91k/yr) — at the standard rent-burdened threshold; future hikes will face affordability resistance.
Forward outlook
- Local home prices are declining (-3.0%/yr); year-one equity from $1k of loan paydown is wiped out by about $6k of value loss. Plan a longer hold.
- Kalamazoo County population projected at +18% by 2050 — long-run rental-demand tailwind backs the buy-and-hold thesis.
Negotiation context
- It's been on market 31 days — a 3% lower offer ($206k) is reasonable based on typical stale-listing flexibility.
- 5 sale attempts since 13y ago; this cycle's ask has dropped $13k (6%) from the opening price — seller is motivated, your offer sets the floor, not the list.
- Current owner paid $70k; list at $212k implies a 205% gain — meaningful room to come down on a strong offer.
Questions for the listing agent
- It's been on market 31 days. Have you received any prior offers? Is the seller open to a 3% concession, seller financing, or rate buy-down credit?
- Built in 1974 — when were the roof, HVAC, electrical panel, plumbing, and water heater last replaced?
- What does the HOA fee cover, when was the last increase, and are there any pending special assessments or reserve-fund shortfalls?
- Is there a deadline driving the sale (1031 exchange, divorce, estate, relocation)? That informs how much negotiation room exists.
- Schools are A-rated — typically a magnet for longer-tenancy family renters. What's the average tenant stay here, and is there a school-zone premium baked into asking?
- Crime grade is D in this area — have there been break-ins, vandalism, or insurance claims at this property in the last 3 years? What carrier currently insures it and at what premium?
- What's the average days-on-market for RENTAL listings here right now (not sales)? A rising rental-DOM trend means longer vacancies and softer asking-rent achievability than the comps imply.
- What's the recent tenant-quality profile in this submarket — average credit score on applications, eviction rate, late-payment / NSF rate, and stable-employment percentage? A property-management company in the area should have these aggregated.
- How much new for-sale + rental construction is in the pipeline within 1–3 miles? Heavy new supply typically softens prices + rents 12–24 months out; constrained supply supports both.
Investment metrics
- 1% rule
- 1.14% ✓
- Cap rate
- 7.39%
- Cash-on-cash
- 3.91%
- DSCR
- 1.17
- GRM
- 7.3
CMA / ARV
- ARV (on-the-fly)
- $296,400
- Comps found
- 5
Show comp detail 5 sales within ~0.75 mi
| Address | Dist | Beds/Ba | Sqft | Sold | Price | $/sf | Match |
|---|---|---|---|---|---|---|---|
| 9426 S Westnedge Ave | 0.70mi | 4/1.5 (+1) | 1,944 (+2%) | 9mo | $355,000 | $183 | 49 |
| 420 Montague Dr | 0.40mi | 3/2.5 | 2,122 (+12%) | 14mo | $330,000 | $156 | 48 |
| 220 E Osterhout Ave | 0.43mi | 4/2.0 (+1) | 2,032 (+7%) | 22mo | $299,900 | $148 | 44 |
| 1017 Karendale Ave | 0.69mi | 3/2.0 | 1,733 (-9%) | 14mo | $302,000 | $174 | 42 |
| 225 E Osterhout Ave | 0.39mi | 3/1.0 | 1,656 (-13%) | 19mo | $245,000 | $148 | 41 |
Match score weights: distance 35% · size 25% · config 20% · recency 20%. Top-matched comps best support the ARV.
Projected returns pro-forma
-3.0% appreciation · 6.36% rent growth · sell at horizon
- IRR
- -5.9%
- Equity multiple
- 0.77×
- Total profit
- $-13,421
- Equity at exit
- $31,610
- IRR
- 7.9%
- Equity multiple
- 1.71×
- Total profit
- $41,980
- Equity at exit
- $18,330
Cash invested: $59,360 (down + closing). Projections, not guarantees.
Landlord ↔ Tenant lean methodology
- Overall (STATE)
- 62 Landlord-Friendly
- State Michigan
- 62 Landlord-Friendly · EVEN
- County
- — inherits STATE
- City
- — inherits STATE
ZIP-level market 49024
- Rents YoY
- 6.4%
- Active inventory
- 185
- Price-to-rent
- 7.3×
Monthly cashflow live
- Estimated rent
- $2,410 medium interval (Pro) →
- Mortgage (P&I)
- −$1,112
- Tax from tax record
- −$231 /mo · $2,768/yr
- Insurance
- −$88
- HOA
- −$280
- Vacancy / Maint / Mgmt
- −$506
- Net cashflow
- $193
Break-even live
UW: 25.0% down · 7.5% · 30yr · 1.5% tax · 5.0% vac · 8.0% maint · 8.0% mgmt
Financing live
Cash to close
- Down payment
- $53,000
- Closing costs
- $6,360
- Reserves months
- —
- Total cash needed
- —
Loan-product check · same deal, 3 products live
Conventional
25% down · 7.5% · 30yr
- Down + closing
- —
- Monthly P&I
- —
- Monthly cashflow
- —
- DSCR
- —
- Eligible?
- —
Personal DTI + credit; lowest rate.
DSCR
20% down · 8.5% · 30yr
- Down + closing
- —
- Monthly P&I
- —
- Monthly cashflow
- —
- DSCR
- —
- Eligible?
- —
No personal income docs; deal must DSCR.
Hard money
10% down · 12.0% · 12mo
- Down + closing
- —
- Monthly P&I
- —
- Monthly cashflow
- —
- DSCR
- —
- Eligible?
- —
Short-term bridge; refi at stabilization.
Rent comps 3 comps
| Address | Beds | Baths | Sqft | Rent | $/sqft | DOM | Units | Dist |
|---|---|---|---|---|---|---|---|---|
| 10328 Pennridge Dr Portage, MI | 3.0 | 2.0 | 1530 | $2,295 | $1.50 | 43d | 1 | 1.05mi |
| 10240 Pennridge Dr Portage, MI | 3.0 | 2.0 | 1530 | $2,395 | $1.57 | 43d | 1 | 1.06mi |
| 1847 Bluff Ridge Ct Portage, MI | 3.0 | 2.0 | 1610 | $2,995 | $1.86 | 20d | 1 | 1.41mi |
HOA detail
- Monthly dues
- $280 · $3,360/yr
Listing history 27 events
-
2026-06-19status $212,000 Pending 31 DOM
-
2026-06-18days on market $212,000 Active 31 DOM
-
2026-06-17days on market $212,000 Active 30 DOM
-
2026-06-16days on market $212,000 Active 29 DOM
-
2026-06-15days on market $212,000 Active 28 DOM
-
2026-06-14days on market $212,000 Active 26 DOM
-
2026-06-13days on market $212,000 Active 25 DOM
-
2026-06-10remarks 230-char remark
-
2026-06-10days on market $212,000 Active 23 DOM
-
2026-06-09days on market $212,000 Active 22 DOM
-
2026-06-09price $212,000 Active 21 DOM
-
2026-06-08days on market $225,000 Active 21 DOM
-
2026-06-07days on market $225,000 Active 20 DOM
-
2026-06-05days on market $225,000 Active 17 DOM
-
2026-06-03days on market $225,000 Active 16 DOM
-
2026-06-02days on market $225,000 Active 15 DOM
-
2026-06-01days on market $225,000 Active 14 DOM
-
2026-05-31days on market $225,000 Active 13 DOM
-
2026-05-30days on market $225,000 Active 12 DOM
-
2026-05-18$225,000 Active 146-char remark
Show marketing remark (146 chars)
This is a wonderful place to call home. Call for an appointment to see. Owner of Condo Mary Botsis is a Licensed Realtor in the state of michigan.
-
2026-05-18$225,000 Active
Show marketing remark (146 chars)
This is a wonderful place to call home. Call for an appointment to see. Owner of Condo Mary Botsis is a Licensed Realtor in the state of michigan.
-
2026-05-18$225,000 Active 146-char remark
Show marketing remark (146 chars)
This is a wonderful place to call home. Call for an appointment to see. Owner of Condo Mary Botsis is a Licensed Realtor in the state of michigan.
-
2013-05-01soldstatus $69,600
-
2013-04-25soldstatus $69,600
-
2013-04-25soldstatus $69,600
-
2013-03-16$75,000
-
2013-03-16$75,000
ⓘ Source: listings_history table (triggers on properties + properties_extension) + one-shot
backfill from property_details.listing_events for pre-trigger history.
Tax reassessment forecast MI · Partial reset (capped growth)
- Current annual tax
- $2,768 · $231/mo
- Projected year-2 tax
- $3,017 · $251/mo
- Expected delta
- +$248/yr (+$21/mo · 9.0%)
ⓘ Screening estimate from a state-policy table — verify with the county assessor before closing.
Climate risk First Street
- Flood 1/10 Low FEMA zone X (unshaded) · 0% chance over 30 yrs
- Wildfire 2/10 Low
- Heat 2/10 Low 7 d/yr ≥98°F today · 16 d/yr by 30 yrs out
- Wind 2/10 Low
- Air quality 2/10 Low 1 unhealthy d/yr today · 1 by 30 yrs out
Nearby sold comps map
Loading sold comps map…
Walkable amenities ~0.75 mi
Loading nearby amenities…
Taxation est. · year 1
- Rental income
- $28,925
- − Mortgage interest
- −$11,875
- − Property taxes
- −$2,768
- − Insurance
- −$1,060
- − Repairs & maintenance
- −$2,314
- − Management
- −$2,314
- − HOA
- −$3,360
- − Depreciation
- −$6,167
- Taxable loss
- −$934
- Est. tax savings @ 24.0%
- +$224
- After-tax cash flow
- $2,546/yr
For passive investors: Depreciation is non-cash, so a rental often shows a tax loss while cash-flowing — sheltering income. Rental losses are passive: they offset passive income freely, and up to $25,000/yr can offset ordinary (W-2) income if you actively participate and your MAGI is under $100k (phasing out to $0 by $150k); unused losses carry forward. On sale, claimed depreciation is recaptured at up to 25%, and gains may owe capital-gains tax (a 1031 exchange can defer both). Figures are a year-1 estimate at your 24.0% rate — not tax advice; consult a CPA.
Schools (NCES district)
- District
- Portage Public Schools
- NCES district ID
- 2628950
- Math proficiency
- 48% ▼ -9.00%
- Reading proficiency
- 63% ▼ -2.00%
- Median HH income
- $61,322
- Composite
- 48.37/100
- National rank
- #2142
- State rank
- #67 of 540 in MI
Livability — Portage
- Score
- 79/100
- State rank
- #90
- US rank
- #2044
Category grades
Schools grade is shown separately in the Schools card above.
Census & demographics
- Census place
- Portage, MI
- County
- Kalamazoo County · 224,317 people
- City population
- 50,560
- Metro
- Kalamazoo-Portage, MI
- Population (ZIP)
- 30,823
- Household income
- $91,105
- Rent vs Own
- Severe rent burden
- 698.0
Population outlook (Kalamazoo County) Hauer SSP2
- Today (2025)
- 280,982 people
- By 2030
- 292,068 · +3.9%
- By 2040
- 312,191 · +11.1%
- By 2050
- 331,196 · +17.9%
- By 2075
- 379,021 · +34.9%
- By 2100
- 396,579 · +41.1%
Race, ethnicity, and origin ACS 2023
- Neighborhood character
- Predominantly White (78%)
- Race & ethnicity
- White 78% Black 7% Two or more races 7% Hispanic / Latino 6% Asian 5%
- Hispanic origin (detail)
- Mexican 4%
- Common ancestry
- Iranian 9% Romanian 5% Italian 3%
- Foreign-born
- 8% · Canada, China, Vietnam
- Languages at home
- 90% English-only · Spanish 3% Other Indo-European 2% Other Asian/Pacific 2%
Political lean MEDSL · Kalamazoo
- 2024 margin
- D (+17.7) · D 58.0% · R 40.3% · Other 1.7%
- 2008→2024 swing
- -1.8pp toward R · 2008: 19.5pp · 2024: 17.7pp
- All cycles
- 2024: D+17.7 2020: D+18.7 2016: D+12.8 2012: D+13.3 2008: D+19.5
Not yet ingested
- Civics
- —
Market trends
- HPI YoY
- ▼ -239.74%
- Current HPI
- 215.2275
- Rent YoY
- ▲ 6.36%
- Metro
- Kalamazoo-Portage, MI
- State GDP YoY
- ▲ 1.37%
- F500 in state
- 28
Industry mix (Fortune 500 HQ in MI)
| Industry | F500 HQs | Revenue |
|---|---|---|
| Automotive Parts | 3 | $48B |
|
||
| Automotive | 2 | $372B |
|
||
| Chemicals | 1 | $45B |
|
||
| Automotive Retail | 1 | $29B |
|
||
| Healthcare / Medical Devices | 1 | $23B |
|
||
| Automotive Technology | 1 | $20B |
|
||
Price history
+200.0% since first listed8 events — show timeline
- 2026-05-18 Listed $225,000 REALCOMP
- 2026-05-18 Listed $225,000 MiRealSource-MiMLS
- 2026-05-18 Listed $225,000 SW Michigan MLS
- 2013-05-01 Sold (Public Records) $69,600 Public Records
- 2013-04-25 Sold (MLS) $69,600 REALCOMP
- 2013-04-25 Sold (MLS) $69,600 SW Michigan MLS
- 2013-03-16 Listed $75,000 REALCOMP
- 2013-03-16 Listed $75,000 SW Michigan MLS
Property tax history
+64.4%/yrLatest (2025): $2,768 · +12.7% YoY. Source: county tax records.
Cash-flow waterfall
monthlySold comps — $/sqft
last 12 mo · ≤1 miLoading sold comps…