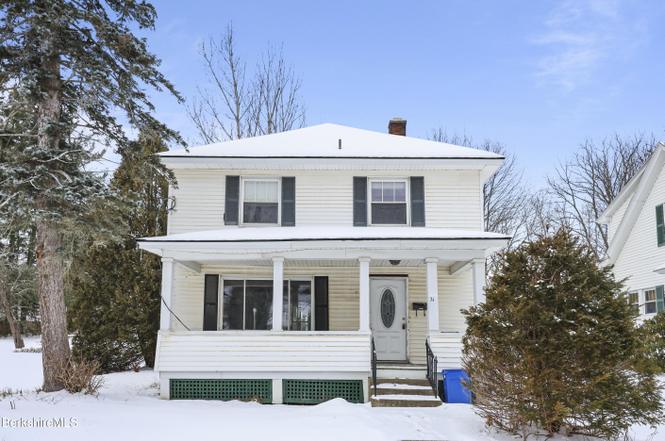
21 Ensign Ave · Pittsfield, MA
Flood risk 1/10 · Minimal
- FEMA flood zone
- X
- Chance of flooding over 30 yrs
- 0.0%
- Est. flood insurance / yr
- $473 – $860
Fire risk 1/10 · Minimal
- Est. fire insurance / yr
- $915 – $1,699
Heat risk 2/10 · Minimal
- Hot days now (above 92°F)
- 7 days/yr
- Hot days in 30 yrs
- 16 days/yr
Wind risk 4/10 · Minor
- Chance of severe wind over 30 yrs
- 9.0%
Air-quality risk 2/10 · Minimal
- Unhealthy air days now
- 1 days/yr
- Unhealthy air days in 30 yrs
- 1 days/yr
Risk factors via First Street. Map © Google.
Why this score? — see what drove the C grade
The composite is a weighted blend of 9 inputs, each scored 0–100. Each bar is that input's sub-score; the figure is the points it added to the 100-point composite (weight × sub-score).
- Cash flow +19.5/30.0
- ARV discount +15.0/15.0
- DSCR +6.2/10.0
- 1% rule +5.5/10.0
- Rent growth +4.4/5.0
- Livability +3.8/5.0
- Condition / age +2.5/5.0
- Schools +2.3/10.0
- Appreciation +0.0/10.0
$182,900
🖨 Deal sheet 📄 Offer letter ✓ Due diligence
Listing remarks MLS
Property being sold 'As Is'. Newer windows, wood floors, 2 car garage and pantry. First floor laundry.
Key facts
- Adjacent lot
- Interior cleaned out
- New roof
Tags
Neighborhood map
What this means for you Summary
Snapshot
- This is a 3-bed/1.0-bath single-family listed at $183k.
Deal economics
- At list price, monthly cash flow is $207 ($2k/yr) — positive.
- The deal already cash-flows at list — no discount required.
- Meets the 1% rule at list price ($2k rent vs $183k).
- Recommended offer: $177k (3.0% below list) — sets the bar for market timing.
- Cap rate 7.7% vs local median 3.6% in Pittsfield — top-decile yield for the area; either an underpriced asset or a hidden risk that comps aren't pricing in. Stress-test before assuming the spread holds.
Location & tenants
- Location reads 75/100 on livability (#70 in MA, #3,820 nationally) — a middle-class / working-renter tenant base. Strengths: commute A+, housing A+, health & safety A+; Watch: employment C-, amenities D+, crime D.
- Pittsfield (urban): math 19% / reading 34% proficiency, ranked #272 of 302 in MA (top 90%) — low school quality limits family demand, transient renter base, plan for 1-2y turnover.
- Zoned schools: Pittsfield High (math 32% / reading 57%, grade F, #203 of 343 statewide, top 60%, 651 students, 0% FRL) — zoned schools average 0% FRL vs 50% district-wide (50 pts lower); this property's tenant base skews higher-income than the district average.
- Zoned-school proficiency averages 44% at this address vs 26% district-wide (+18 pts) — the actual schools serving this property are materially stronger than the Pittsfield average implies; a family-tenant draw the district grade alone would hide.
- Market conditions: Rents rising fast (+7.7%/yr); 275 active listings in the ZIP; 5 comparable units currently listed for rent nearby; rentals lingering (median 44d on market — plan ~5-8 weeks vacancy on turnover, expect pricing pressure); 100% of comp listings sitting > 30 days — soft ceiling on asking rent; 130 units permitted in Berkshire County in 2024 (10 in 5+ unit buildings).
Forward outlook
- Local home prices are declining (-3.0%/yr); year-one equity from $1k of loan paydown is wiped out by about $5k of value loss. Plan a longer hold.
- Berkshire County population projected at -24% by 2050 — secular population decline; favor cash flow + early exit over multi-decade hold.
- At projected returns (-3.0% appreciation + 7.7% rent growth), your $51k cash investment doubles in ~10 years — after that, you're playing with house money.
Negotiation context
- It's been on market 54 days — a 3% lower offer ($177k) is reasonable based on typical stale-listing flexibility.
- 5 sale attempts since 24y ago; this cycle's ask has dropped $17k (9%) from the opening price — seller is motivated, your offer sets the floor, not the list.
- Current owner paid $120k; list at $183k implies a 52% gain — meaningful room to come down on a strong offer.
Risks & watch-outs
- Watch-outs: built in 1930 — expect roof / HVAC / electrical / plumbing capex.
Questions for the listing agent
- It's been on market 54 days. Have you received any prior offers? Is the seller open to a 3% concession, seller financing, or rate buy-down credit?
- Built in 1930 — when were the roof, HVAC, electrical panel, plumbing, and water heater last replaced?
- Is there a deadline driving the sale (1031 exchange, divorce, estate, relocation)? That informs how much negotiation room exists.
- Schools are D-rated, which usually means shorter tenancies and higher turnover. Who's the typical renter profile here, and what's been the actual vacancy rate?
- Crime grade is D in this area — have there been break-ins, vandalism, or insurance claims at this property in the last 3 years? What carrier currently insures it and at what premium?
- What's the average days-on-market for RENTAL listings here right now (not sales)? A rising rental-DOM trend means longer vacancies and softer asking-rent achievability than the comps imply.
- What's the recent tenant-quality profile in this submarket — average credit score on applications, eviction rate, late-payment / NSF rate, and stable-employment percentage? A property-management company in the area should have these aggregated.
- How much new for-sale + rental construction is in the pipeline within 1–3 miles? Heavy new supply typically softens prices + rents 12–24 months out; constrained supply supports both.
Investment metrics
- 1% rule
- 1.05% ✓
- Cap rate
- 7.65%
- Cash-on-cash
- 4.85%
- DSCR
- 1.22
- GRM
- 7.9
CMA / ARV
- ARV (on-the-fly)
- $272,727
- Comps found
- 12
Show comp detail 12 sales within ~0.75 mi
| Address | Dist | Beds/Ba | Sqft | Sold | Price | $/sf | Match |
|---|---|---|---|---|---|---|---|
| 21 Ensign Ave | 0.00mi | 3/1.5 | 1,443 (0%) | 1mo | $161,999 | $112 | 98 |
| 40 Roland St | 0.13mi | 3/1.0 | 1,486 (+3%) | 1mo | $275,000 | $185 | 88 |
| 11 Stanley Ave | 0.05mi | 3/1.0 | 1,539 (+7%) | 7mo | $270,000 | $175 | 80 |
| 121 Elberon Ave | 0.43mi | 3/1.0 | 1,440 (-0%) | 2mo | $338,000 | $235 | 78 |
| 71 Dickinson Ave | 0.25mi | 4/1.0 (+1) | 1,353 (-6%) | 2mo | $183,000 | $135 | 72 |
| 89 Delancy Ave | 0.20mi | 3/1.5 | 1,296 (-10%) | 2mo | $344,000 | $265 | 70 |
| 123 Broadview Ter | 0.22mi | 3/1.5 | 1,246 (-14%) | 4mo | $280,000 | $225 | 62 |
| 25 Kensington Ave | 0.67mi | 3/1.0 | 1,426 (-1%) | 7mo | $267,000 | $187 | 61 |
| 258 Dalton Ave | 0.39mi | 3/1.0 | 1,260 (-13%) | 3mo | $190,950 | $152 | 58 |
| 156 Draper Ave | 0.36mi | 4/1.0 (+1) | 1,285 (-11%) | 4mo | $299,000 | $233 | 57 |
| 52 Bossidy Dr | 0.58mi | 4/1.0 (+1) | 1,497 (+4%) | 6mo | $283,000 | $189 | 56 |
| 153 Elberon Ave | 0.50mi | 3/3.0 | 1,353 (-6%) | 5mo | $349,900 | $259 | 54 |
Match score weights: distance 35% · size 25% · config 20% · recency 20%. Top-matched comps best support the ARV.
Projected returns pro-forma
-3.0% appreciation · 7.72% rent growth · sell at horizon
- IRR
- -3.4%
- Equity multiple
- 0.87×
- Total profit
- $-6,823
- Equity at exit
- $27,271
- IRR
- 11.1%
- Equity multiple
- 2.07×
- Total profit
- $54,577
- Equity at exit
- $15,814
Cash invested: $51,212 (down + closing). Projections, not guarantees.
Landlord ↔ Tenant lean methodology
- Overall (STATE)
- 20 Strongly Tenant-Friendly
- State Massachusetts
- 20 Strongly Tenant-Friendly · D+15
- County
- — inherits STATE
- City
- — inherits STATE
ZIP-level market 01201
- Rents YoY
- 7.7%
- Active inventory
- 275
- Price-to-rent
- 7.9×
Monthly cashflow live
- Estimated rent
- $1,924 high interval (Pro) →
- Mortgage (P&I)
- −$959
- Tax from tax record
- −$277 /mo · $3,327/yr
- Insurance
- −$76
- HOA
- −$0
- Vacancy / Maint / Mgmt
- −$404
- Net cashflow
- $207
Break-even live
UW: 25.0% down · 7.5% · 30yr · 1.5% tax · 5.0% vac · 8.0% maint · 8.0% mgmt
Financing live
Cash to close
- Down payment
- $45,725
- Closing costs
- $5,487
- Reserves months
- —
- Total cash needed
- —
Loan-product check · same deal, 3 products live
Conventional
25% down · 7.5% · 30yr
- Down + closing
- —
- Monthly P&I
- —
- Monthly cashflow
- —
- DSCR
- —
- Eligible?
- —
Personal DTI + credit; lowest rate.
DSCR
20% down · 8.5% · 30yr
- Down + closing
- —
- Monthly P&I
- —
- Monthly cashflow
- —
- DSCR
- —
- Eligible?
- —
No personal income docs; deal must DSCR.
Hard money
10% down · 12.0% · 12mo
- Down + closing
- —
- Monthly P&I
- —
- Monthly cashflow
- —
- DSCR
- —
- Eligible?
- —
Short-term bridge; refi at stabilization.
Rent comps 5 comps
| Address | Beds | Baths | Sqft | Rent | $/sqft | DOM | Units | Dist |
|---|---|---|---|---|---|---|---|---|
| 76 Stoddard Ave Unit 78 Pittsfield, MA | 4.0 | 1.5 | 1560 | $2,000 | $1.28 | 43d | 1 | 0.69mi |
| 117 Lincoln St Unit 117 Pittsfield, MA | 4.0 | 2.0 | 1500 | $2,000 | $1.33 | 43d | 1 | 0.78mi |
| 88 Wahconah St Pittsfield, MA | 4.0 | 1.5 | 1292 | $2,300 | $1.78 | 43d | 1 | 1.06mi |
| 456 Fenn St Unit 4 Pittsfield, MA | 2.0 | 1.0 | 1000 | $1,450 | $1.45 | 43d | 1 | 1.08mi |
| 24 Curtin Ave Pittsfield, MA | 3.0 | 1.5 | 1176 | $1,600 | $1.36 | 43d | 1 | 1.26mi |
Listing history 14 events
-
2026-03-04status Pending
-
2026-01-30price $182,900
-
2026-01-08$199,900 Active
-
2018-04-28historical
-
2017-11-17$149,900
-
2009-04-17soldstatus $120,000 102-char remark
Show marketing remark (102 chars)
Property being sold 'As Is'. Newer windows, wood floors, 2 car garage and pantry. First floor laundry.
-
2008-10-02$129,900 102-char remark
Show marketing remark (102 chars)
Property being sold 'As Is'. Newer windows, wood floors, 2 car garage and pantry. First floor laundry.
-
2005-11-16soldstatus $146,500
-
2005-11-16soldstatus $146,500
-
2005-11-15soldstatus $146,500
-
2005-08-10$145,000
-
2002-12-31soldstatus $119,000
-
2002-12-31soldstatus $119,000
-
2002-11-12$120,000
ⓘ Source: listings_history table (triggers on properties + properties_extension) + one-shot
backfill from property_details.listing_events for pre-trigger history.
Tax reassessment forecast MA · Partial reset (capped growth)
- Current annual tax
- $3,327 · $277/mo
- Projected year-2 tax
- $3,327 · $277/mo
- Expected delta
- $0/yr ($0/mo · 0.0%)
ⓘ Screening estimate from a state-policy table — verify with the county assessor before closing.
Climate risk First Street
- Flood 1/10 Low FEMA zone X · 0% chance over 30 yrs
- Wildfire 1/10 Low
- Heat 2/10 Low 7 d/yr ≥92°F today · 16 d/yr by 30 yrs out
- Wind 4/10 Moderate 9% chance of damaging wind over 30 yrs
- Air quality 2/10 Low 1 unhealthy d/yr today · 1 by 30 yrs out
Nearby sold comps map
Loading sold comps map…
Walkable amenities ~0.75 mi
Loading nearby amenities…
Taxation est. · year 1
- Rental income
- $23,083
- − Mortgage interest
- −$10,245
- − Property taxes
- −$3,327
- − Insurance
- −$914
- − Repairs & maintenance
- −$1,847
- − Management
- −$1,847
- − Depreciation
- −$5,321
- Taxable loss
- −$418
- Est. tax savings @ 24.0%
- +$100
- After-tax cash flow
- $2,585/yr
For passive investors: Depreciation is non-cash, so a rental often shows a tax loss while cash-flowing — sheltering income. Rental losses are passive: they offset passive income freely, and up to $25,000/yr can offset ordinary (W-2) income if you actively participate and your MAGI is under $100k (phasing out to $0 by $150k); unused losses carry forward. On sale, claimed depreciation is recaptured at up to 25%, and gains may owe capital-gains tax (a 1031 exchange can defer both). Figures are a year-1 estimate at your 24.0% rate — not tax advice; consult a CPA.
Schools (NCES district)
- District
- Pittsfield
- NCES district ID
- 2509630
- Math proficiency
- 19% ▼ -10.00%
- Reading proficiency
- 34% ▼ -2.00%
- Median HH income
- $44,032
- Composite
- 22.67/100
- National rank
- #8046
- State rank
- #272 of 302 in MA
Livability — Pittsfield
- Score
- 75/100
- State rank
- #70
- US rank
- #3820
Category grades
Schools grade is shown separately in the Schools card above.
Census & demographics
- Census place
- Pittsfield, MA
- County
- Berkshire County · 44,848 people
- City population
- 44,848
- Metro
- Pittsfield, MA
- Population (ZIP)
- 44,848
- Household income
- $71,093
- Rent vs Own
- Severe rent burden
- 1580.0
Population outlook (Berkshire County) Hauer SSP2
- Today (2025)
- 119,723 people
- By 2030
- 114,608 · -4.3%
- By 2040
- 102,806 · -14.1%
- By 2050
- 91,305 · -23.7%
- By 2075
- 71,517 · -40.3%
- By 2100
- 57,988 · -51.6%
Race, ethnicity, and origin ACS 2023
- Neighborhood character
- Predominantly White (78%)
- Race & ethnicity
- White 78% Two or more races 10% Hispanic / Latino 9% Black 5% Asian 1%
- Hispanic origin (detail)
- Puerto Rican 3%
- Common ancestry
- Lithuanian 8% Romanian 6% Slovak 2%
- Foreign-born
- 7% · Canada, Jamaica
- Languages at home
- 90% English-only · Spanish 6% Other Indo-European 1% Russian/Polish/Slavic 1%
Political lean MEDSL · Berkshire
- 2024 margin
- Solid D (+39.9) · D 68.9% · R 29.0% · Other 2.1%
- 2008→2024 swing
- -12.5pp toward R · 2008: 52.4pp · 2024: 39.9pp
- All cycles
- 2024: D+39.9 2020: D+47.1 2016: D+41.5 2012: D+53.7 2008: D+52.4
Not yet ingested
- Civics
- —
Market trends
- HPI YoY
- ▼ -199.88%
- Current HPI
- 283.3421
- Rent YoY
- ▲ 7.72%
- Metro
- Pittsfield, MA
- State GDP YoY
- ▲ 2.28%
- F500 in state
- 38
Industry mix (Fortune 500 HQ in MA)
| Industry | F500 HQs | Revenue |
|---|---|---|
| Technology | 3 | $17B |
|
||
| Insurance | 2 | $84B |
|
||
| Retail | 2 | $76B |
|
||
| Life Sciences | 1 | $43B |
|
||
| Energy Technology | 1 | $31B |
|
||
| Aerospace / Defense | 1 | $18B |
|
||
Price history
+52.4% since first listed14 events — show timeline
- 2026-03-04 Pending — BCMLS
- 2026-01-30 Price Changed $182,900 BCMLS
- 2026-01-08 Listed $199,900 BCMLS
- 2018-04-28 Listing Removed — BCMLS
- 2017-11-17 Listed $149,900 BCMLS
- 2009-04-17 Sold (MLS) $120,000 BCMLS
- 2008-10-02 Listed $129,900 BCMLS
- 2005-11-16 Sold (Public Records) $146,500 Public Records
- 2005-11-16 Sold (Public Records) $146,500 Public Records
- 2005-11-15 Sold (MLS) $146,500 BCMLS
- 2005-08-10 Listed $145,000 BCMLS
- 2002-12-31 Sold (Public Records) $119,000 Public Records
- 2002-12-31 Sold (MLS) $119,000 BCMLS
- 2002-11-12 Listed $120,000 BCMLS
Property tax history
+7.0%/yrLatest (2023): $3,327 · +9.0% YoY. Source: county tax records.
Cash-flow waterfall
monthlySold comps — $/sqft
last 12 mo · ≤1 miLoading sold comps…