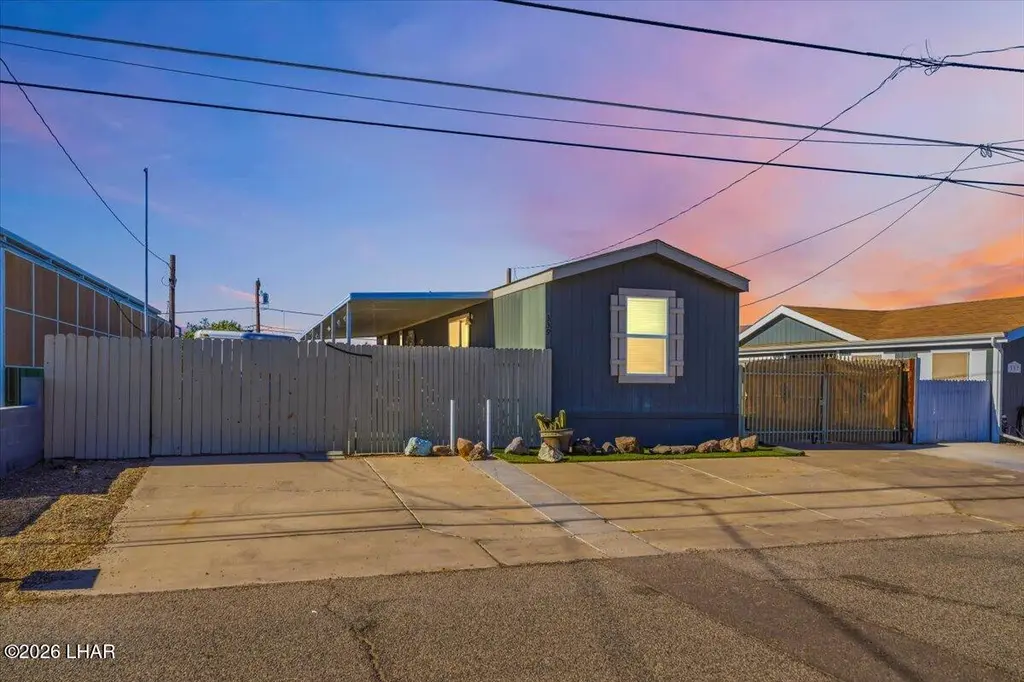
339 N Moonlight Dr · Bluewater, AZ
Flood risk No data
- FEMA flood zone
- —
- Chance of flooding over 30 yrs
- —
- Est. flood insurance / yr
- —
Fire risk No data
- Est. fire insurance / yr
- —
Heat risk No data
- Hot days now (above threshold)
- —
- Hot days in 30 yrs
- —
Wind risk No data
- Chance of severe wind over 30 yrs
- —
Air-quality risk No data
- Unhealthy air days now
- —
- Unhealthy air days in 30 yrs
- —
Risk factors via First Street. Map © Google.
Why this score? — see what drove the B- grade
The composite is a weighted blend of 9 inputs, each scored 0–100. Each bar is that input's sub-score; the figure is the points it added to the 100-point composite (weight × sub-score).
- Cash flow +30.0/30.0
- 1% rule +10.0/10.0
- DSCR +10.0/10.0
- ARV discount +6.9/15.0
- Condition / age +3.8/5.0
- Livability +3.2/5.0
- Rent growth +2.5/5.0
- Schools +1.5/10.0
- Appreciation +0.0/10.0
$112,000
🖨 Deal sheet 📄 Offer letter ✓ Due diligence
Listing remarks
ON LEASED LAND. Welcome to effortless river living in this must-see, turn-key 2016 Cavco manufactured home located in the highly sought-after BlueWater Lagoon Estates. What truly sets this property apart is the incredible parking and access--gated on both sides with swing-open entry, offering exceptional space for your motorhome, boat, trailers, off-road toys, or all of the above. With approximately 20x50 frontage parking and an additional 16x80 side parking area (plus an additional 10x80 side parking on the right hand side), there's room for everything you need to enjoy the river lifestyle to the fullest. Situated on a 50x105 lot, this home comes fully furnished and move-in ready, includin
Key facts
- Dog park
- Community pool
- Recreation room
Tags
Property features AI
Finance
- Other: Located in PA-MH Manufactured Home Overlay District
- Financial info: Land is leased
Exterior
- Parking: Carport; Oversized parking
- Utilities: Public water; Public sewer; Propane
- Home design: Manufactured home (single wide); Residential property
- Construction: Vertical siding; Shingle roof
- Exterior features: Back yard fencing; Shed(s); Gunite pool
Interior
- Flooring: Vinyl
- Bathrooms: 2 full bathrooms
- Heating & cooling: Central heating; Central air conditioning
- Interior features: Furnished; Vinyl flooring
Neighborhood map
What this means for you Summary
Snapshot
- This is a 2-bed/2.0-bath manufactured listed at $112k. Condition is rated good.
Deal economics
- At list price, monthly cash flow is $630 ($8k/yr) — positive.
- The deal already cash-flows at list — no discount required.
- Meets the 1% rule at list price ($2k rent vs $112k).
- Recommended offer: $110k (1.5% below list) — sets the bar for market timing.
- Cap rate 13.0% vs local median 9.9% in Bluewater — top-decile yield for the area; either an underpriced asset or a hidden risk that comps aren't pricing in. Stress-test before assuming the spread holds.
Location & tenants
- Location reads 65/100 on livability (#81 in AZ) — a middle-class / working-renter tenant base. Strengths: cost of living A+, housing A+, crime A-; Watch: health & safety C-, employment D+, schools F.
- Parker Unified School District (4510) (town): math 18% / reading 18% proficiency, ranked #200 of 249 in AZ (top 80%) — low school quality limits family demand, transient renter base, plan for 1-2y turnover; 69% free/reduced lunch — lower-income household profile, screen leases tightly.
- Market conditions: 147 active listings in the ZIP; 92 units permitted in La Paz County in 2024 (0 in 5+ unit buildings).
Forward outlook
- Local home prices are declining (-3.0%/yr); year-one equity from $774 of loan paydown is wiped out by about $3k of value loss. Plan a longer hold.
- La Paz County population projected at -11% by 2050 — secular population decline; favor cash flow + early exit over multi-decade hold.
- At projected returns (-3.0% appreciation + 3.0% rent growth), your $31k cash investment doubles in ~6 years — after that, you're playing with house money.
Negotiation context
- It's been on market 27 days — a 2% lower offer ($110k) is reasonable based on typical stale-listing flexibility.
Questions for the listing agent
- Is there a deadline driving the sale (1031 exchange, divorce, estate, relocation)? That informs how much negotiation room exists.
- Schools are F-rated, which usually means shorter tenancies and higher turnover. Who's the typical renter profile here, and what's been the actual vacancy rate?
- What's the average days-on-market for RENTAL listings here right now (not sales)? A rising rental-DOM trend means longer vacancies and softer asking-rent achievability than the comps imply.
- What's the recent tenant-quality profile in this submarket — average credit score on applications, eviction rate, late-payment / NSF rate, and stable-employment percentage? A property-management company in the area should have these aggregated.
- How much new for-sale + rental construction is in the pipeline within 1–3 miles? Heavy new supply typically softens prices + rents 12–24 months out; constrained supply supports both.
Investment metrics
- 1% rule
- 1.59% ✓
- Cap rate
- 13.04%
- Cash-on-cash
- 24.10%
- DSCR
- 2.07
- GRM
- 5.3
CMA / ARV
- ARV (on-the-fly)
- $110,416
- Comps found
- 4
Show comp detail 4 sales within ~0.75 mi
| Address | Dist | Beds/Ba | Sqft | Sold | Price | $/sf | Match |
|---|---|---|---|---|---|---|---|
| 322 N Misty Ln | 0.06mi | 2/2.0 | 840 (+2%) | 4mo | $112,500 | $134 | 90 |
| 408 N Stardust Ln | 0.06mi | 2/2.0 | 720 (-13%) | 0mo | $52,500 | $73 | 76 |
| 401 Bluewater Dr | 0.14mi | 2/1.0 | 750 (-9%) | 2mo | $60,000 | $80 | 72 |
| 431 Paradise Ln | 0.22mi | 2/2.0 | 720 (-13%) | 18mo | $103,000 | $143 | 53 |
Match score weights: distance 35% · size 25% · config 20% · recency 20%. Top-matched comps best support the ARV.
Projected returns pro-forma
-3.0% appreciation · 3.0% rent growth · sell at horizon
- IRR
- 17.4%
- Equity multiple
- 1.70×
- Total profit
- $21,986
- Equity at exit
- $16,700
- IRR
- 25.9%
- Equity multiple
- 3.26×
- Total profit
- $70,900
- Equity at exit
- $9,684
Cash invested: $31,360 (down + closing). Projections, not guarantees.
Landlord ↔ Tenant lean methodology
- Overall (STATE)
- 87 Strongly Landlord-Friendly
- State Arizona
- 87 Strongly Landlord-Friendly · R+3
- County
- — inherits STATE
- City
- — inherits STATE
ZIP-level market 85344
- Active inventory
- 147
- Price-to-rent
- 5.3×
Monthly cashflow live
- Estimated rent
- $1,777 medium interval (Pro) →
- Mortgage (P&I)
- −$587
- Tax est. 1.5%
- −$140 /mo · $1,680/yr
- Insurance
- −$47
- HOA
- −$0
- Vacancy / Maint / Mgmt
- −$373
- Net cashflow
- $630
Break-even live
UW: 25.0% down · 7.5% · 30yr · 1.5% tax · 5.0% vac · 8.0% maint · 8.0% mgmt
Financing live
Cash to close
- Down payment
- $28,000
- Closing costs
- $3,360
- Reserves months
- —
- Total cash needed
- —
Loan-product check · same deal, 3 products live
Conventional
25% down · 7.5% · 30yr
- Down + closing
- —
- Monthly P&I
- —
- Monthly cashflow
- —
- DSCR
- —
- Eligible?
- —
Personal DTI + credit; lowest rate.
DSCR
20% down · 8.5% · 30yr
- Down + closing
- —
- Monthly P&I
- —
- Monthly cashflow
- —
- DSCR
- —
- Eligible?
- —
No personal income docs; deal must DSCR.
Hard money
10% down · 12.0% · 12mo
- Down + closing
- —
- Monthly P&I
- —
- Monthly cashflow
- —
- DSCR
- —
- Eligible?
- —
Short-term bridge; refi at stabilization.
Listing history 17 events
-
2026-06-18days on market $112,000 Active 27 DOM
-
2026-06-17days on market $112,000 Active 26 DOM
-
2026-06-16days on market $112,000 Active 25 DOM
-
2026-06-15days on market $112,000 Active 24 DOM
-
2026-06-14days on market $112,000 Active 22 DOM
-
2026-06-13days on market $112,000 Active 21 DOM
-
2026-06-10days on market $112,000 Active 19 DOM
-
2026-06-09days on market $112,000 Active 18 DOM
-
2026-06-08days on market $112,000 Active 17 DOM
-
2026-06-07days on market $112,000 Active 16 DOM
-
2026-06-05days on market $112,000 Active 13 DOM
-
2026-06-03days on market $112,000 Active 12 DOM
-
2026-06-02days on market $112,000 Active 11 DOM
-
2026-06-01days on market $112,000 Active 10 DOM
-
2026-05-31days on market $112,000 Active 9 DOM
-
2026-05-30days on market $112,000 Active 8 DOM
-
2026-05-13$112,000 Active
ⓘ Source: listings_history table (triggers on properties + properties_extension) + one-shot
backfill from property_details.listing_events for pre-trigger history.
Nearby sold comps map
Loading sold comps map…
Walkable amenities ~0.75 mi
Loading nearby amenities…
Taxation est. · year 1
- Rental income
- $21,323
- − Mortgage interest
- −$6,274
- − Property taxes
- −$1,680
- − Insurance
- −$560
- − Repairs & maintenance
- −$1,706
- − Management
- −$1,706
- − Depreciation
- −$3,258
- Taxable income
- $6,139
- Est. tax owed @ 24.0%
- −$1,473
- After-tax cash flow
- $6,083/yr
For passive investors: Depreciation is non-cash, so a rental often shows a tax loss while cash-flowing — sheltering income. Rental losses are passive: they offset passive income freely, and up to $25,000/yr can offset ordinary (W-2) income if you actively participate and your MAGI is under $100k (phasing out to $0 by $150k); unused losses carry forward. On sale, claimed depreciation is recaptured at up to 25%, and gains may owe capital-gains tax (a 1031 exchange can defer both). Figures are a year-1 estimate at your 24.0% rate — not tax advice; consult a CPA.
Condition & rehab AI · 14 photos
This manufactured home is in good condition with no visible damage or wear. It is move-in ready and has good curb appeal. Painting the exterior and landscaping the front yard can further enhance its value.
Value-add opportunities
- Resale Painting the exterior siding and roof — Painting the exterior can enhance the home's curb appeal and make it more attractive to potential buyers.
- Rental Landscaping the front yard — Landscaping can improve the home's curb appeal and make it more attractive to potential renters.
Renovation cost estimate screening
Value-add ROI direction
- Resale Painting the exterior siding and roof — Painting the exterior can enhance the home's curb appeal and make it more attractive to potential buyers. ↑
- Rental Landscaping the front yard — Landscaping can improve the home's curb appeal and make it more attractive to potential renters. ↑
ⓘ Cost ranges are severity-bucket heuristics (US national rule-of-thumb). Get contractor quotes + a written scope before underwriting a rehab budget.
Schools (NCES district)
- District
- Parker Unified School District (4510)
- NCES district ID
- 0405980
- Math proficiency
- 18% ▼ -10.00%
- Reading proficiency
- 18% ▼ -7.00%
- Median HH income
- $34,354
- Composite
- 14.76/100
- National rank
- #9392
- State rank
- #200 of 249 in AZ
Livability — Bluewater
- Score
- 65/100
- State rank
- #81
- US rank
- #12872
Category grades
Schools grade is shown separately in the Schools card above.
Census & demographics
- Census place
- Bluewater, AZ
- Population (ZIP)
- 9,069
Population outlook (La Paz County) Hauer SSP2
- Today (2025)
- 18,409 people
- By 2030
- 17,592 · -4.4%
- By 2040
- 16,600 · -9.8%
- By 2050
- 16,328 · -11.3%
- By 2075
- 17,075 · -7.2%
- By 2100
- 17,042 · -7.4%
Race, ethnicity, and origin ACS 2023
- Neighborhood character
- Highly diverse neighborhood (Simpson 0.72)
- Race & ethnicity
- White 40% Hispanic / Latino 34% Native American 23% Two or more races 19% Asian 2%
- Hispanic origin (detail)
- Mexican 32%
- Common ancestry
- Slovak 1% Lithuanian 1% Portuguese 1%
- Foreign-born
- 10% · Canada
- Languages at home
- 74% English-only · Spanish 21% Other Indo-European 1% Tagalog/Filipino 1%
Political lean MEDSL · La Paz
- 2024 margin
- Solid R (+44.2) · D 27.6% · R 71.8%
- 2008→2024 swing
- -15.7pp toward R · 2008: -28.5pp · 2024: -44.2pp
- All cycles
- 2024: R+44.2 2020: R+38.8 2016: R+41.8 2012: R+32.2 2008: R+28.5
Not yet ingested
- Civics
- —
Market trends
- HPI YoY
- ▼ -155.38%
- Current HPI
- 198.2271
- Rent YoY
- —
- Metro
- —
- State GDP YoY
- ▲ 4.54%
- F500 in state
- 20
Industry mix (Fortune 500 HQ in AZ)
| Industry | F500 HQs | Revenue |
|---|---|---|
| Technology | 2 | $13B |
|
||
| Mining / Metals | 1 | $23B |
|
||
| Environmental Services | 1 | $16B |
|
||
| Metals / Steel | 1 | $14B |
|
||
| Technology Distribution | 1 | $9B |
|
||
| Homebuilding | 1 | $8B |
|
||
Price history
1 event — show timeline
- 2026-05-13 Listed $112,000 LHAR
Cash-flow waterfall
monthlySold comps — $/sqft
last 12 mo · ≤1 miLoading sold comps…