 🏷️ Likely Rental
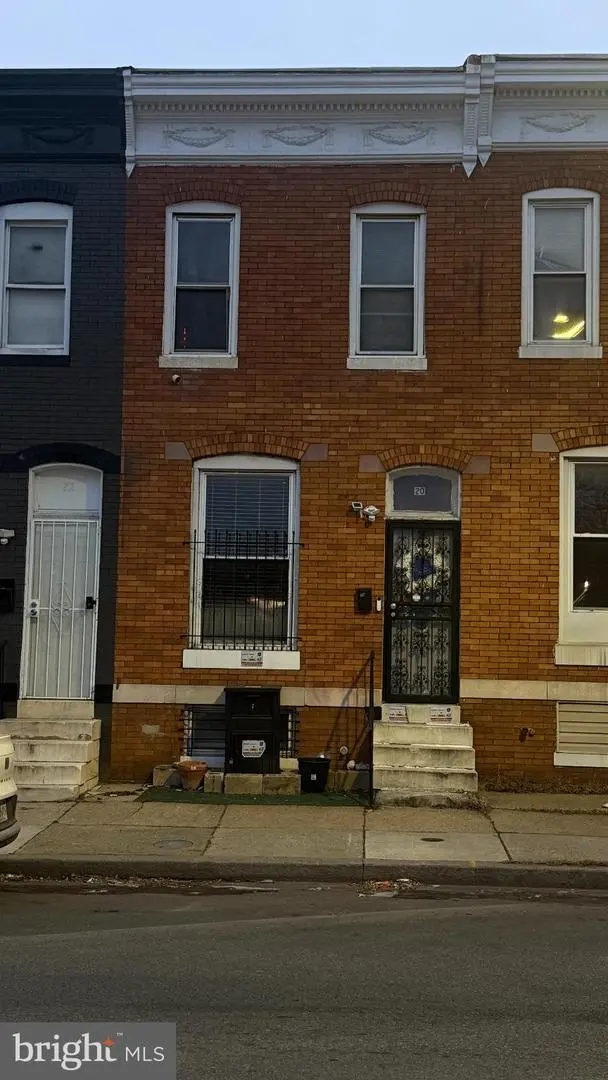
20 S Catherine St · Baltimore, MD
Flood risk 4/10 · Minor
- FEMA flood zone
- X (unshaded)
- Chance of flooding over 30 yrs
- 0.23%
- Est. flood insurance / yr
- $473 – $860
Fire risk 1/10 · Minimal
- Est. fire insurance / yr
- $755 – $1,403
Heat risk 7/10 · Major
- Hot days now (above 103°F)
- 7 days/yr
- Hot days in 30 yrs
- 15 days/yr
Wind risk 6/10 · Moderate
- Chance of severe wind over 30 yrs
- 27.0%
Air-quality risk 3/10 · Minor
- Unhealthy air days now
- 3 days/yr
- Unhealthy air days in 30 yrs
- 4 days/yr
Risk factors via First Street. Map © Google.
Why this score? — see what drove the C- grade
The composite is a weighted blend of 9 inputs, each scored 0–100. Each bar is that input's sub-score; the figure is the points it added to the 100-point composite (weight × sub-score).
- Cash flow +15.0/30.0
- ARV discount +15.0/15.0
- 1% rule +5.0/10.0
- DSCR +5.0/10.0
- Rent growth +4.4/5.0
- Livability +3.8/5.0
- Condition / age +2.5/5.0
- Schools +1.0/10.0
- Appreciation +0.0/10.0
$30,000
🖨 Deal sheet 📄 Offer letter ✓ Due diligence
Listing remarks MLS
This charming traditional townhouse nestled in the desirable and growing Shipley Hill neighborhood. With a solid brick exterior, this property offers a long term tenant for a savvy investors looking to maximize returns, or a first time home buyer looking to secure future equity in a revitalizing vibrant community. This townhouse is poised for growth, making it an ideal investment for those looking to capitalize on the local real estate market or the first time home buyer. Don't miss your chance to start your 2026 real estate purchase with this property.
Key facts
- Frederick avenue
- Grace medical center
- Built 1900
Tags
Neighborhood map
What this means for you Summary
Snapshot
- This is a townhouse listed at $30k.
Deal economics
- At list price, monthly cash flow is $907 ($11k/yr) — positive.
- The deal already cash-flows at list — no discount required.
- Meets the 1% rule at list price ($1k rent vs $30k).
- Cap rate 42.6% vs local median 6.0% in Baltimore — top-decile yield for the area; either an underpriced asset or a hidden risk that comps aren't pricing in. Stress-test before assuming the spread holds.
Location & tenants
- Location reads 76/100 on livability (#90 in MD, #3,396 nationally) — a middle-class / working-renter tenant base. Strengths: amenities A+, commute A+, housing A+; Watch: schools D, crime F.
- Baltimore City Public Schools (urban): math 7% / reading 16% proficiency, ranked #24 of 24 in MD (top 100%) — low school quality limits family demand, transient renter base, plan for 1-2y turnover; 79% free/reduced lunch — lower-income household profile, screen leases tightly.
- Market conditions: Rents rising fast (+7.5%/yr); 422 active listings in the ZIP; 40 comparable units currently listed for rent nearby; rentals at typical pace (median 24d on market — plan ~3-4 weeks tenant-placement turnaround); 42% of comp listings sitting > 30 days — soft ceiling on asking rent; 1,273 units permitted in Baltimore city in 2024 (1,104 in 5+ unit buildings).
- This rent runs 37% of the median local income ($46k/yr) — at the standard rent-burdened threshold; future hikes will face affordability resistance.
Forward outlook
- Local home prices are declining (-3.0%/yr); year-one equity from $207 of loan paydown is wiped out by about $900 of value loss. Plan a longer hold.
- Baltimore County population projected to shrink 4% by 2050 — rents likely to lag national; underwrite the cash flow, not the appreciation.
- At projected returns (-3.0% appreciation + 7.5% rent growth), your $8k cash investment doubles in ~1 year — after that, you're playing with house money.
Negotiation context
- Only 1 days on market — expect competitive offers; lowballing is unlikely to land.
- 3 sale attempts since 6y ago; this cycle's ask has dropped $77k (72%) from the opening price — seller is motivated, your offer sets the floor, not the list.
Risks & watch-outs
- Watch-outs: built in 1900 — expect roof / HVAC / electrical / plumbing capex.
- Climate carrying-cost: major wind risk, 27% chance of damaging wind over 30y; extreme-heat days projected 7→15/yr by 2055 (HVAC capex compounding) — expect insurance premiums to compound above CPI over the hold.
Questions for the listing agent
- Built in 1900 — when were the roof, HVAC, electrical panel, plumbing, and water heater last replaced?
- Is there a deadline driving the sale (1031 exchange, divorce, estate, relocation)? That informs how much negotiation room exists.
- Schools are D-rated, which usually means shorter tenancies and higher turnover. Who's the typical renter profile here, and what's been the actual vacancy rate?
- Crime grade is F in this area — have there been break-ins, vandalism, or insurance claims at this property in the last 3 years? What carrier currently insures it and at what premium?
- What's the average days-on-market for RENTAL listings here right now (not sales)? A rising rental-DOM trend means longer vacancies and softer asking-rent achievability than the comps imply.
- What's the recent tenant-quality profile in this submarket — average credit score on applications, eviction rate, late-payment / NSF rate, and stable-employment percentage? A property-management company in the area should have these aggregated.
- How much new for-sale + rental construction is in the pipeline within 1–3 miles? Heavy new supply typically softens prices + rents 12–24 months out; constrained supply supports both.
Investment metrics
- 1% rule
- 4.70% ✓
- Cap rate
- 42.57%
- Cash-on-cash
- 129.57%
- DSCR
- 6.77
- GRM
- 1.8
CMA / ARV
- ARV (median comp)
- $54,670
- List price
- $30,000
- Delta
- 95.72%
- Verdict
- OVERPRICED
- Comps
- 20 within 1.0 mi
Show comp detail 12 sales within ~0.75 mi
| Address | Dist | Beds/Ba | Sqft | Sold | Price | $/sf | Match |
|---|---|---|---|---|---|---|---|
| 2518 Mchenry St | 0.20mi | 3/1.0 | — | 0mo | $40,000 | — | 78 |
| 2521 Mchenry St | 0.23mi | —/— | — | 0mo | $17,000 | — | 77 |
| 2209 W Baltimore St | 0.25mi | 3/1.0 | — | 0mo | $25,000 | — | 76 |
| 2610 E Lehman St | 0.40mi | 2/1.0 | — | 0mo | $57,000 | — | 68 |
| 2004 Mchenry St | 0.43mi | 3/1.0 | — | 0mo | $25,000 | — | 67 |
| 528 S Bentalou St | 0.47mi | 4/3.0 | 1,032 | 0mo | $190,000 | $184 | 65 |
| 2402 Wilkens Ave | 0.51mi | 2/1.0 | 1,092 | 0mo | $45,000 | $41 | 63 |
| 2133 Wilkens Ave | 0.55mi | —/— | — | 0mo | $25,000 | — | 62 |
| 1824 W Fairmount Ave | 0.56mi | —/— | — | 0mo | $16,995 | — | 61 |
| 2401 Harlem Ave | 0.63mi | 6/3.5 | 3,200 | 0mo | $360,000 | $113 | 58 |
| 537 Longwood St | 0.68mi | 4/2.0 | 1,176 | 0mo | $60,000 | $51 | 55 |
| 8 Gilmor St | 0.75mi | 3/1.5 | — | 0mo | $40,000 | — | 53 |
Match score weights: distance 35% · size 25% · config 20% · recency 20%. Top-matched comps best support the ARV.
Projected returns pro-forma
-3.0% appreciation · 7.51% rent growth · sell at horizon
- IRR
- —
- Equity multiple
- 8.10×
- Total profit
- $59,617
- Equity at exit
- $4,473
- IRR
- —
- Equity multiple
- 19.63×
- Total profit
- $156,525
- Equity at exit
- $2,594
Cash invested: $8,400 (down + closing). Projections, not guarantees.
Landlord ↔ Tenant lean methodology
- Overall (CITY)
- 12 Strongly Tenant-Friendly
- State Maryland
- 27 Tenant-Leaning · D+14
- County
- — inherits STATE
- City Baltimore
- 12 Strongly Tenant-Friendly · D+58
ZIP-level market 21223
- Rents YoY
- 7.5%
- Active inventory
- 422
- Price-to-rent
- 1.8×
Monthly cashflow live
- Estimated rent
- $1,411 high interval (Pro) →
- Mortgage (P&I)
- −$157
- Tax est. 1.5%
- −$38 /mo · $450/yr
- Insurance
- −$12
- HOA
- −$0
- Vacancy / Maint / Mgmt
- −$296
- Net cashflow
- $907
Break-even live
UW: 25.0% down · 7.5% · 30yr · 1.5% tax · 5.0% vac · 8.0% maint · 8.0% mgmt
Financing live
Cash to close
- Down payment
- $7,500
- Closing costs
- $900
- Reserves months
- —
- Total cash needed
- —
Loan-product check · same deal, 3 products live
Conventional
25% down · 7.5% · 30yr
- Down + closing
- —
- Monthly P&I
- —
- Monthly cashflow
- —
- DSCR
- —
- Eligible?
- —
Personal DTI + credit; lowest rate.
DSCR
20% down · 8.5% · 30yr
- Down + closing
- —
- Monthly P&I
- —
- Monthly cashflow
- —
- DSCR
- —
- Eligible?
- —
No personal income docs; deal must DSCR.
Hard money
10% down · 12.0% · 12mo
- Down + closing
- —
- Monthly P&I
- —
- Monthly cashflow
- —
- DSCR
- —
- Eligible?
- —
Short-term bridge; refi at stabilization.
Rent comps 40 comps
| Address | Beds | Baths | Sqft | Rent | $/sqft | DOM | Units | Dist |
|---|---|---|---|---|---|---|---|---|
| 2516 Hollins St Baltimore, MD | 3.0 | 2.0 | 1100 | $1,700 | $1.55 | 44d | 1 | 0.05mi |
| 2537 Hollins St Baltimore, MD | 3.0 | 2.0 | — | $1,450 | — | 11d | 1 | 0.09mi |
| 2537 Hollins St Baltimore, MD | 3.0 | 2.0 | 1200 | $1,450 | $1.21 | 24d | 1 | 0.09mi |
| 2410 W Baltimore St Baltimore, MD | 3.0 | 1.0 | — | $1,400 | — | 3d | 1 | 0.09mi |
| 2403 W Lombard St Baltimore, MD | 3.0 | 1.0 | — | $1,250 | — | 44d | 1 | 0.10mi |
| 2400 W Baltimore St Baltimore, MD | 3.0 | 1.0 | — | $1,450 | — | 44d | 1 | 0.10mi |
| 2518 W Fairmount Ave Baltimore, MD | 3.0 | 1.0 | — | $1,025 | — | 4d | 1 | 0.12mi |
| 110 S Catherine St Unit 1 Baltimore, MD | 2.0 | 1.0 | 1330 | $1,500 | $1.13 | 44d | 1 | 0.12mi |
| 2550 W Lombard St Baltimore, MD | 2.0 | 1.0 | — | $995 | — | 44d | 1 | 0.13mi |
| 2550 W Lombard St Apt 1R Baltimore, MD | 1.0 | 1.0 | — | $995 | — | 44d | 1 | 0.13mi |
| 37 Wheeler Ave Baltimore, MD | 3.0 | 2.0 | — | $2,000 | — | 24d | 1 | 0.16mi |
| 6 S Franklintown Rd Unit 2E Private Bath Available $850 Baltimore, MD | 1.0 | 1.0 | — | $850 | — | 22d | 1 | 0.16mi |
| 6 S Franklintown Rd Baltimore, MD | 1.0 | 1.0 | — | $750 | — | 24d | 1 | 0.16mi |
| 50 N Gorman Ave Baltimore, MD | 1.0 | 1.0 | 100 | $650 | $6.50 | 44d | 1 | 0.17mi |
| 2554 W Fayette St Baltimore, MD | 3.0 | 1.0 | — | $1,450 | — | 24d | 1 | 0.18mi |
| 62 N Gorman Ave Baltimore, MD | 3.0 | 2.0 | 1100 | $2,500 | $2.27 | 18d | 1 | 0.18mi |
| 2232 W Baltimore St Baltimore, MD | 3.0 | 1.0 | 1250 | $1,875 | $1.50 | 24d | 1 | 0.21mi |
| 2225 W Baltimore St Baltimore, MD | 3.0 | 2.5 | 1200 | $1,600 | $1.33 | 24d | 1 | 0.21mi |
| 39 N Bentalou St Baltimore, MD | 3.0 | 2.5 | 1844 | $1,700 | $0.92 | 3d | 1 | 0.22mi |
| 2243 W Fayette St Baltimore, MD | 2.0 | 2.0 | — | $1,400 | — | 15d | 1 | 0.23mi |
| 2311 W Lexington St Unit 1 Baltimore, MD | 1.0 | 1.0 | — | $950 | — | 2d | 1 | 0.26mi |
| 2311 W Lexington St Baltimore, MD | 1.0 | 1.0 | 230 | $900 | $3.91 | 44d | 1 | 0.26mi |
| 2212 W Fayette St Baltimore, MD | 3.0 | 1.0 | — | $1,700 | — | 22d | 1 | 0.28mi |
| 2540 Frederick Ave Baltimore, MD | 3.0 | 1.0 | 1075 | $1,400 | $1.30 | 24d | 1 | 0.28mi |
| 332 S Franklintown Rd Unit 2 Baltimore, MD | 2.0 | 1.0 | 776 | $795 | $1.02 | 24d | 1 | 0.29mi |
| 2227 W Lexington St Baltimore, MD | 3.0 | 1.0 | — | $1,500 | — | 3d | 1 | 0.29mi |
| 307 S Smallwood St Baltimore, MD | 2.0 | 2.5 | 1400 | $1,350 | $0.96 | 44d | 1 | 0.34mi |
| 2237 W Saratoga St Baltimore, MD | 3.0 | 1.5 | — | $1,650 | — | 44d | 1 | 0.36mi |
| 2101 McHenry St Baltimore, MD | 1.0 | 1.0 | — | $550 | — | 18d | 1 | 0.39mi |
| 2003 Hollins St Unit 2 Baltimore, MD | 1.0 | 1.0 | — | $795 | — | 44d | 1 | 0.39mi |
| 200 Harmison St Baltimore, MD | 3.0 | 1.0 | — | $1,300 | — | 44d | 1 | 0.39mi |
| 2621 Sloatfield Ave Baltimore, MD | 3.0 | 1.0 | — | $1,599 | — | 44d | 1 | 0.40mi |
| 476 S Bentalou St Baltimore, MD | 2.0 | 1.5 | 1630 | $1,300 | $0.80 | 44d | 1 | 0.41mi |
| 2011 W Lexington St Baltimore, MD | 3.0 | 1.0 | — | $1,600 | — | 15d | 1 | 0.42mi |
| 2651 Frederick Ave Baltimore, MD | 3.0 | 1.5 | — | $1,350 | — | 3d | 1 | 0.42mi |
| 2133 W Mulberry St Baltimore, MD | 2.0 | 1.5 | — | $1,700 | — | 44d | 1 | 0.46mi |
| 2133 W Mulberry St Baltimore, MD | 3.0 | 1.5 | — | $1,650 | — | 16d | 1 | 0.46mi |
| 1918 W Baltimore St Baltimore, MD | 2.0–3.0 | 1.0–2.0 | 857 | $1,375 | $1.60 | 44d | 1 | 0.46mi |
| 1912 W Baltimore St Unit 2 Baltimore, MD | 2.0 | 1.5 | 1200 | $2,100 | $1.75 | 24d | 1 | 0.47mi |
| 338 S Payson St Baltimore, MD | 2.0 | 1.0 | — | $1,600 | — | 44d | 1 | 0.47mi |
Listing history 21 events
-
2026-06-17remarks 699-char remark
-
2026-06-17pricedays on market $30,000 Active 1 DOM
-
2026-06-16days on market $107,000 Active 142 DOM
-
2026-06-15days on market $107,000 Active 141 DOM
-
2026-06-13days on market $107,000 Active 139 DOM
-
2026-06-09days on market $107,000 Active 135 DOM
-
2026-06-08days on market $107,000 Active 134 DOM
-
2026-06-07days on market $107,000 Active 133 DOM
-
2026-06-04days on market $107,000 Active 130 DOM
-
2026-06-03days on market $107,000 Active 129 DOM
-
2026-06-02days on market $107,000 Active 128 DOM
-
2026-06-01days on market $107,000 Active 127 DOM
-
2026-05-31days on market $107,000 Active 126 DOM
-
2026-01-25$107,000 Active 559-char remark
Show marketing remark (559 chars)
This charming traditional townhouse nestled in the desirable and growing Shipley Hill neighborhood. With a solid brick exterior, this property offers a long term tenant for a savvy investors looking to maximize returns, or a first time home buyer looking to secure future equity in a revitalizing vibrant community. This townhouse is poised for growth, making it an ideal investment for those looking to capitalize on the local real estate market or the first time home buyer. Don't miss your chance to start your 2026 real estate purchase with this property.
-
2024-08-16historical
-
2024-06-04$130,000 Active
-
2021-09-16soldstatus $95,000
-
2020-11-05soldstatus $50,000
-
2020-10-09soldstatus $50,000 Closed
-
2020-08-29status Pending
-
2020-08-18$55,000 Active
ⓘ Source: listings_history table (triggers on properties + properties_extension) + one-shot
backfill from property_details.listing_events for pre-trigger history.
Climate risk First Street
- Flood 4/10 Moderate FEMA zone X (unshaded) · 23% chance over 30 yrs
- Wildfire 1/10 Low
- Heat 7/10 Severe 7 d/yr ≥103°F today · 15 d/yr by 30 yrs out
- Wind 6/10 Major 27% chance of damaging wind over 30 yrs
- Air quality 3/10 Moderate 3 unhealthy d/yr today · 4 by 30 yrs out
Nearby sold comps map
Loading sold comps map…
Walkable amenities ~0.75 mi
Loading nearby amenities…
Taxation est. · year 1
- Rental income
- $16,926
- − Mortgage interest
- −$1,680
- − Property taxes
- −$450
- − Insurance
- −$150
- − Repairs & maintenance
- −$1,354
- − Management
- −$1,354
- − Depreciation
- −$873
- Taxable income
- $11,065
- Est. tax owed @ 24.0%
- −$2,656
- After-tax cash flow
- $8,228/yr
For passive investors: Depreciation is non-cash, so a rental often shows a tax loss while cash-flowing — sheltering income. Rental losses are passive: they offset passive income freely, and up to $25,000/yr can offset ordinary (W-2) income if you actively participate and your MAGI is under $100k (phasing out to $0 by $150k); unused losses carry forward. On sale, claimed depreciation is recaptured at up to 25%, and gains may owe capital-gains tax (a 1031 exchange can defer both). Figures are a year-1 estimate at your 24.0% rate — not tax advice; consult a CPA.
Schools (NCES district)
- District
- Baltimore City Public Schools
- NCES district ID
- 2400090
- Math proficiency
- 7% ▼ -9.00%
- Reading proficiency
- 16% ▼ -5.00%
- Median HH income
- $42,108
- Composite
- 10.08/100
- National rank
- #9805
- State rank
- #24 of 24 in MD
Livability — Baltimore
- Score
- 76/100
- State rank
- #90
- US rank
- #3396
Category grades
Schools grade is shown separately in the Schools card above.
Census & demographics
- Census place
- Baltimore, MD
- County
- Baltimore City · 558,601 people
- City population
- 588,727
- Metro
- Baltimore-Columbia-Towson, MD
- Population (ZIP)
- 19,572
- Household income
- $45,840
- Rent vs Own
- Severe rent burden
- 1755.0
Population outlook (Baltimore County) Hauer SSP2
- Today (2025)
- 624,249 people
- By 2030
- 621,541 · -0.4%
- By 2040
- 609,756 · -2.3%
- By 2050
- 597,249 · -4.3%
- By 2075
- 552,236 · -11.5%
- By 2100
- 513,934 · -17.7%
Race, ethnicity, and origin ACS 2023
- Neighborhood character
- Predominantly Black (72%)
- Race & ethnicity
- Black 72% White 16% Hispanic / Latino 7% Two or more races 6% Asian 1%
- Hispanic origin (detail)
- Mexican 3% Puerto Rican 1%
- Common ancestry
- Romanian 1%
- Foreign-born
- 8% · Canada
- Languages at home
- 90% English-only · Spanish 6% French/Haitian/Cajun 2% Other Indo-European 1%
Political lean MEDSL · Baltimore
- 2024 margin
- Solid D (+73.0) · D 85.2% · R 12.2% · Other 2.6%
- 2008→2024 swing
- -2.5pp toward R · 2008: 75.5pp · 2024: 73.0pp
- All cycles
- 2024: D+73.0 2020: D+76.6 2016: D+74.6 2012: D+76.4 2008: D+75.5
Not yet ingested
- Civics
- —
Market trends
- HPI YoY
- ▼ -97.99%
- Current HPI
- 140.5836
- Rent YoY
- ▲ 7.51%
- Metro
- Baltimore-Columbia-Towson, MD
- State GDP YoY
- ▲ 2.97%
- F500 in state
- 12
Industry mix (Fortune 500 HQ in MD)
| Industry | F500 HQs | Revenue |
|---|---|---|
| Aerospace / Defense | 1 | $71B |
|
||
| Utilities | 1 | $25B |
|
||
| Hotels | 1 | $24B |
|
||
| Consumer Goods | 1 | $7B |
|
||
| Real Estate | 1 | $6B |
|
||
| Chemicals | 1 | $2B |
|
||
Price history
+94.5% since first listed8 events — show timeline
- 2026-01-25 Listed $107,000 BRIGHT MLS
- 2024-08-16 Listing Removed — BRIGHT MLS
- 2024-06-04 Listed $130,000 BRIGHT MLS
- 2021-09-16 Sold (Public Records) $95,000 Public Records
- 2020-11-05 Sold (Public Records) $50,000 Public Records
- 2020-10-09 Sold (MLS) $50,000 BRIGHT MLS
- 2020-08-29 Pending — BRIGHT MLS
- 2020-08-18 Listed $55,000 BRIGHT MLS
Property tax history
+9.9%/yrLatest (2025): $1,531 · +8.3% YoY. Source: county tax records.
Cash-flow waterfall
monthlySold comps — $/sqft
last 12 mo · ≤1 miLoading sold comps…