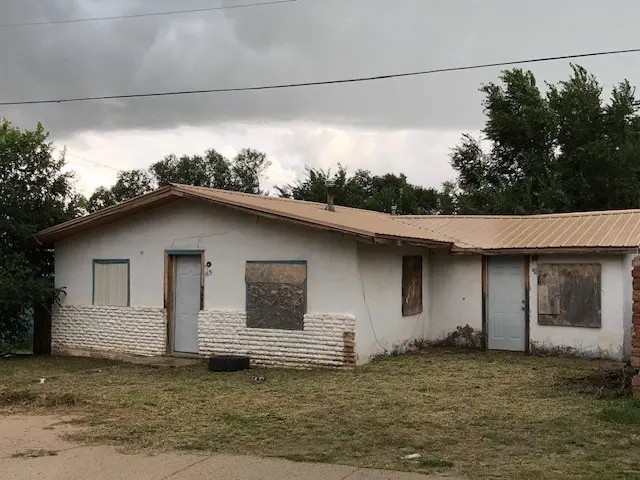
415 Rincon St · Las Vegas, NM
Flood risk 1/10 · Minimal
- FEMA flood zone
- X (unshaded)
- Chance of flooding over 30 yrs
- 0.0%
- Est. flood insurance / yr
- $507 – $1,088
Fire risk 7/10 · Major
- Est. fire insurance / yr
- $706 – $1,312
Heat risk 2/10 · Minimal
- Hot days now (above 89°F)
- 7 days/yr
- Hot days in 30 yrs
- 17 days/yr
Wind risk 1/10 · Minimal
- Chance of severe wind over 30 yrs
- —
Air-quality risk 1/10 · Minimal
- Unhealthy air days now
- 0 days/yr
- Unhealthy air days in 30 yrs
- 0 days/yr
Risk factors via First Street. Map © Google.
Why this score? — see what drove the B- grade
The composite is a weighted blend of 9 inputs, each scored 0–100. Each bar is that input's sub-score; the figure is the points it added to the 100-point composite (weight × sub-score).
- Cash flow +30.0/30.0
- 1% rule +10.0/10.0
- DSCR +10.0/10.0
- ARV discount +7.5/15.0
- Livability +3.5/5.0
- Rent growth +2.5/5.0
- Condition / age +2.5/5.0
- Schools +1.7/10.0
- Appreciation +0.0/10.0
$75,000
🖨 Deal sheet 📄 Offer letter ✓ Due diligence
Listing remarks MLS
Small adobe and frame/stucco house, with 2b1b, living room, large kitchen, and small dining area. Small fenced yard, driveway in front will hold one large vehicle or two small ones. Needs some TLC.
Key facts
- 0.55 acre lot
- Parking
- Built 1965
Neighborhood map
What this means for you Summary
Snapshot
- This is a 2-bed/1.0-bath other listed at $75k.
Deal economics
- At list price, monthly cash flow is $568 ($7k/yr) — positive.
- The deal already cash-flows at list — no discount required.
- Meets the 1% rule at list price ($1k rent vs $75k).
- Recommended offer: $66k (12.0% below list) — sets the bar for market timing.
Location & tenants
- Location reads 70/100 on livability (#22 in NM) — a middle-class / working-renter tenant base. Strengths: cost of living A+, health & safety A+, amenities A; Watch: schools D-, crime F, commute F.
- West Las Vegas Public Schools (town): math 10% / reading 25% proficiency, ranked #76 of 95 in NM (top 80%) — low school quality limits family demand, transient renter base, plan for 1-2y turnover; 92% free/reduced lunch — lower-income household profile, screen leases tightly.
- Market conditions: 89 active listings in the ZIP; 1 comparable units currently listed for rent nearby.
Forward outlook
- Local home prices are declining (-3.0%/yr); year-one equity from $519 of loan paydown is wiped out by about $2k of value loss. Plan a longer hold.
- San Miguel County population projected at -26% by 2050 — secular population decline; favor cash flow + early exit over multi-decade hold.
- At projected returns (-3.0% appreciation + 3.0% rent growth), your $21k cash investment doubles in ~4 years — after that, you're playing with house money.
Negotiation context
- It's been on market 277 days — a 12% lower offer ($66k) is reasonable based on typical stale-listing flexibility.
Risks & watch-outs
- Climate carrying-cost: major wildfire risk — expect insurance premiums to compound above CPI over the hold.
Questions for the listing agent
- It's been on market 277 days. Have you received any prior offers? Is the seller open to a 12% concession, seller financing, or rate buy-down credit?
- Built in 1965 — when were the roof, HVAC, electrical panel, plumbing, and water heater last replaced?
- Why hasn't it sold? Are there any deal-killer items the seller is aware of (foundation, flood, title, zoning, code violations)?
- Is there a deadline driving the sale (1031 exchange, divorce, estate, relocation)? That informs how much negotiation room exists.
- Schools are D-rated, which usually means shorter tenancies and higher turnover. Who's the typical renter profile here, and what's been the actual vacancy rate?
- Crime grade is F in this area — have there been break-ins, vandalism, or insurance claims at this property in the last 3 years? What carrier currently insures it and at what premium?
- What's the average days-on-market for RENTAL listings here right now (not sales)? A rising rental-DOM trend means longer vacancies and softer asking-rent achievability than the comps imply.
- What's the recent tenant-quality profile in this submarket — average credit score on applications, eviction rate, late-payment / NSF rate, and stable-employment percentage? A property-management company in the area should have these aggregated.
- How much new for-sale + rental construction is in the pipeline within 1–3 miles? Heavy new supply typically softens prices + rents 12–24 months out; constrained supply supports both.
Investment metrics
- 1% rule
- 1.73% ✓
- Cap rate
- 15.39%
- Cash-on-cash
- 32.47%
- DSCR
- 2.44
- GRM
- 4.8
CMA / ARV
- ARV (median comp)
- $175,348
- List price
- $75,000
- Delta
- -57.23%
- Verdict
- UNDERPRICED
- Comps
- 9 within 1.0 mi
Projected returns pro-forma
-3.0% appreciation · 3.0% rent growth · sell at horizon
- IRR
- 27.5%
- Equity multiple
- 2.14×
- Total profit
- $24,026
- Equity at exit
- $11,183
- IRR
- 35.0%
- Equity multiple
- 4.21×
- Total profit
- $67,460
- Equity at exit
- $6,485
Cash invested: $21,000 (down + closing). Projections, not guarantees.
Landlord ↔ Tenant lean methodology
- Overall (STATE)
- 55 Moderately Landlord-Leaning
- State New Mexico
- 55 Moderately Landlord-Leaning · D+3
- County
- — inherits STATE
- City
- — inherits STATE
ZIP-level market 87701
- Active inventory
- 89
- Price-to-rent
- 4.8×
Monthly cashflow live
- Estimated rent
- $1,300 medium interval (Pro) →
- Mortgage (P&I)
- −$393
- Tax from tax record
- −$34 /mo · $410/yr
- Insurance
- −$31
- HOA
- −$0
- Vacancy / Maint / Mgmt
- −$273
- Net cashflow
- $568
Break-even live
UW: 25.0% down · 7.5% · 30yr · 1.5% tax · 5.0% vac · 8.0% maint · 8.0% mgmt
Financing live
Cash to close
- Down payment
- $18,750
- Closing costs
- $2,250
- Reserves months
- —
- Total cash needed
- —
Loan-product check · same deal, 3 products live
Conventional
25% down · 7.5% · 30yr
- Down + closing
- —
- Monthly P&I
- —
- Monthly cashflow
- —
- DSCR
- —
- Eligible?
- —
Personal DTI + credit; lowest rate.
DSCR
20% down · 8.5% · 30yr
- Down + closing
- —
- Monthly P&I
- —
- Monthly cashflow
- —
- DSCR
- —
- Eligible?
- —
No personal income docs; deal must DSCR.
Hard money
10% down · 12.0% · 12mo
- Down + closing
- —
- Monthly P&I
- —
- Monthly cashflow
- —
- DSCR
- —
- Eligible?
- —
Short-term bridge; refi at stabilization.
Rent comps 1 comps
| Address | Beds | Baths | Sqft | Rent | $/sqft | DOM | Units | Dist |
|---|---|---|---|---|---|---|---|---|
| 221 Railroad Ave Las Vegas, NM | 1.0 | 1.0 | 800 | $1,300 | $1.62 | 21d | 1 | 0.81mi |
Listing history 20 events
-
2026-06-19days on market $75,000 Active 277 DOM
-
2026-06-18days on market $75,000 Active 276 DOM
-
2026-06-17days on market $75,000 Active 275 DOM
-
2026-06-16days on market $75,000 Active 274 DOM
-
2026-06-15remarks 205-char remark
-
2026-06-15days on market $75,000 Active 273 DOM
-
2026-06-14pricedays on market $75,000 Active 271 DOM
-
2026-06-13days on market $80,000 Active 270 DOM
-
2026-06-10days on market $80,000 Active 268 DOM
-
2026-06-09days on market $80,000 Active 267 DOM
-
2026-06-08days on market $80,000 Active 266 DOM
-
2026-06-07days on market $80,000 Active 265 DOM
-
2026-06-05days on market $80,000 Active 262 DOM
-
2026-06-02days on market $80,000 Active 260 DOM
-
2026-06-01days on market $80,000 Active 259 DOM
-
2026-05-31days on market $80,000 Active 258 DOM
-
2026-05-30days on market $80,000 Active 257 DOM
-
2026-04-07price $80,000 197-char remark
Show marketing remark (197 chars)
Small adobe and frame/stucco house, with 2b1b, living room, large kitchen, and small dining area. Small fenced yard, driveway in front will hold one large vehicle or two small ones. Needs some TLC.
-
2025-09-15$85,000 Active 197-char remark
Show marketing remark (197 chars)
Small adobe and frame/stucco house, with 2b1b, living room, large kitchen, and small dining area. Small fenced yard, driveway in front will hold one large vehicle or two small ones. Needs some TLC.
-
1989-06-15soldstatus
ⓘ Source: listings_history table (triggers on properties + properties_extension) + one-shot
backfill from property_details.listing_events for pre-trigger history.
Tax reassessment forecast NM · Resets to sale price
- Current annual tax
- $410 · $34/mo
- Projected year-2 tax
- $600 · $50/mo
- Expected delta
- +$190/yr (+$16/mo · 46.5%)
ⓘ Screening estimate from a state-policy table — verify with the county assessor before closing.
Climate risk First Street
- Flood 1/10 Low FEMA zone X (unshaded) · 0% chance over 30 yrs
- Wildfire 7/10 Severe
- Heat 2/10 Low 7 d/yr ≥89°F today · 17 d/yr by 30 yrs out
- Wind 1/10 Low
- Air quality 1/10 Low 0 unhealthy d/yr today · 0 by 30 yrs out
Nearby sold comps map
Loading sold comps map…
Walkable amenities ~0.75 mi
Loading nearby amenities…
Taxation est. · year 1
- Rental income
- $15,600
- − Mortgage interest
- −$4,201
- − Property taxes
- −$410
- − Insurance
- −$375
- − Repairs & maintenance
- −$1,248
- − Management
- −$1,248
- − Depreciation
- −$2,182
- Taxable income
- $5,936
- Est. tax owed @ 24.0%
- −$1,425
- After-tax cash flow
- $5,395/yr
For passive investors: Depreciation is non-cash, so a rental often shows a tax loss while cash-flowing — sheltering income. Rental losses are passive: they offset passive income freely, and up to $25,000/yr can offset ordinary (W-2) income if you actively participate and your MAGI is under $100k (phasing out to $0 by $150k); unused losses carry forward. On sale, claimed depreciation is recaptured at up to 25%, and gains may owe capital-gains tax (a 1031 exchange can defer both). Figures are a year-1 estimate at your 24.0% rate — not tax advice; consult a CPA.
Schools (NCES district)
- District
- West Las Vegas Public Schools
- NCES district ID
- 3501560
- Math proficiency
- 10% —
- Reading proficiency
- 25% —
- Median HH income
- $27,499
- Composite
- 17.01/100
- National rank
- #14192
- State rank
- #76 of 95 in NM
Livability — Las Vegas
- Score
- 70/100
- State rank
- #22
- US rank
- #8084
Category grades
Schools grade is shown separately in the Schools card above.
Census & demographics
- Census place
- Las Vegas, NM
- Population (ZIP)
- 17,864
Population outlook (San Miguel County) Hauer SSP2
- Today (2025)
- 25,750 people
- By 2030
- 24,399 · -5.2%
- By 2040
- 21,705 · -15.7%
- By 2050
- 19,188 · -25.5%
- By 2075
- 15,030 · -41.6%
- By 2100
- 12,418 · -51.8%
Race, ethnicity, and origin ACS 2023
- Neighborhood character
- Predominantly Hispanic (77%)
- Race & ethnicity
- Hispanic / Latino 77% Two or more races 28% White 16% Native American 3% Black 1%
- Hispanic origin (detail)
- Mexican 31%
- Common ancestry
- Lithuanian 1% Serbian 1% Romanian 1%
- Foreign-born
- 3% · Canada
- Languages at home
- 55% English-only · Spanish 42%
Political lean MEDSL · San Miguel
- 2024 margin
- Strong D (+27.9) · D 62.9% · R 35.0% · Other 2.1%
- 2008→2024 swing
- -32.7pp toward R · 2008: 60.6pp · 2024: 27.9pp
- All cycles
- 2024: D+27.9 2020: D+38.7 2016: D+46.4 2012: D+56.8 2008: D+60.6
Not yet ingested
- Civics
- —
Market trends
- HPI YoY
- ▼ -94.60%
- Current HPI
- 166.7301
- Rent YoY
- —
- Metro
- —
- State GDP YoY
- —
- F500 in state
- 0
Price history
-5.9% since first listed3 events — show timeline
- 2026-04-07 Price Changed $80,000 Santa Fe MLS
- 2025-09-15 Listed $85,000 Santa Fe MLS
- 1989-06-15 Sold (Public Records) — Public Records
Property tax history
+2.5%/yrLatest (2025): $410 · +2.7% YoY. Source: county tax records.
Cash-flow waterfall
monthlySold comps — $/sqft
last 12 mo · ≤1 miLoading sold comps…