 🏷️ Likely Rental
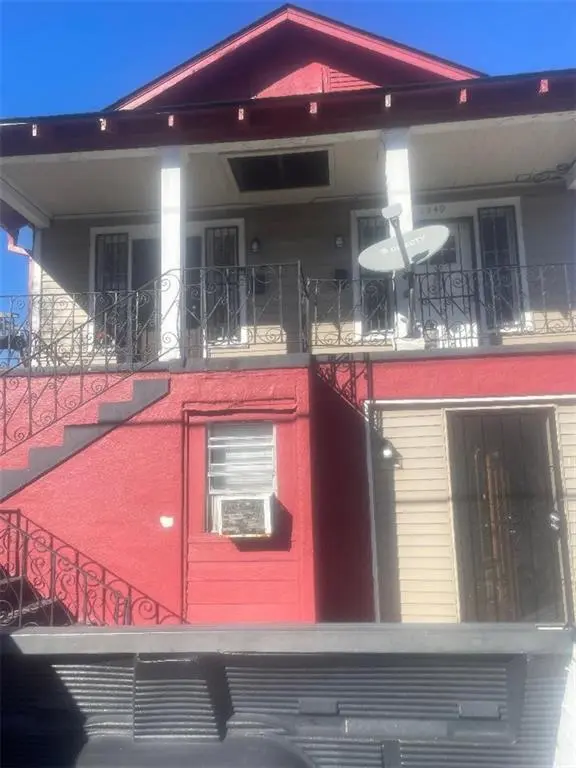
1747 49 N Miro St · New Orleans, LA
Flood risk 8/10 · Major
- FEMA flood zone
- X (shaded)
- Chance of flooding over 30 yrs
- 0.6%
- Est. flood insurance / yr
- $507 – $1,088
Fire risk 1/10 · Minimal
- Est. fire insurance / yr
- $1,269 – $2,357
Heat risk 10/10 · Severe
- Hot days now (above 108°F)
- 7 days/yr
- Hot days in 30 yrs
- 21 days/yr
Wind risk 10/10 · Severe
- Chance of severe wind over 30 yrs
- 99.0%
Air-quality risk 4/10 · Minor
- Unhealthy air days now
- 4 days/yr
- Unhealthy air days in 30 yrs
- 4 days/yr
Risk factors via First Street. Map © Google.
Why this score? — see what drove the B+ grade
The composite is a weighted blend of 9 inputs, each scored 0–100. Each bar is that input's sub-score; the figure is the points it added to the 100-point composite (weight × sub-score).
- Cash flow +30.0/30.0
- ARV discount +15.0/15.0
- 1% rule +10.0/10.0
- DSCR +10.0/10.0
- Livability +4.0/5.0
- Rent growth +2.5/5.0
- Condition / age +2.5/5.0
- Schools +1.6/10.0
- Appreciation +0.0/10.0
$265,000
🖨 Deal sheet (PDF) 📄 Offer letter ✓ Due diligence
Multi-family units
County records classify this as Multi-Family (2-4 Unit). Listing-text estimate: 3 units. confirmed
Listing remarks MLS
Income Producing Tri-plex in demand area,near to French Quarter,Fairgrounds,bus lines, shopping areas,restaurants, some rents are low for location, long term tenant.Tenants pay electric & gas all units. Owner pays water for 2 upstairs units.4 bedroom downstairs pays own water. Roof one year old. Tenant occupied units need 24 hrs to show
Key facts
- Recently vacant unit
- One year old roof
- Built 1953
Tags
Neighborhood map
What this means for you Summary
Snapshot
- This is a 3 × 2-bed/1-bath units multifamily listed at $265k.
Deal economics
- At list price, monthly cash flow is $2k ($21k/yr) — positive. Per door: $583/mo.
- The deal already cash-flows at list — no discount required.
- Meets the 1% rule at list price ($4k rent vs $265k).
- Recommended offer: $233k (12.0% below list) — sets the bar for market timing.
- Cap rate 14.5% vs local median 4.4% in New Orleans — top-decile yield for the area; either an underpriced asset or a hidden risk that comps aren't pricing in. Stress-test before assuming the spread holds.
Location & tenants
- Location reads 81/100 on livability (#3 in LA, #1,383 nationally) — a professional / high-income tenant draw. Strengths: amenities A+, commute A+, health & safety A+; Watch: crime C-, employment D.
- Orleans Parish (urban): math 11% / reading 27% proficiency, ranked #69 of 98 in LA (top 70%) — low school quality limits family demand, transient renter base, plan for 1-2y turnover; 68% free/reduced lunch — lower-income household profile, screen leases tightly.
- Zoned schools: Benjamin Franklin Elem. Math And Science (math 12% / reading 23%, grade F, #479 of 646 statewide, top 75%, 747 students, 98% FRL, charter) — zoned schools average 98% FRL vs 68% district-wide (30 pts higher); higher-poverty schools than district average — tighter screening recommended.
- Market conditions: Rents soft (-0.2%/yr); 381 active listings in the ZIP; 1 comparable units currently listed for rent nearby; 710 units permitted in Orleans Parish in 2024 (244 in 5+ unit buildings).
Forward outlook
- Local home prices are declining (-3.0%/yr); year-one equity from $2k of loan paydown is wiped out by about $8k of value loss. Plan a longer hold.
- Orleans County population projected at +61% by 2050 — long-run rental-demand tailwind backs the buy-and-hold thesis.
- At projected returns (-3.0% appreciation + 0.0% rent growth), your $74k cash investment doubles in ~5 years — after that, you're playing with house money.
Negotiation context
- It's been on market 161 days — a 12% lower offer ($233k) is reasonable based on typical stale-listing flexibility.
- 9 sale attempts since 23y ago; this cycle's ask has dropped $25k (9%) from the opening price — seller is motivated, your offer sets the floor, not the list.
- Current owner paid $138k; list at $265k implies a 91% gain — meaningful room to come down on a strong offer.
Risks & watch-outs
- Watch-outs: flood insurance adds $66/mo; built in 1953 — expect roof / HVAC / electrical / plumbing capex.
- Climate carrying-cost: severe flood risk; severe wind risk, 99% chance of damaging wind over 30y; extreme-heat days projected 7→21/yr by 2055 (HVAC capex compounding) — expect insurance premiums to compound above CPI over the hold.
Questions for the listing agent
- It's been on market 161 days. Have you received any prior offers? Is the seller open to a 12% concession, seller financing, or rate buy-down credit?
- Can we see the unit-by-unit rent roll, current vacancy, and any below-market leases? What's the average tenancy length?
- What capital expenditures (roof, boiler, parking lot, exteriors) have been made in the last 5 years, and what's planned in the next 2?
- Built in 1953 — when were the roof, HVAC, electrical panel, plumbing, and water heater last replaced?
- What's the actual annual flood-insurance premium (NFIP or private), and is the property in a SFHA with mandatory coverage?
- Why hasn't it sold? Are there any deal-killer items the seller is aware of (foundation, flood, title, zoning, code violations)?
- Is there a deadline driving the sale (1031 exchange, divorce, estate, relocation)? That informs how much negotiation room exists.
- What's the average days-on-market for RENTAL listings here right now (not sales)? A rising rental-DOM trend means longer vacancies and softer asking-rent achievability than the comps imply.
- What's the recent tenant-quality profile in this submarket — average credit score on applications, eviction rate, late-payment / NSF rate, and stable-employment percentage? A property-management company in the area should have these aggregated.
- How much new apartment / multifamily construction is in the pipeline within 1–3 miles? Heavy new supply (>2% of stock underway) typically softens rents 12–24 months out; light construction supports rent growth.
Investment metrics
- 1% rule
- 1.63% ✓
- Cap rate
- 14.51%
- Cash-on-cash
- 29.36%
- DSCR
- 2.31
- GRM
- 5.1
CMA / ARV
- ARV (median comp)
- $357,495
- List price
- $265,000
- Delta
- -25.87%
- Verdict
- UNDERPRICED
- Comps
- 20 within 1.0 mi
Show comp detail 1 sale within ~0.75 mi
| Address | Dist | Beds/Ba | Sqft | Sold | Price | $/sf | Match |
|---|---|---|---|---|---|---|---|
| 2622 Frenchmen St | 0.62mi | 6/2.0 (-1) | 1,750 (+12%) | 16mo | $122,150 | $70 | 28 |
Match score weights: distance 35% · size 25% · config 20% · recency 20%. Top-matched comps best support the ARV.
Projected returns pro-forma
-3.0% appreciation · 0.0% rent growth · sell at horizon
- IRR
- 19.2%
- Equity multiple
- 1.75×
- Total profit
- $55,737
- Equity at exit
- $39,512
- IRR
- 25.5%
- Equity multiple
- 2.93×
- Total profit
- $142,876
- Equity at exit
- $22,912
Cash invested: $74,200 (down + closing). Projections, not guarantees.
Landlord ↔ Tenant lean methodology
- Overall (STATE)
- 90 Strongly Landlord-Friendly
- State Louisiana
- 90 Strongly Landlord-Friendly · R+12
- County
- — inherits STATE
- City
- — inherits STATE
ZIP-level market 70119
- Home prices YoY
- -34.8%
- Rents YoY
- -0.2%
- Active inventory
- 381
- Price-to-rent
- 15.3×
Monthly cashflow live
- Estimated rent
- $4,319 high interval (Pro) →
- Mortgage (P&I)
- −$1,390
- Tax from tax record
- −$97 /mo · $1,161/yr
- Insurance
- −$110
- Flood insurance flood zone
- −$66 /mo · $798/yr
- HOA
- −$0
- Vacancy / Maint / Mgmt
- −$907
- Net cashflow
- $1,749
Break-even live
Sensitivity live
| Price | -10% $1,899 | -5% $1,824 | +0% $1,749 | +5% $1,674 | +10% $1,599 |
|---|---|---|---|---|---|
| Rent | -10% $1,407 | -5% $1,578 | +0% $1,749 | +5% $1,919 | +10% $2,090 |
| Rate | -1.0pp $1,882 | -0.5pp $1,816 | base $1,749 | +0.5pp $1,680 | +1.0pp $1,610 |
3-unit breakdown (identical units grouped — click to expand)
| Units | Beds | Baths | Est. rent |
|---|---|---|---|
| 3× units | 2 | 1 | $4,320 |
| #1 | 2 | 1 | $1,440 |
| #2 | 2 | 1 | $1,440 |
| #3 | 2 | 1 | $1,440 |
| Total (3 units) | $4,319 | ||
UW: 25.0% down · 7.5% · 30yr · 1.5% tax · 5.0% vac · 8.0% maint · 8.0% mgmt
Financing live
Cash to close
- Down payment
- $66,250
- Closing costs
- $7,950
- Reserves months
- —
- Total cash needed
- —
Loan-product check · same deal, 3 products live
Conventional
25% down · 7.5% · 30yr
- Down + closing
- —
- Monthly P&I
- —
- Monthly cashflow
- —
- DSCR
- —
- Eligible?
- —
Personal DTI + credit; lowest rate.
DSCR
20% down · 8.5% · 30yr
- Down + closing
- —
- Monthly P&I
- —
- Monthly cashflow
- —
- DSCR
- —
- Eligible?
- —
No personal income docs; deal must DSCR.
Hard money
10% down · 12.0% · 12mo
- Down + closing
- —
- Monthly P&I
- —
- Monthly cashflow
- —
- DSCR
- —
- Eligible?
- —
Short-term bridge; refi at stabilization.
Rent comps 1 comps
| Address | Beds | Baths | Sqft | Rent | $/sqft | DOM | Units | Dist |
|---|---|---|---|---|---|---|---|---|
| 2317 N Rampart St Unit 1272378P New Orleans, LA | 3.0–6.0 | 2.0–4.0 | 1581 | $8,133 | $5.14 | 5d | 2 | 1.11mi |
Listing history 32 events
-
2026-06-21days on market $265,000 Active 161 DOM
-
2026-06-18days on market $265,000 Active 158 DOM
-
2026-06-17days on market $265,000 Active 157 DOM
-
2026-06-16days on market $265,000 Active 156 DOM
-
2026-06-15days on market $265,000 Active 155 DOM
-
2026-06-13days on market $265,000 Active 153 DOM
-
2026-06-10days on market $265,000 Active 150 DOM
-
2026-06-09days on market $265,000 Active 149 DOM
-
2026-06-08days on market $265,000 Active 148 DOM
-
2026-06-07days on market $265,000 Active 147 DOM
-
2026-06-05days on market $265,000 Active 144 DOM
-
2026-06-03days on market $265,000 Active 143 DOM
-
2026-06-02days on market $265,000 Active 142 DOM
-
2026-06-01days on market $265,000 Active 141 DOM
-
2026-05-31days on market $265,000 Active 140 DOM
-
2026-05-17price $265,000 342-char remark
Show marketing remark (350 chars)
Income Producing Tri-plex in demand area, near to French Quarter, Fairgrounds, bus lines, shopping areas, restaurants, some rents are low for location, long term tenant. Tenants pay electric & gas all units. Owner pays water for 2 upstairs units. 4 bedroom downstairs pays own water. Roof one year old. Tenant occupied units need 24 hrs to show
-
2026-05-17price $265,000 350-char remark
Show marketing remark (350 chars)
Income Producing Tri-plex in demand area, near to French Quarter, Fairgrounds, bus lines, shopping areas, restaurants, some rents are low for location, long term tenant. Tenants pay electric & gas all units. Owner pays water for 2 upstairs units. 4 bedroom downstairs pays own water. Roof one year old. Tenant occupied units need 24 hrs to show
-
2026-02-02price $284,900 342-char remark
Show marketing remark (342 chars)
Income Producing Tri-plex in demand area,near to French Quarter,Fairgrounds,bus lines, shopping areas,restaurants, some rents are low for location, long term tenant.Tenants pay electric & gas all units. Owner pays water for 2 upstairs units.4 bedroom downstairs pays own water. Roof one year old. Tenant occupied units need 24 hrs to show
-
2026-01-30price $284,900 350-char remark
Show marketing remark (350 chars)
Income Producing Tri-plex in demand area, near to French Quarter, Fairgrounds, bus lines, shopping areas, restaurants, some rents are low for location, long term tenant. Tenants pay electric & gas all units. Owner pays water for 2 upstairs units. 4 bedroom downstairs pays own water. Roof one year old. Tenant occupied units need 24 hrs to show
-
2026-01-08$289,900 Active 342-char remark
Show marketing remark (350 chars)
Income Producing Tri-plex in demand area, near to French Quarter, Fairgrounds, bus lines, shopping areas, restaurants, some rents are low for location, long term tenant. Tenants pay electric & gas all units. Owner pays water for 2 upstairs units. 4 bedroom downstairs pays own water. Roof one year old. Tenant occupied units need 24 hrs to show
-
2026-01-08$289,900 Active 350-char remark
Show marketing remark (350 chars)
Income Producing Tri-plex in demand area, near to French Quarter, Fairgrounds, bus lines, shopping areas, restaurants, some rents are low for location, long term tenant. Tenants pay electric & gas all units. Owner pays water for 2 upstairs units. 4 bedroom downstairs pays own water. Roof one year old. Tenant occupied units need 24 hrs to show
-
2015-06-16historical
-
2015-05-13$147,000 Active
-
2010-06-02$159,000
-
2010-06-02$168,000
-
2010-06-02$168,000
-
2010-06-02$159,000
-
2004-03-12soldstatus $138,500
-
2003-11-07$140,000
-
2003-11-07$140,000
-
1993-10-28soldstatus $15,000
-
1992-04-02soldstatus $20,000
ⓘ Source: listings_history table (triggers on properties + properties_extension) + one-shot
backfill from property_details.listing_events for pre-trigger history.
Tax reassessment forecast LA · Resets to sale price
- Current annual tax
- $1,161 · $97/mo
- Projected year-2 tax
- $1,458 · $121/mo
- Expected delta
- +$296/yr (+$25/mo · 25.5%)
ⓘ Screening estimate from a state-policy table — verify with the county assessor before closing.
Climate risk First Street
- Flood 8/10 Severe FEMA zone X (shaded) · 60% chance over 30 yrs
- Wildfire 1/10 Low
- Heat 10/10 Extreme 7 d/yr ≥108°F today · 21 d/yr by 30 yrs out
- Wind 10/10 Extreme 99% chance of damaging wind over 30 yrs
- Air quality 4/10 Moderate 4 unhealthy d/yr today · 4 by 30 yrs out
Nearby sold comps map
Loading sold comps map…
Walkable amenities ~0.75 mi
Loading nearby amenities…
Taxation est. · year 1
- Rental income
- $51,828
- − Mortgage interest
- −$14,844
- − Property taxes
- −$1,161
- − Insurance
- −$2,122
- − Repairs & maintenance
- −$4,146
- − Management
- −$4,146
- − Depreciation
- −$7,709
- Taxable income
- $17,699
- Est. tax owed @ 24.0%
- −$4,248
- After-tax cash flow
- $16,736/yr
For passive investors: Depreciation is non-cash, so a rental often shows a tax loss while cash-flowing — sheltering income. Rental losses are passive: they offset passive income freely, and up to $25,000/yr can offset ordinary (W-2) income if you actively participate and your MAGI is under $100k (phasing out to $0 by $150k); unused losses carry forward. On sale, claimed depreciation is recaptured at up to 25%, and gains may owe capital-gains tax (a 1031 exchange can defer both). Figures are a year-1 estimate at your 24.0% rate — not tax advice; consult a CPA.
Schools (NCES district)
- District
- Orleans Parish
- NCES district ID
- 2201170
- Math proficiency
- 11% ▼ -52.00%
- Reading proficiency
- 27% ▼ -46.00%
- Median HH income
- $37,011
- Composite
- 15.78/100
- National rank
- #9271
- State rank
- #69 of 98 in LA
Livability — New Orleans
- Score
- 81/100
- State rank
- #3
- US rank
- #1383
Category grades
Schools grade is shown separately in the Schools card above.
Census & demographics
- Census place
- New Orleans, LA
- County
- Orleans Parish · 338,817 people
- City population
- 338,817
- Metro
- New Orleans-Metairie, LA
- Population (ZIP)
- 37,253
- Household income
- $53,143
- Rent vs Own
- Severe rent burden
- 3381.0
Population outlook (Orleans County) Hauer SSP2
- Today (2025)
- 513,025 people
- By 2030
- 575,781 · +12.2%
- By 2040
- 700,174 · +36.5%
- By 2050
- 826,541 · +61.1%
- By 2075
- 1,123,374 · +119.0%
- By 2100
- 1,355,609 · +164.2%
Race, ethnicity, and origin ACS 2023
- Neighborhood character
- Diverse neighborhood (Simpson 0.64)
- Race & ethnicity
- Black 44% White 40% Two or more races 10% Hispanic / Latino 9% Asian 1%
- Hispanic origin (detail)
- Mexican 2%
- Common ancestry
- Lithuanian 8% Slovak 2% Romanian 1%
- Foreign-born
- 6% · Canada, Jamaica
- Languages at home
- 91% English-only · Spanish 6% French/Haitian/Cajun 1% Other Indo-European 0%
Political lean MEDSL · Orleans
- 2024 margin
- Solid D (+67.0) · D 82.2% · R 15.2% · Other 2.7%
- 2008→2024 swing
- +6.7pp toward D · 2008: 60.3pp · 2024: 67.0pp
- All cycles
- 2024: D+67.0 2020: D+68.2 2016: D+66.2 2012: D+62.5 2008: D+60.3
Not yet ingested
- Civics
- —
Market trends
- HPI YoY
- ▼ -135.38%
- Current HPI
- 253.1929
- Rent YoY
- ▼ -0.20%
- Metro
- New Orleans-Metairie, LA
- State GDP YoY
- ▲ 3.29%
- F500 in state
- 10
Industry mix (Fortune 500 HQ in LA)
| Industry | F500 HQs | Revenue |
|---|---|---|
| Telecommunications | 2 | $23B |
|
||
| Utilities | 1 | $12B |
|
||
| Wholesale / Distribution | 1 | $5B |
|
||
| Advertising | 1 | $2B |
|
||
Price history
+1225.0% since first listed17 events — show timeline
- 2026-05-17 Price Changed $265,000 AcadianaMLS
- 2026-05-17 Price Changed $265,000 GSREIN
- 2026-02-02 Price Changed $284,900 AcadianaMLS
- 2026-01-30 Price Changed $284,900 GSREIN
- 2026-01-08 Listed $289,900 GSREIN
- 2026-01-08 Listed $289,900 AcadianaMLS
- 2015-06-16 Listing Removed — GSREIN
- 2015-05-13 Listed $147,000 GSREIN
- 2010-06-02 Listed $159,000 GSREIN
- 2010-06-02 Listed $168,000 GSREIN
- 2010-06-02 Listed $168,000 AcadianaMLS
- 2010-06-02 Listed $159,000 AcadianaMLS
- 2004-03-12 Sold (MLS) $138,500 GSREIN
- 2003-11-07 Listed $140,000 GSREIN
- 2003-11-07 Listed $140,000 AcadianaMLS
- 1993-10-28 Sold (Public Records) $15,000 Public Records
- 1992-04-02 Sold (Public Records) $20,000 Public Records
Property tax history
+1.5%/yrLatest (2026): $1,161 · +1.1% YoY. Source: county tax records.
Cash-flow waterfall
monthlySold comps — $/sqft
last 12 mo · ≤1 miLoading sold comps…