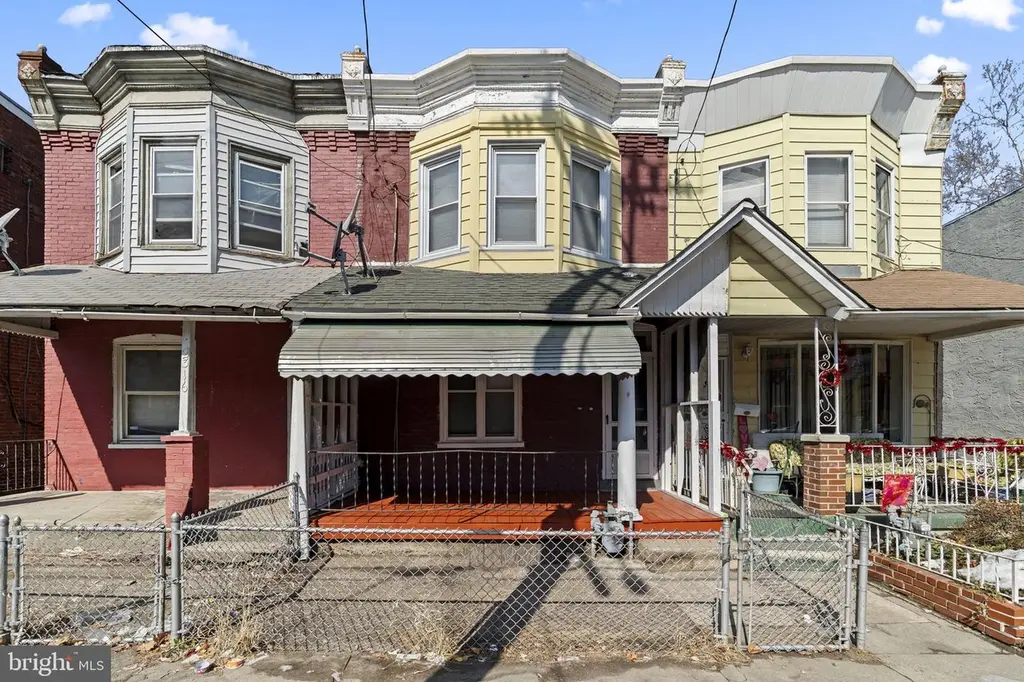
2314 W 3rd St · Chester, PA
Flood risk 1/10 · Minimal
- FEMA flood zone
- X (unshaded)
- Chance of flooding over 30 yrs
- 0.0%
- Est. flood insurance / yr
- $473 – $860
Fire risk 1/10 · Minimal
- Est. fire insurance / yr
- $511 – $949
Heat risk 7/10 · Major
- Hot days now (above 105°F)
- 7 days/yr
- Hot days in 30 yrs
- 15 days/yr
Wind risk 6/10 · Moderate
- Chance of severe wind over 30 yrs
- 27.0%
Air-quality risk 4/10 · Minor
- Unhealthy air days now
- 4 days/yr
- Unhealthy air days in 30 yrs
- 7 days/yr
Risk factors via First Street. Map © Google.
Why this score? — see what drove the D- grade
The composite is a weighted blend of 9 inputs, each scored 0–100. Each bar is that input's sub-score; the figure is the points it added to the 100-point composite (weight × sub-score).
- Cash flow +15.8/30.0
- DSCR +4.9/10.0
- Rent growth +4.2/5.0
- 1% rule +4.1/10.0
- Livability +3.7/5.0
- Condition / age +2.5/5.0
- Schools +0.8/10.0
- ARV discount +0.1/15.0
- Appreciation +0.0/10.0
$159,999
🖨 Deal sheet (PDF) 📄 Offer letter ✓ Due diligence
Listing remarks MLS
Contractors, investors and flippers, are you looking for your next property? Look no further this home is ready for a new life. Large open floor plan with living room, dining room and kitchen all flowing together on 1st floor. Behind the kitchen is a room that would make a great pantry or laundry room. Upstairs are 3 large bedrooms and a full bath.
Key facts
- Close to 95 corridor
- Renovated row home
- Remodeled kitchen
Tags
Neighborhood map
What this means for you Summary
Snapshot
- This is a 3-bed/1.0-bath townhouse listed at $160k.
Deal economics
- At list price, monthly cash flow is $75 ($895/yr) — positive.
- The deal already cash-flows at list — no discount required.
- To meet the 1% rule (rent ≥ 1% of price), the offer needs to be $145k (9.3% below list).
- Recommended offer: $145k (9.3% below list) — sets the bar for 1% rule.
Location & tenants
- Location reads 73/100 on livability (#540 in PA) — a middle-class / working-renter tenant base. Strengths: amenities A+, commute A+, cost of living A+; Watch: crime F, employment F.
- Chester-Upland SD (suburban): math 4% / reading 17% proficiency, ranked #533 of 539 in PA (top 99%) — low school quality limits family demand, transient renter base, plan for 1-2y turnover; 81% free/reduced lunch — lower-income household profile, screen leases tightly.
- Zoned schools: Toby Farms Intermediate School (math 2% / reading 12%, grade F, #506 of 512 statewide, top 99%, 299 students, 100% FRL) — zoned schools average 100% FRL vs 81% district-wide (19 pts higher); higher-poverty schools than district average — tighter screening recommended.
- Market conditions: Rents rising fast (+6.9%/yr); 140 active listings in the ZIP; 16 comparable units currently listed for rent nearby; rentals at typical pace (median 22d on market — plan ~3-4 weeks tenant-placement turnaround); lower-income renter base — watch delinquency; 299 units permitted in Delaware County in 2024 (5 in 5+ unit buildings).
- This rent runs 42% of the median local income ($41k/yr) — at the standard rent-burdened threshold; future hikes will face affordability resistance.
Forward outlook
- Local home prices are declining (-3.0%/yr); year-one equity from $1k of loan paydown is wiped out by about $5k of value loss. Plan a longer hold.
Negotiation context
- It's been on market 35 days — a 3% lower offer ($155k) is reasonable based on typical stale-listing flexibility.
- 2 sale attempts since 4y ago; this cycle's ask has dropped $15k (9%) from the opening price — seller is motivated, your offer sets the floor, not the list.
- Current owner paid $45k; list at $160k implies a 256% gain — meaningful room to come down on a strong offer.
Risks & watch-outs
- Watch-outs: built in 1925 — expect roof / HVAC / electrical / plumbing capex.
- Climate carrying-cost: major wind risk, 27% chance of damaging wind over 30y; extreme-heat days projected 7→15/yr by 2055 (HVAC capex compounding) — expect insurance premiums to compound above CPI over the hold.
Questions for the listing agent
- It's been on market 35 days. Have you received any prior offers? Is the seller open to a 9% concession, seller financing, or rate buy-down credit?
- Built in 1925 — when were the roof, HVAC, electrical panel, plumbing, and water heater last replaced?
- Is there a deadline driving the sale (1031 exchange, divorce, estate, relocation)? That informs how much negotiation room exists.
- Schools are F-rated, which usually means shorter tenancies and higher turnover. Who's the typical renter profile here, and what's been the actual vacancy rate?
- Crime grade is F in this area — have there been break-ins, vandalism, or insurance claims at this property in the last 3 years? What carrier currently insures it and at what premium?
- The area grade is low — what's the realistic commute time and amenity access for the typical tenant pool here? Any planned neighborhood developments (good or bad) we should know about?
- What's the average days-on-market for RENTAL listings here right now (not sales)? A rising rental-DOM trend means longer vacancies and softer asking-rent achievability than the comps imply.
- What's the recent tenant-quality profile in this submarket — average credit score on applications, eviction rate, late-payment / NSF rate, and stable-employment percentage? A property-management company in the area should have these aggregated.
- How much new for-sale + rental construction is in the pipeline within 1–3 miles? Heavy new supply typically softens prices + rents 12–24 months out; constrained supply supports both.
Investment metrics
- 1% rule
- 0.91% ✗
- Cap rate
- 6.85%
- Cash-on-cash
- 2.00%
- DSCR
- 1.09
- GRM
- 9.2
CMA / ARV
- ARV (on-the-fly)
- $137,500
- Comps found
- 12
Show comp detail 12 sales within ~0.75 mi
| Address | Dist | Beds/Ba | Sqft | Sold | Price | $/sf | Match |
|---|---|---|---|---|---|---|---|
| 2314 W 3rd St | 0.00mi | 3/2.0 | 1,250 (0%) | 1mo | $159,000 | $127 | 95 |
| 2610 W 7th St | 0.34mi | 3/1.0 | 1,280 (+2%) | 2mo | $81,000 | $63 | 78 |
| 2611 W 6th St | 0.28mi | 3/1.0 | 1,172 (-6%) | 1mo | $72,000 | $61 | 75 |
| 2012 W 6th St | 0.31mi | 3/1.5 | 1,260 (+1%) | 10mo | $101,000 | $80 | 74 |
| 715 Engle St | 0.32mi | 3/2.0 | 1,268 (+1%) | 10mo | $130,000 | $103 | 71 |
| 708 Ward St | 0.34mi | 3/2.0 | 1,353 (+8%) | 2mo | $170,000 | $126 | 65 |
| 2624 Mccarey St | 0.57mi | 3/1.0 | 1,210 (-3%) | 6mo | $75,000 | $62 | 64 |
| 606 Norris St | 0.67mi | 3/1.0 | 1,188 (-5%) | 2mo | $149,500 | $126 | 59 |
| 1305 Highland Ave | 0.72mi | 3/1.0 | 1,210 (-3%) | 4mo | $125,000 | $103 | 57 |
| 2603 Swarts St | 0.69mi | 3/1.0 | 1,196 (-4%) | 11mo | $140,000 | $117 | 52 |
| 3011 W 7th St | 0.54mi | 3/1.0 | 1,088 (-13%) | 3mo | $120,000 | $110 | 51 |
| 1340 W 7th St | 0.71mi | 3/1.0 | 1,392 (+11%) | 0mo | $179,000 | $129 | 48 |
Match score weights: distance 35% · size 25% · config 20% · recency 20%. Top-matched comps best support the ARV.
Projected returns pro-forma
-3.0% appreciation · 6.88% rent growth · sell at horizon
- IRR
- -9.0%
- Equity multiple
- 0.66×
- Total profit
- $-15,287
- Equity at exit
- $23,856
- IRR
- 4.9%
- Equity multiple
- 1.42×
- Total profit
- $18,976
- Equity at exit
- $13,834
Cash invested: $44,800 (down + closing). Projections, not guarantees.
Landlord ↔ Tenant lean methodology
- Overall (STATE)
- 62 Landlord-Friendly
- State Pennsylvania
- 62 Landlord-Friendly · EVEN
- County
- — inherits STATE
- City
- — inherits STATE
ZIP-level market 19013
- Rents YoY
- 6.9%
- Active inventory
- 140
- Price-to-rent
- 9.2×
Monthly cashflow live
- Estimated rent
- $1,451 high interval (Pro) →
- Mortgage (P&I)
- −$839
- Tax from tax record
- −$166 /mo · $1,993/yr
- Insurance
- −$67
- HOA
- −$0
- Vacancy / Maint / Mgmt
- −$305
- Net cashflow
- $75
Break-even live
Sensitivity live
| Price | -10% $165 | -5% $120 | +0% $75 | +5% $29 | +10% $-16 |
|---|---|---|---|---|---|
| Rent | -10% $-40 | -5% $17 | +0% $75 | +5% $132 | +10% $189 |
| Rate | -1.0pp $155 | -0.5pp $115 | base $75 | +0.5pp $33 | +1.0pp $-9 |
UW: 25.0% down · 7.5% · 30yr · 1.5% tax · 5.0% vac · 8.0% maint · 8.0% mgmt
Financing live
Cash to close
- Down payment
- $40,000
- Closing costs
- $4,800
- Reserves months
- —
- Total cash needed
- —
Loan-product check · same deal, 3 products live
Conventional
25% down · 7.5% · 30yr
- Down + closing
- —
- Monthly P&I
- —
- Monthly cashflow
- —
- DSCR
- —
- Eligible?
- —
Personal DTI + credit; lowest rate.
DSCR
20% down · 8.5% · 30yr
- Down + closing
- —
- Monthly P&I
- —
- Monthly cashflow
- —
- DSCR
- —
- Eligible?
- —
No personal income docs; deal must DSCR.
Hard money
10% down · 12.0% · 12mo
- Down + closing
- —
- Monthly P&I
- —
- Monthly cashflow
- —
- DSCR
- —
- Eligible?
- —
Short-term bridge; refi at stabilization.
Rent comps 16 comps
| Address | Beds | Baths | Sqft | Rent | $/sqft | DOM | Units | Dist |
|---|---|---|---|---|---|---|---|---|
| 2106 W 4th St Unit 2 Chester, PA | 2.0 | 1.0 | 1736 | $1,100 | $0.63 | 45d | 1 | 0.13mi |
| 2723 W 3rd St Unit 1F Chester, PA | 4.0 | 1.5 | 1800 | $1,425 | $0.79 | 26d | 1 | 0.32mi |
| 2723 W 3rd St Unit 1F Chester, PA | 4.0 | 1.5 | 1800 | $1,425 | $0.79 | 7d | 1 | 0.32mi |
| 2723 W 3rd St Unit 1F Chester, PA | 4.0 | 1.5 | 1800 | $1,500 | $0.83 | 45d | 1 | 0.32mi |
| 2723 W 3rd St Unit 1F Chester, PA | 4.0 | 1.5 | 1800 | $1,425 | $0.79 | 22d | 1 | 0.32mi |
| 425 Highland Ave Apt A Chester, PA | 2.0 | 1.5 | 990 | $1,000 | $1.01 | 22d | 1 | 0.34mi |
| 425 Highland Ave Apt A Chester, PA | 2.0 | 1.5 | 1829 | $1,000 | $0.55 | 45d | 1 | 0.34mi |
| 2832 W 6th St Unit 306 Chester, PA | 3.0 | 1.0 | 1428 | $1,500 | $1.05 | 6d | 1 | 0.46mi |
| 2104 N Williams Cir Chester, PA | 4.0 | 1.5 | 1540 | $1,895 | $1.23 | 45d | 1 | 0.57mi |
| 1425 Highland Ave Chester, PA | 3.0 | 1.0 | 1212 | $7,998 | $6.60 | 0d | 1 | 0.83mi |
| 925 W 3rd St Chester, PA | 4.0 | 1.0 | 1500 | $1,700 | $1.13 | 20d | 1 | 0.88mi |
| 3312 W 13th St Chester, PA | 2.0 | 1.0 | 936 | $1,499 | $1.60 | 23d | 1 | 0.90mi |
| 2717 Bethel Rd Chester, PA | 3.0 | 1.0 | 1785 | $1,350 | $0.76 | 7d | 1 | 0.94mi |
| 418 Penn St Chester, PA | 3.0 | 1.0 | 1250 | $1,350 | $1.08 | 45d | 1 | 1.42mi |
| 1315 Harshaw Rd Brookhaven, PA | 3.0 | 2.5 | 1260 | $2,395 | $1.90 | 0d | 1 | 1.44mi |
| 1224 Elson Rd Brookhaven, PA | 3.0 | 2.0 | 1200 | $1,900 | $1.58 | 19d | 1 | 1.49mi |
Listing history 11 events
-
2026-04-27status Pending
-
2026-04-15price $159,999
-
2026-04-10price $164,999
-
2026-03-23$175,000 Active
-
2022-08-17soldstatus $45,000
-
2022-08-15soldstatus $45,000 Closed 350-char remark
Show marketing remark (350 chars)
Contractors, investors and flippers, are you looking for your next property? Look no further this home is ready for a new life. Large open floor plan with living room, dining room and kitchen all flowing together on 1st floor. Behind the kitchen is a room that would make a great pantry or laundry room. Upstairs are 3 large bedrooms and a full bath.
-
2022-08-02status Pending 350-char remark
Show marketing remark (350 chars)
Contractors, investors and flippers, are you looking for your next property? Look no further this home is ready for a new life. Large open floor plan with living room, dining room and kitchen all flowing together on 1st floor. Behind the kitchen is a room that would make a great pantry or laundry room. Upstairs are 3 large bedrooms and a full bath.
-
2022-07-11historical Active Under Contract 350-char remark
Show marketing remark (350 chars)
Contractors, investors and flippers, are you looking for your next property? Look no further this home is ready for a new life. Large open floor plan with living room, dining room and kitchen all flowing together on 1st floor. Behind the kitchen is a room that would make a great pantry or laundry room. Upstairs are 3 large bedrooms and a full bath.
-
2022-07-01$50,000 Active 350-char remark
Show marketing remark (350 chars)
Contractors, investors and flippers, are you looking for your next property? Look no further this home is ready for a new life. Large open floor plan with living room, dining room and kitchen all flowing together on 1st floor. Behind the kitchen is a room that would make a great pantry or laundry room. Upstairs are 3 large bedrooms and a full bath.
-
1995-04-27soldstatus $28,000
-
1992-09-02soldstatus $8,000
ⓘ Source: listings_history table (triggers on properties + properties_extension) + one-shot
backfill from property_details.listing_events for pre-trigger history.
Tax reassessment forecast PA · Partial reset (capped growth)
- Current annual tax
- $1,993 · $166/mo
- Projected year-2 tax
- $2,260 · $188/mo
- Expected delta
- +$268/yr (+$22/mo · 13.4%)
ⓘ Screening estimate from a state-policy table — verify with the county assessor before closing.
Climate risk First Street
- Flood 1/10 Low FEMA zone X (unshaded) · 0% chance over 30 yrs
- Wildfire 1/10 Low
- Heat 7/10 Severe 7 d/yr ≥105°F today · 15 d/yr by 30 yrs out
- Wind 6/10 Major 27% chance of damaging wind over 30 yrs
- Air quality 4/10 Moderate 4 unhealthy d/yr today · 7 by 30 yrs out
Nearby sold comps map
Loading sold comps map…
Walkable amenities ~0.75 mi
Loading nearby amenities…
Taxation est. · year 1
- Rental income
- $17,413
- − Mortgage interest
- −$8,962
- − Property taxes
- −$1,993
- − Insurance
- −$800
- − Repairs & maintenance
- −$1,393
- − Management
- −$1,393
- − Depreciation
- −$4,655
- Taxable loss
- −$1,782
- Est. tax savings @ 24.0%
- +$428
- After-tax cash flow
- $1,323/yr
For passive investors: Depreciation is non-cash, so a rental often shows a tax loss while cash-flowing — sheltering income. Rental losses are passive: they offset passive income freely, and up to $25,000/yr can offset ordinary (W-2) income if you actively participate and your MAGI is under $100k (phasing out to $0 by $150k); unused losses carry forward. On sale, claimed depreciation is recaptured at up to 25%, and gains may owe capital-gains tax (a 1031 exchange can defer both). Figures are a year-1 estimate at your 24.0% rate — not tax advice; consult a CPA.
Schools (NCES district)
- District
- Chester-Upland SD
- NCES district ID
- 4205860
- Math proficiency
- 4% ▼ -3.00%
- Reading proficiency
- 17% ▼ -6.00%
- Median HH income
- $29,790
- Composite
- 8.05/100
- National rank
- #9918
- State rank
- #533 of 539 in PA
Livability — Chester
- Score
- 73/100
- State rank
- #540
- US rank
- #5053
Category grades
Schools grade is shown separately in the Schools card above.
Census & demographics
- Census place
- Chester, PA
- County
- Delaware County · 399,863 people
- City population
- 35,064
- Metro
- Philadelphia-Camden-Wilmington, PA-NJ-DE-MD
- Population (ZIP)
- 35,064
- Household income
- $41,261
- Rent vs Own
- Severe rent burden
- 2668.0
Population outlook (Delaware County) Hauer SSP2
- Today (2025)
- 577,490 people
- By 2030
- 581,243 · +0.6%
- By 2040
- 584,700 · +1.2%
- By 2050
- 586,581 · +1.6%
- By 2075
- 598,706 · +3.7%
- By 2100
- 590,823 · +2.3%
Race, ethnicity, and origin ACS 2023
- Neighborhood character
- Predominantly Black (71%)
- Race & ethnicity
- Black 71% White 14% Hispanic / Latino 9% Two or more races 4%
- Hispanic origin (detail)
- Puerto Rican 6%
- Common ancestry
- Romanian 2%
- Foreign-born
- 4% · Canada
- Languages at home
- 92% English-only · Spanish 6%
Political lean MEDSL · Delaware
- 2024 margin
- Strong D (+23.7) · D 61.4% · R 37.6% · Other 1.0%
- 2008→2024 swing
- +2.3pp toward D · 2008: 21.4pp · 2024: 23.7pp
- All cycles
- 2024: D+23.7 2020: D+26.7 2016: D+22.0 2012: D+21.8 2008: D+21.4
Not yet ingested
- Civics
- —
Market trends
- HPI YoY
- ▼ -149.69%
- Current HPI
- 219.5173
- Rent YoY
- ▲ 6.88%
- Metro
- Philadelphia-Camden-Wilmington, PA-NJ-DE-MD
- State GDP YoY
- ▲ 1.68%
- F500 in state
- 34
Industry mix (Fortune 500 HQ in PA)
| Industry | F500 HQs | Revenue |
|---|---|---|
| Healthcare | 2 | $309B |
|
||
| Insurance | 2 | $27B |
|
||
| Telecommunications / Media | 1 | $124B |
|
||
| Industrial Distribution | 1 | $22B |
|
||
| Financial Services | 1 | $20B |
|
||
| Chemicals / Materials | 1 | $18B |
|
||
Price history
+1900.0% since first listed11 events — show timeline
- 2026-04-27 Pending — BRIGHT MLS
- 2026-04-15 Price Changed $159,999 BRIGHT MLS
- 2026-04-10 Price Changed $164,999 BRIGHT MLS
- 2026-03-23 Listed $175,000 BRIGHT MLS
- 2022-08-17 Sold (Public Records) $45,000 Public Records
- 2022-08-15 Sold (MLS) $45,000 BRIGHT MLS
- 2022-08-02 Pending — BRIGHT MLS
- 2022-07-11 Contingent — BRIGHT MLS
- 2022-07-01 Listed $50,000 BRIGHT MLS
- 1995-04-27 Sold (Public Records) $28,000 Public Records
- 1992-09-02 Sold (Public Records) $8,000 Public Records
Property tax history
+19.3%/yrLatest (2026): $1,993 · +143.3% YoY. Source: county tax records.
Cash-flow waterfall
monthlySold comps — $/sqft
last 12 mo · ≤1 miLoading sold comps…