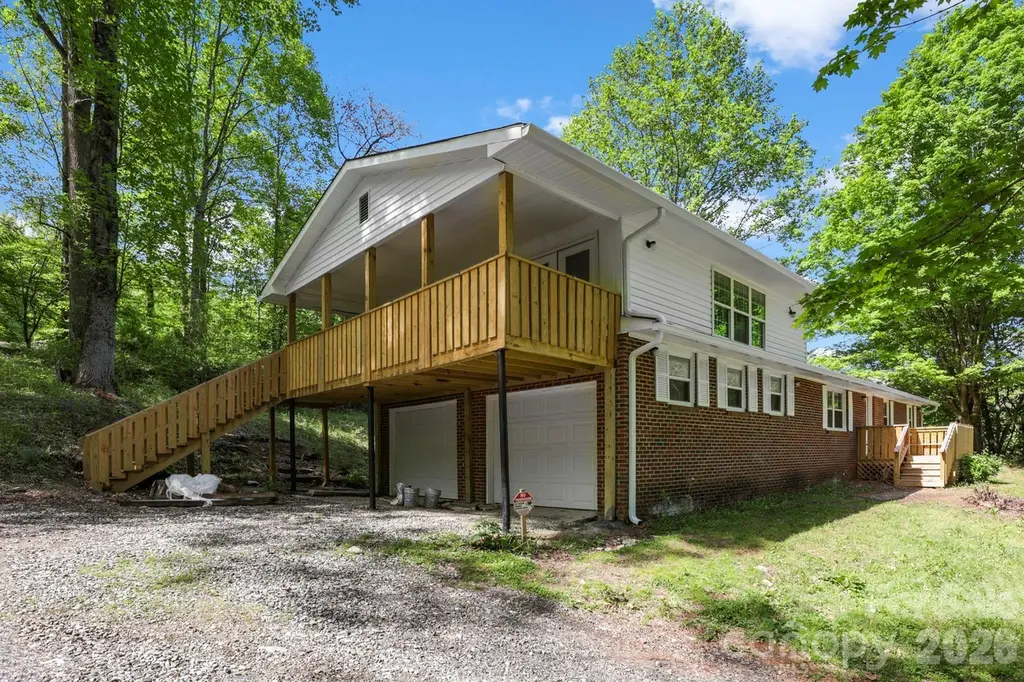
1007 N Fork Rd · Barnardsville, NC
Flood risk 9/10 · Severe
- FEMA flood zone
- X (unshaded)
- Chance of flooding over 30 yrs
- 0.99%
- Est. flood insurance / yr
- $473 – $860
Fire risk 4/10 · Minor
- Est. fire insurance / yr
- $906 – $1,684
Heat risk 3/10 · Minor
- Hot days now (above 84°F)
- 10 days/yr
- Hot days in 30 yrs
- 27 days/yr
Wind risk 2/10 · Minimal
- Chance of severe wind over 30 yrs
- —
Air-quality risk 3/10 · Minor
- Unhealthy air days now
- 3 days/yr
- Unhealthy air days in 30 yrs
- 3 days/yr
Risk factors via First Street. Map © Google.
Why this score? — see what drove the D grade
The composite is a weighted blend of 9 inputs, each scored 0–100. Each bar is that input's sub-score; the figure is the points it added to the 100-point composite (weight × sub-score).
- ARV discount +15.0/15.0
- Cash flow +8.7/30.0
- Schools +4.0/10.0
- Appreciation +3.3/10.0
- Rent growth +2.5/5.0
- Livability +2.5/5.0
- Condition / age +2.5/5.0
- DSCR +2.4/10.0
- 1% rule +1.5/10.0
$350,000
🖨 Deal sheet 📄 Offer letter ✓ Due diligence
Listing remarks MLS
Take advantage of the renovation opportunity with just enough space to give you the privacy you would like without the large acreage upkeep. Property sold as as is.
Key facts
- 1.8 acre lot
- 2 garage spots
- Built 1968
Property features AI
Finance
- Other: Zoned for multiple dwelling
- Financial info: No restrictions
- HOA & community: No HOA
Exterior
- Parking: Attached garage that faces the side; Two enclosed garage spaces; Two open driveway parking spaces; Has both garage and open parking
- Utilities: Water from a well; Septic system installed
- Home design: Single family residence (residential); Site-built construction; 1 story with finished room over garage (F.R.O.G.); Partial brick exterior
- Construction: Crawl space foundation
- Exterior features: Creek/stream on the property; Roads are a mix of gravel and paved; Publicly maintained road
Interior
- Kitchen: Dishwasher; Electric range
- Bedrooms: Three bedrooms on the main level
- Flooring: Carpet; Vinyl
- Bathrooms: One full bathroom (main level)
- Heating & cooling: Central heating; Ductless heating option (heat pump); Central air; Ductless cooling
- Interior features: 7 total rooms; Wood-burning fireplace in a bonus room; Other exterior features noted in remarks
- Laundry & utility: Laundry located in the kitchen; Electric water heater
Neighborhood map
What this means for you Summary
Snapshot
- This is a 3-bed/1.0-bath other listed at $350k.
Deal economics
- At list price, monthly cash flow is $-352 ($-4k/yr) — negative.
- To cash-flow at today's rent, offer at most $288k (17.8% below list).
- To meet the 1% rule (rent ≥ 1% of price), the offer needs to be $228k (35.0% below list).
- Recommended offer: $228k (35.0% below list) — sets the bar for 1% rule.
- Cap rate 5.3% vs local median 2.4% in Barnardsville — top-decile yield for the area; either an underpriced asset or a hidden risk that comps aren't pricing in. Stress-test before assuming the spread holds.
Location & tenants
- Location reads: area grade D — affects rentability + tenant quality, not the cash-flow math above.
- Buncombe County Schools (suburban): math 45% / reading 50% proficiency, ranked #72 of 178 in NC (top 40%) — families likely to look elsewhere, expect single-tenant / working-renter base with shorter leases.
- Market conditions: 23 active listings in the ZIP; 3,305 units permitted in Buncombe County in 2024 (1,855 in 5+ unit buildings).
Forward outlook
- Local home prices are declining (-3.0%/yr); year-one equity from $2k of loan paydown is wiped out by about $10k of value loss. Plan a longer hold.
- Buncombe County population projected at +24% by 2050 — long-run rental-demand tailwind backs the buy-and-hold thesis.
Negotiation context
- It's been on market 49 days — a 3% lower offer ($340k) is reasonable based on typical stale-listing flexibility.
- 2 sale attempts since 2y ago; this cycle's ask has dropped $25k (7%) from the opening price — seller is motivated, your offer sets the floor, not the list.
- Current owner paid $130k; list at $350k implies a 169% gain — meaningful room to come down on a strong offer.
Risks & watch-outs
- Watch-outs: flood insurance adds $56/mo.
- Climate carrying-cost: severe flood risk — expect insurance premiums to compound above CPI over the hold.
Questions for the listing agent
- What do current leases actually rent for vs. the listed asking? Can we see a recent rent roll and the last 12 months of T-12 income?
- It's been on market 49 days. Have you received any prior offers? Is the seller open to a 35% concession, seller financing, or rate buy-down credit?
- Built in 1968 — when were the roof, HVAC, electrical panel, plumbing, and water heater last replaced?
- What's the actual annual flood-insurance premium (NFIP or private), and is the property in a SFHA with mandatory coverage?
- Is there a deadline driving the sale (1031 exchange, divorce, estate, relocation)? That informs how much negotiation room exists.
- The area grade is low — what's the realistic commute time and amenity access for the typical tenant pool here? Any planned neighborhood developments (good or bad) we should know about?
- What's the average days-on-market for RENTAL listings here right now (not sales)? A rising rental-DOM trend means longer vacancies and softer asking-rent achievability than the comps imply.
- What's the recent tenant-quality profile in this submarket — average credit score on applications, eviction rate, late-payment / NSF rate, and stable-employment percentage? A property-management company in the area should have these aggregated.
- How much new for-sale + rental construction is in the pipeline within 1–3 miles? Heavy new supply typically softens prices + rents 12–24 months out; constrained supply supports both.
Investment metrics
- 1% rule
- 0.65% ✗
- Cap rate
- 5.28%
- Cash-on-cash
- -3.63%
- DSCR
- 0.84
- GRM
- 12.8
CMA / ARV
- ARV (median comp)
- $444,207
- List price
- $350,000
- Delta
- -21.21%
- Verdict
- UNDERPRICED
- Comps
- 2 within 1.0 mi
Projected returns pro-forma
-3.0% appreciation · 3.0% rent growth · sell at horizon
- IRR
- -23.6%
- Equity multiple
- 0.19×
- Total profit
- $-79,246
- Equity at exit
- $52,186
- IRR
- -18.7%
- Equity multiple
- -0.00×
- Total profit
- $-98,381
- Equity at exit
- $30,262
Cash invested: $98,000 (down + closing). Projections, not guarantees.
Landlord ↔ Tenant lean methodology
- Overall (STATE)
- 85 Strongly Landlord-Friendly
- State North Carolina
- 85 Strongly Landlord-Friendly · R+3
- County
- — inherits STATE
- City
- — inherits STATE
ZIP-level market 28709
- Home prices YoY
- -1.1%
- Active inventory
- 23
- Price-to-rent
- 12.8×
Monthly cashflow live
- Estimated rent
- $2,276 medium interval (Pro) →
- Mortgage (P&I)
- −$1,835
- Tax from tax record
- −$113 /mo · $1,355/yr
- Insurance
- −$146
- Flood insurance flood zone
- −$56 /mo · $666/yr
- HOA
- −$0
- Vacancy / Maint / Mgmt
- −$478
- Net cashflow
- $-352
Break-even live
UW: 25.0% down · 7.5% · 30yr · 1.5% tax · 5.0% vac · 8.0% maint · 8.0% mgmt
Financing live
Cash to close
- Down payment
- $87,500
- Closing costs
- $10,500
- Reserves months
- —
- Total cash needed
- —
Loan-product check · same deal, 3 products live
Conventional
25% down · 7.5% · 30yr
- Down + closing
- —
- Monthly P&I
- —
- Monthly cashflow
- —
- DSCR
- —
- Eligible?
- —
Personal DTI + credit; lowest rate.
DSCR
20% down · 8.5% · 30yr
- Down + closing
- —
- Monthly P&I
- —
- Monthly cashflow
- —
- DSCR
- —
- Eligible?
- —
No personal income docs; deal must DSCR.
Hard money
10% down · 12.0% · 12mo
- Down + closing
- —
- Monthly P&I
- —
- Monthly cashflow
- —
- DSCR
- —
- Eligible?
- —
Short-term bridge; refi at stabilization.
Listing history 22 events
-
2026-06-18days on market $350,000 Active 49 DOM
-
2026-06-17days on market $350,000 Active 48 DOM
-
2026-06-16days on market $350,000 Active 47 DOM
-
2026-06-15pricedays on market $350,000 Active 46 DOM
-
2026-06-14days on market $375,000 Active 44 DOM
-
2026-06-10days on market $375,000 Active 41 DOM
-
2026-06-09days on market $375,000 Active 40 DOM
-
2026-06-08days on market $375,000 Active 39 DOM
-
2026-06-07days on market $375,000 Active 38 DOM
-
2026-06-03days on market $375,000 Active 34 DOM
-
2026-06-02days on market $375,000 Active 33 DOM
-
2026-06-01days on market $375,000 Active 32 DOM
-
2026-05-31days on market $375,000 Active 31 DOM
-
2026-05-30days on market $375,000 Active 30 DOM
-
2026-05-01$375,000 Active 1231-char remark
-
2026-04-27historical $375,000 1231-char remark
-
2024-05-31soldstatus $130,000
-
2024-05-29soldstatus $130,000 Closed 166-char remark
Show marketing remark (166 chars)
Take advantage of the renovation opportunity with just enough space to give you the privacy you would like without the large acreage upkeep. Property sold as as is.
-
2024-04-24historical Active Under Contract 166-char remark
Show marketing remark (166 chars)
Take advantage of the renovation opportunity with just enough space to give you the privacy you would like without the large acreage upkeep. Property sold as as is.
-
2024-03-27price $155,000 166-char remark
Show marketing remark (166 chars)
Take advantage of the renovation opportunity with just enough space to give you the privacy you would like without the large acreage upkeep. Property sold as as is.
-
2024-03-10price $160,000 166-char remark
Show marketing remark (166 chars)
Take advantage of the renovation opportunity with just enough space to give you the privacy you would like without the large acreage upkeep. Property sold as as is.
-
2024-02-23$165,000 Active 166-char remark
Show marketing remark (166 chars)
Take advantage of the renovation opportunity with just enough space to give you the privacy you would like without the large acreage upkeep. Property sold as as is.
ⓘ Source: listings_history table (triggers on properties + properties_extension) + one-shot
backfill from property_details.listing_events for pre-trigger history.
Tax reassessment forecast NC · Resets to sale price
- Current annual tax
- $1,355 · $113/mo
- Projected year-2 tax
- $2,870 · $239/mo
- Expected delta
- +$1,515/yr (+$126/mo · 111.8%)
ⓘ Screening estimate from a state-policy table — verify with the county assessor before closing.
Climate risk First Street
- Flood 9/10 Extreme FEMA zone X (unshaded) · 99% chance over 30 yrs
- Wildfire 4/10 Moderate
- Heat 3/10 Moderate 10 d/yr ≥84°F today · 27 d/yr by 30 yrs out
- Wind 2/10 Low
- Air quality 3/10 Moderate 3 unhealthy d/yr today · 3 by 30 yrs out
Nearby sold comps map
Loading sold comps map…
Walkable amenities ~0.75 mi
Loading nearby amenities…
Taxation est. · year 1
- Rental income
- $27,312
- − Mortgage interest
- −$19,605
- − Property taxes
- −$1,355
- − Insurance
- −$2,416
- − Repairs & maintenance
- −$2,185
- − Management
- −$2,185
- − Depreciation
- −$10,182
- Taxable loss
- −$10,617
- Est. tax savings @ 24.0%
- +$2,548
- After-tax cash flow
- $-1,672/yr
For passive investors: Depreciation is non-cash, so a rental often shows a tax loss while cash-flowing — sheltering income. Rental losses are passive: they offset passive income freely, and up to $25,000/yr can offset ordinary (W-2) income if you actively participate and your MAGI is under $100k (phasing out to $0 by $150k); unused losses carry forward. On sale, claimed depreciation is recaptured at up to 25%, and gains may owe capital-gains tax (a 1031 exchange can defer both). Figures are a year-1 estimate at your 24.0% rate — not tax advice; consult a CPA.
Schools (NCES district)
- District
- Buncombe County Schools
- NCES district ID
- 3700450
- Math proficiency
- 45% ▬ 0.00%
- Reading proficiency
- 50% ▲ 2.00%
- Median HH income
- $45,981
- Composite
- 40.32/100
- National rank
- #3749
- State rank
- #72 of 178 in NC
Livability — Barnardsville
No livability data for this city. (Only ~50 U.S. cities are tracked.)
Census & demographics
- Population (ZIP)
- 2,269
Population outlook (Buncombe County) Hauer SSP2
- Today (2025)
- 286,475 people
- By 2030
- 302,237 · +5.5%
- By 2040
- 330,687 · +15.4%
- By 2050
- 356,370 · +24.4%
- By 2075
- 409,383 · +42.9%
- By 2100
- 437,270 · +52.6%
Race, ethnicity, and origin ACS 2023
- Neighborhood character
- Predominantly White (96%)
- Race & ethnicity
- White 96% Hispanic / Latino 4%
- Common ancestry
- Lithuanian 5% Slovak 4% Iranian 4%
- Foreign-born
- 1% · Canada
- Languages at home
- 98% English-only · Spanish 1%
Political lean MEDSL · Buncombe
- 2024 margin
- Strong D (+24.8) · D 61.7% · R 36.9% · Other 1.4%
- 2008→2024 swing
- +10.9pp toward D · 2008: 13.9pp · 2024: 24.8pp
- All cycles
- 2024: D+24.8 2020: D+21.1 2016: D+14.6 2012: D+12.4 2008: D+13.9
Not yet ingested
- Civics
- —
Market trends
- HPI YoY
- ▼ -3.40%
- Current HPI
- 321.4294
- Rent YoY
- —
- Metro
- —
- State GDP YoY
- ▲ 3.28%
- F500 in state
- 26
Industry mix (Fortune 500 HQ in NC)
| Industry | F500 HQs | Revenue |
|---|---|---|
| Financial Services | 2 | $213B |
|
||
| Retail | 2 | $95B |
|
||
| Industrial Conglomerate | 1 | $38B |
|
||
| Metals / Steel | 1 | $35B |
|
||
| Utilities | 1 | $30B |
|
||
| Industrial Machinery | 1 | $19B |
|
||
Price history
+112.1% since first listed9 events — show timeline
- 2026-06-14 Price Changed $350,000 CANOPYMLS as Distributed by MLS Grid
- 2026-05-01 Listed $375,000 CANOPYMLS as Distributed by MLS Grid
- 2026-04-27 Coming Soon $375,000 CANOPYMLS as Distributed by MLS Grid
- 2024-05-31 Sold (Public Records) $130,000 Public Records
- 2024-05-29 Sold (MLS) $130,000 CANOPYMLS as Distributed by MLS Grid
- 2024-04-24 Contingent — CANOPYMLS as Distributed by MLS Grid
- 2024-03-27 Price Changed $155,000 CANOPYMLS as Distributed by MLS Grid
- 2024-03-10 Price Changed $160,000 CANOPYMLS as Distributed by MLS Grid
- 2024-02-23 Listed $165,000 CANOPYMLS as Distributed by MLS Grid
Property tax history
+8.9%/yrLatest (2025): $1,355 · -18.6% YoY. Source: county tax records.
Cash-flow waterfall
monthlySold comps — $/sqft
last 12 mo · ≤1 miLoading sold comps…