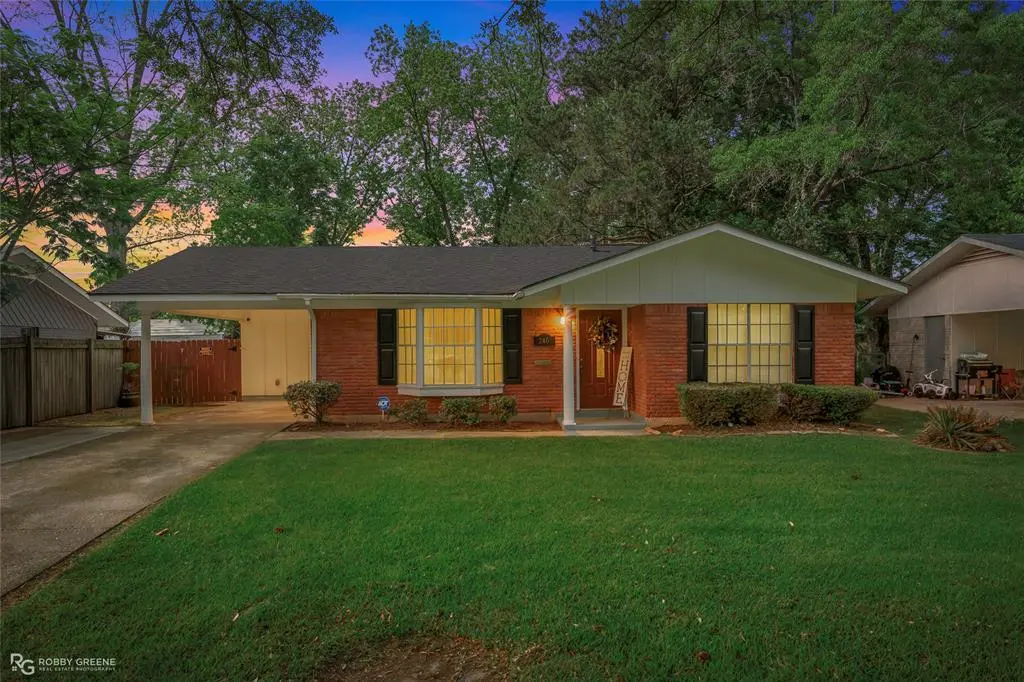
246 Brookbriar Dr · Shreveport, LA
Flood risk 3/10 · Minor
- FEMA flood zone
- X
- Chance of flooding over 30 yrs
- 0.2%
- Est. flood insurance / yr
- $507 – $1,088
Fire risk 1/10 · Minimal
- Est. fire insurance / yr
- $1,269 – $2,357
Heat risk 7/10 · Major
- Hot days now (above 110°F)
- 7 days/yr
- Hot days in 30 yrs
- 22 days/yr
Wind risk 6/10 · Moderate
- Chance of severe wind over 30 yrs
- 63.0%
Air-quality risk 2/10 · Minimal
- Unhealthy air days now
- 1 days/yr
- Unhealthy air days in 30 yrs
- 1 days/yr
Risk factors via First Street. Map © Google.
Why this score? — see what drove the C- grade
The composite is a weighted blend of 9 inputs, each scored 0–100. Each bar is that input's sub-score; the figure is the points it added to the 100-point composite (weight × sub-score).
- Cash flow +21.7/30.0
- ARV discount +7.5/15.0
- DSCR +6.9/10.0
- 1% rule +4.8/10.0
- Livability +3.0/5.0
- Rent growth +2.5/5.0
- Condition / age +2.5/5.0
- Schools +2.2/10.0
- Appreciation +0.0/10.0
$125,000
🖨 Deal sheet 📄 Offer letter ✓ Due diligence
Listing remarks
Looking for an affordable place to call home? This 3 bedroom 2.5 bath beauty offers comfort, space, and value at an attractive price point. Spacious living area , great yard and convenient location. whether your first time homebuyer an investment opportunity this home deserves a look. call for showing now. Sold as is
Key facts
- Great yard
- Convenient location
- 8,712 sq ft lot
Tags
Property features AI
Finance
- Other: Possession available in 30–60 days; Listing status: Active
- Financial info: Treat as clear loan type; No second mortgage
- HOA & community: No association
Exterior
- Parking: Covered carport with 2 spaces; Additional parking available
- Security: Not specified
- Utilities: City sewer; City water; Electricity available; Not in a municipal utility district
- Home design: Single family residence; Attached property; Built in 2001
- Construction: Year built 2001
- Exterior features: Lot less than 0.5 acre (approx. 0.20 acre); Subdivision: Highland Park Sub; Directions: see GPS
Interior
- Kitchen: Gas oven; Gas range; Microwave; Refrigerator; Granite counters
- Bedrooms: 3 bedrooms (primary bedroom on level 1, approx. 16 x 16)
- Flooring: Not specified
- Bathrooms: 2 full bathrooms
- Heating & cooling: Not specified
- Interior features: Granite counters; Open floorplan; One-level layout
- Laundry & utility: Gas water heater
Neighborhood map
What this means for you Summary
Snapshot
- This is a 3-bed/1.5-bath single-family listed at $125k.
Deal economics
- At list price, monthly cash flow is $193 ($2k/yr) — positive.
- The deal already cash-flows at list — no discount required.
- To meet the 1% rule (rent ≥ 1% of price), the offer needs to be $123k (1.7% below list).
- Recommended offer: $123k (1.7% below list) — sets the bar for 1% rule.
- Cap rate 8.1% vs local median 5.7% in Shreveport — top-decile yield for the area; either an underpriced asset or a hidden risk that comps aren't pricing in. Stress-test before assuming the spread holds.
Location & tenants
- Location reads 59/100 on livability (#270 in LA) — a working-class tenant base; expect higher turnover. Strengths: cost of living A+, housing A; Watch: schools D+, crime F, amenities F.
- Caddo Parish (urban): math 21% / reading 32% proficiency, ranked #53 of 98 in LA (top 54%) — low school quality limits family demand, transient renter base, plan for 1-2y turnover; 64% free/reduced lunch — lower-income household profile, screen leases tightly.
- Market conditions: 262 active listings in the ZIP; 4 comparable units currently listed for rent nearby; rentals lingering (median 44d on market — plan ~5-8 weeks vacancy on turnover, expect pricing pressure); 50% of comp listings sitting > 30 days — soft ceiling on asking rent; 221 units permitted in Caddo Parish in 2024 (0 in 5+ unit buildings).
- This rent runs 30% of the median local income ($48k/yr) — at the standard rent-burdened threshold; future hikes will face affordability resistance.
Forward outlook
- Local home prices are declining (-3.0%/yr); year-one equity from $864 of loan paydown is wiped out by about $4k of value loss. Plan a longer hold.
- Caddo County population projected at -15% by 2050 — secular population decline; favor cash flow + early exit over multi-decade hold.
Negotiation context
- Only 6 days on market — expect competitive offers; lowballing is unlikely to land.
- 3 sale attempts since 5y ago with the ask held roughly flat each time — persistent listings suggest the price (not the market) is what's stuck; bring a comps-based counter.
Risks & watch-outs
- Climate carrying-cost: major wind risk, 63% chance of damaging wind over 30y; extreme-heat days projected 7→22/yr by 2055 (HVAC capex compounding) — expect insurance premiums to compound above CPI over the hold.
Questions for the listing agent
- Is there a deadline driving the sale (1031 exchange, divorce, estate, relocation)? That informs how much negotiation room exists.
- Schools are D-rated, which usually means shorter tenancies and higher turnover. Who's the typical renter profile here, and what's been the actual vacancy rate?
- Crime grade is F in this area — have there been break-ins, vandalism, or insurance claims at this property in the last 3 years? What carrier currently insures it and at what premium?
- What's the average days-on-market for RENTAL listings here right now (not sales)? A rising rental-DOM trend means longer vacancies and softer asking-rent achievability than the comps imply.
- What's the recent tenant-quality profile in this submarket — average credit score on applications, eviction rate, late-payment / NSF rate, and stable-employment percentage? A property-management company in the area should have these aggregated.
- How much new for-sale + rental construction is in the pipeline within 1–3 miles? Heavy new supply typically softens prices + rents 12–24 months out; constrained supply supports both.
Investment metrics
- 1% rule
- 0.98% ✗
- Cap rate
- 8.15%
- Cash-on-cash
- 6.62%
- DSCR
- 1.29
- GRM
- 8.5
CMA / ARV
- ARV (on-the-fly)
- $69,300
- Comps found
- 9
Show comp detail 9 sales within ~0.75 mi
| Address | Dist | Beds/Ba | Sqft | Sold | Price | $/sf | Match |
|---|---|---|---|---|---|---|---|
| 318 Brookbriar Dr | 0.09mi | 3/1.5 | 1,237 (-2%) | 4mo | $58,600 | $47 | 89 |
| 1113 Fenwick Dr | 0.03mi | 3/1.5 | 1,208 (-4%) | 3mo | $75,000 | $62 | 89 |
| 113 Brookbriar Dr | 0.19mi | 3/1.0 | 1,252 (-1%) | 5mo | $24,900 | $20 | 84 |
| 130 Mayfair Dr | 0.21mi | 3/1.5 | 1,297 (+3%) | 3mo | $75,000 | $58 | 83 |
| 418 Mayfair Dr | 0.31mi | 3/1.5 | 1,330 (+6%) | 9mo | $40,000 | $30 | 69 |
| 1121 Heatherwood Dr | 0.15mi | 3/2.0 | 1,437 (+14%) | 1mo | $126,500 | $88 | 66 |
| 401 Seneca Trl | 0.32mi | 3/2.0 | 1,327 (+5%) | 12mo | $70,000 | $53 | 65 |
| 413 Seneca Trl | 0.34mi | 3/2.5 | 1,176 (-7%) | 8mo | $64,900 | $55 | 63 |
| 1114 Dunbriar Dr | 0.08mi | 3/1.5 | 1,076 (-15%) | 15mo | $122,000 | $113 | 60 |
Match score weights: distance 35% · size 25% · config 20% · recency 20%. Top-matched comps best support the ARV.
Projected returns pro-forma
-3.0% appreciation · 3.0% rent growth · sell at horizon
- IRR
- -6.2%
- Equity multiple
- 0.77×
- Total profit
- $-7,991
- Equity at exit
- $18,638
- IRR
- 3.5%
- Equity multiple
- 1.25×
- Total profit
- $8,738
- Equity at exit
- $10,808
Cash invested: $35,000 (down + closing). Projections, not guarantees.
Landlord ↔ Tenant lean methodology
- Overall (STATE)
- 90 Strongly Landlord-Friendly
- State Louisiana
- 90 Strongly Landlord-Friendly · R+12
- County
- — inherits STATE
- City
- — inherits STATE
ZIP-level market 71107
- Home prices YoY
- -34.5%
- Active inventory
- 262
- Price-to-rent
- 8.5×
Monthly cashflow live
- Estimated rent
- $1,228 medium interval (Pro) →
- Mortgage (P&I)
- −$656
- Tax from tax record
- −$70 /mo · $837/yr
- Insurance
- −$52
- HOA
- −$0
- Vacancy / Maint / Mgmt
- −$258
- Net cashflow
- $193
Break-even live
UW: 25.0% down · 7.5% · 30yr · 1.5% tax · 5.0% vac · 8.0% maint · 8.0% mgmt
Financing live
Cash to close
- Down payment
- $31,250
- Closing costs
- $3,750
- Reserves months
- —
- Total cash needed
- —
Loan-product check · same deal, 3 products live
Conventional
25% down · 7.5% · 30yr
- Down + closing
- —
- Monthly P&I
- —
- Monthly cashflow
- —
- DSCR
- —
- Eligible?
- —
Personal DTI + credit; lowest rate.
DSCR
20% down · 8.5% · 30yr
- Down + closing
- —
- Monthly P&I
- —
- Monthly cashflow
- —
- DSCR
- —
- Eligible?
- —
No personal income docs; deal must DSCR.
Hard money
10% down · 12.0% · 12mo
- Down + closing
- —
- Monthly P&I
- —
- Monthly cashflow
- —
- DSCR
- —
- Eligible?
- —
Short-term bridge; refi at stabilization.
Rent comps 4 comps
| Address | Beds | Baths | Sqft | Rent | $/sqft | DOM | Units | Dist |
|---|---|---|---|---|---|---|---|---|
| 409 Chickasaw Trl Shreveport, LA | 2.0 | 1.5 | 1124 | $1,200 | $1.07 | 43d | 1 | 0.42mi |
| 745 Tecumseh Trl Unit 745 Shreveport, LA | 3.0 | 1.0 | 1200 | $875 | $0.73 | 43d | 1 | 0.90mi |
| 413 Montgomery St Bossier City, LA | 3.0 | 1.0 | 1152 | $1,000 | $0.87 | 13d | 1 | 1.45mi |
| 301 Edwards St Bossier City, LA | 2.0 | 1.0 | 900 | $1,175 | $1.31 | 21d | 1 | 1.48mi |
Listing history 6 events
-
2026-06-15statusdays on market $125,000 Pending 6 DOM
-
2026-06-14days on market $125,000 Active 5 DOM
-
2026-06-13days on market $125,000 Active 4 DOM
-
2026-06-10days on market $125,000 Active 2 DOM
-
2026-06-09remarks 322-char remark
-
2026-06-09$125,000 Active 1 DOM
ⓘ Source: listings_history table (triggers on properties + properties_extension) + one-shot
backfill from property_details.listing_events for pre-trigger history.
Tax reassessment forecast LA · Resets to sale price
- Current annual tax
- $837 · $70/mo
- Projected year-2 tax
- $837 · $70/mo
- Expected delta
- $0/yr ($0/mo · 0.0%)
ⓘ Screening estimate from a state-policy table — verify with the county assessor before closing.
Climate risk First Street
- Flood 3/10 Moderate FEMA zone X · 20% chance over 30 yrs
- Wildfire 1/10 Low
- Heat 7/10 Severe 7 d/yr ≥110°F today · 22 d/yr by 30 yrs out
- Wind 6/10 Major 63% chance of damaging wind over 30 yrs
- Air quality 2/10 Low 1 unhealthy d/yr today · 1 by 30 yrs out
Nearby sold comps map
Loading sold comps map…
Walkable amenities ~0.75 mi
Loading nearby amenities…
Taxation est. · year 1
- Rental income
- $14,741
- − Mortgage interest
- −$7,002
- − Property taxes
- −$837
- − Insurance
- −$625
- − Repairs & maintenance
- −$1,179
- − Management
- −$1,179
- − Depreciation
- −$3,636
- Taxable income
- $282
- Est. tax owed @ 24.0%
- −$68
- After-tax cash flow
- $2,250/yr
For passive investors: Depreciation is non-cash, so a rental often shows a tax loss while cash-flowing — sheltering income. Rental losses are passive: they offset passive income freely, and up to $25,000/yr can offset ordinary (W-2) income if you actively participate and your MAGI is under $100k (phasing out to $0 by $150k); unused losses carry forward. On sale, claimed depreciation is recaptured at up to 25%, and gains may owe capital-gains tax (a 1031 exchange can defer both). Figures are a year-1 estimate at your 24.0% rate — not tax advice; consult a CPA.
Schools (NCES district)
- District
- Caddo Parish
- NCES district ID
- 2200300
- Math proficiency
- 21% ▼ -33.00%
- Reading proficiency
- 32% ▼ -30.00%
- Median HH income
- $39,227
- Composite
- 22.23/100
- National rank
- #8148
- State rank
- #53 of 98 in LA
Livability — Shreveport
- Score
- 59/100
- State rank
- #270
- US rank
- #19730
Category grades
Schools grade is shown separately in the Schools card above.
Census & demographics
- Census place
- Shreveport, LA
- County
- Caddo Parish · 178,536 people
- City population
- 164,123
- Metro
- Shreveport-Bossier City, LA
- Population (ZIP)
- 31,734
- Household income
- $48,365
- Rent vs Own
- Severe rent burden
- 1346.0
Population outlook (Caddo County) Hauer SSP2
- Today (2025)
- 243,190 people
- By 2030
- 237,231 · -2.5%
- By 2040
- 222,502 · -8.5%
- By 2050
- 206,516 · -15.1%
- By 2075
- 165,706 · -31.9%
- By 2100
- 122,262 · -49.7%
Race, ethnicity, and origin ACS 2023
- Neighborhood character
- Diverse neighborhood (Simpson 0.55)
- Race & ethnicity
- Black 51% White 43% Two or more races 4% Hispanic / Latino 2%
- Common ancestry
- Slovak 3% Lithuanian 1%
- Foreign-born
- 1% · Canada
- Languages at home
- 98% English-only · Spanish 1%
Political lean MEDSL · Caddo
- 2024 margin
- Toss-up / Even · D 51.6% · R 47.0% · Other 1.4%
- 2008→2024 swing
- +1.6pp toward D · 2008: 3.0pp · 2024: 4.6pp
- All cycles
- 2024: D+4.6 2020: D+6.8 2016: D+4.2 2012: D+4.9 2008: D+3.0
Not yet ingested
- Civics
- —
Market trends
- HPI YoY
- ▼ -62.11%
- Current HPI
- 117.801
- Rent YoY
- —
- Metro
- Shreveport-Bossier City, LA
- State GDP YoY
- ▲ 3.29%
- F500 in state
- 10
Industry mix (Fortune 500 HQ in LA)
| Industry | F500 HQs | Revenue |
|---|---|---|
| Telecommunications | 2 | $23B |
|
||
| Utilities | 1 | $12B |
|
||
| Wholesale / Distribution | 1 | $5B |
|
||
| Advertising | 1 | $2B |
|
||
Price history
+8.7% since first listed9 events — show timeline
- 2026-06-08 Listed $125,000 NTREIS
- 2021-10-28 Sold (Public Records) $115,000 Public Records
- 2021-10-27 Sold (MLS) — NTREIS
- 2021-09-28 Pending — NTREIS
- 2021-09-25 Relisted — NTREIS
- 2021-09-11 Pending — NTREIS
- 2021-08-22 Listed $115,000 NTREIS
- 2005-08-09 Sold (Public Records) — Public Records
- 1990-11-16 Sold (Public Records) — Public Records
Property tax history
+7.4%/yrLatest (2025): $837 · +0.4% YoY. Source: county tax records.
Cash-flow waterfall
monthlySold comps — $/sqft
last 12 mo · ≤1 miLoading sold comps…