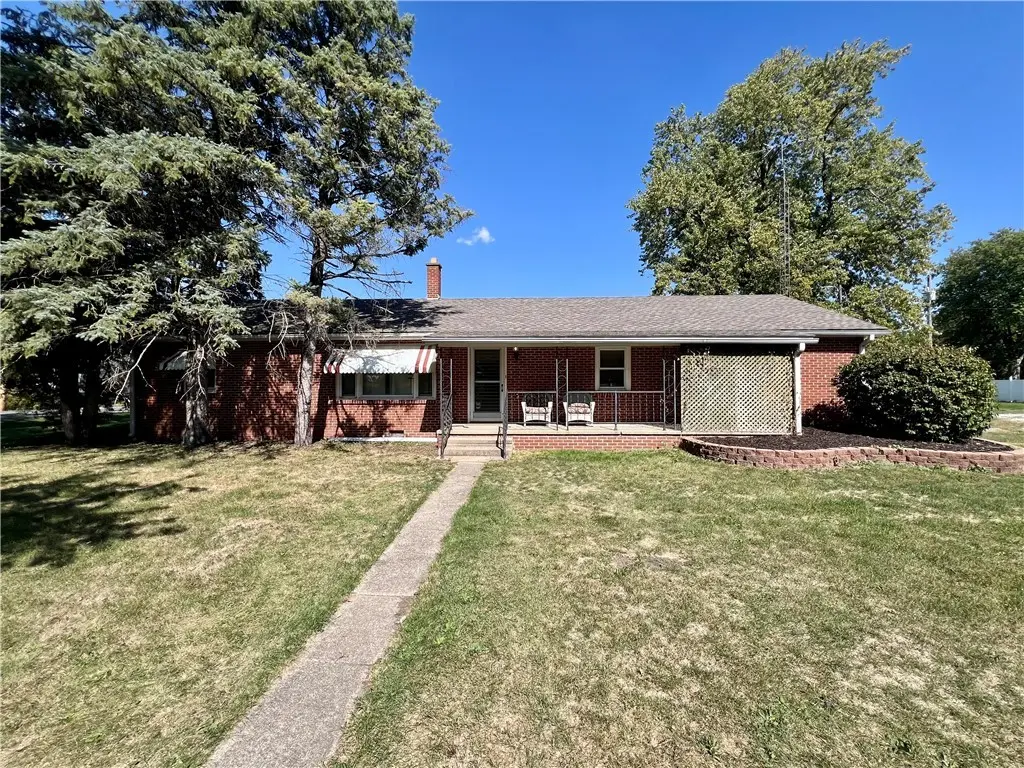
101 Lincoln St · Sidell, IL
Flood risk 4/10 · Minor
- FEMA flood zone
- X (unshaded)
- Chance of flooding over 30 yrs
- 0.22%
- Est. flood insurance / yr
- $473 – $860
Fire risk 1/10 · Minimal
- Est. fire insurance / yr
- $804 – $1,492
Heat risk 3/10 · Minor
- Hot days now (above 104°F)
- 7 days/yr
- Hot days in 30 yrs
- 18 days/yr
Wind risk 2/10 · Minimal
- Chance of severe wind over 30 yrs
- 1.0%
Air-quality risk 2/10 · Minimal
- Unhealthy air days now
- 1 days/yr
- Unhealthy air days in 30 yrs
- 2 days/yr
Risk factors via First Street. Map © Google.
Why this score? — see what drove the D grade
The composite is a weighted blend of 9 inputs, each scored 0–100. Each bar is that input's sub-score; the figure is the points it added to the 100-point composite (weight × sub-score).
- Cash flow +11.5/30.0
- ARV discount +7.5/15.0
- Schools +5.0/10.0
- 1% rule +4.1/10.0
- Appreciation +3.8/10.0
- DSCR +3.4/10.0
- Livability +3.2/5.0
- Rent growth +2.5/5.0
- Condition / age +2.5/5.0
$139,900
🖨 Deal sheet (PDF) 📄 Offer letter ✓ Due diligence
Listing remarks MLS
Welcome to this spacious 4 bedroom, 2 bath brick ranch situated on a double half acre corner lot in peaceful Sidell! Inside, you're greeted by a warm and inviting living room with beautiful hardwood floors. The heart of the home is the cozy family room featuring a fireplace, creating the ideal spot to relax. With four bedrooms, this home provides flexibility for family, guests, or a home office. The two full bathrooms offer convenience and functionality. Outside, the corner lot provides extra yard space and curb appeal, giving you room to enjoy the outdoors. Find peace of mind with a brand new roof in 2025. Whether you're looking for space to grow or a place to settle into for years to come, this home combines comfort and charm. Take a look today!
Key facts
- Brand new roof
- Extra yard space
- Cozy family room
Tags
Property features AI
Finance
- Other:
- Financial info:
- HOA & community: No master association fee required
Exterior
- Parking:
- Security:
- Utilities: Public water; Septic tank sewer
- Home design: Detached single-family home; One-story design; Fee simple ownership; Built before 1978
- Construction: Vinyl siding and brick exterior
- Exterior features: Lot roughly 66 x 165; Less than 0.25 acre lot
Interior
- Kitchen: Range; Microwave; Dishwasher; Refrigerator
- Bedrooms: Four bedrooms (all on the main level); Master bedroom on the main level with full bath
- Flooring: Hardwood flooring in portions of the home; Carpet in some bedrooms; Vinyl flooring in kitchen, family room and laundry
- Bathrooms: Two full bathrooms
- Heating & cooling: Natural gas forced-air heating; Central air conditioning
- Interior features: Seven total rooms; Main-level living spaces
- Laundry & utility: Main-level laundry room (7 x 14)
Neighborhood map
What this means for you Summary
Snapshot
- This is a 4-bed/2.0-bath other listed at $140k.
Deal economics
- At list price, monthly cash flow is $-46 ($-551/yr) — negative.
- To cash-flow at today's rent, offer at most $132k (5.8% below list).
- To meet the 1% rule (rent ≥ 1% of price), the offer needs to be $128k (8.6% below list).
- Recommended offer: $128k (8.6% below list) — sets the bar for 1% rule.
Location & tenants
- Location reads 65/100 on livability (#633 in IL) — a middle-class / working-renter tenant base. Strengths: crime A+, cost of living A+, housing A+; Watch: amenities F, commute F, health & safety F.
- Zoned schools: Salt Fork Junior High School (math 17% / reading 42%, grade F, #256 of 665 statewide, top 41%, 186 students, 0% FRL); Salt Fork High School (math 5% / reading 15%, grade F, #528 of 693 statewide, top 82%, 247 students, 0% FRL).
- Market conditions: 2 active listings in the ZIP; 8 units permitted in Vermilion County in 2024 (0 in 5+ unit buildings).
Forward outlook
- Local home prices are declining (-2.3%/yr); year-one equity from $967 of loan paydown is wiped out by about $3k of value loss. Plan a longer hold.
- Vermilion County population projected at -24% by 2050 — secular population decline; favor cash flow + early exit over multi-decade hold.
Negotiation context
- It's been on market 29 days — a 2% lower offer ($138k) is reasonable based on typical stale-listing flexibility.
- 2 sale attempts; this cycle's ask has dropped $10k (7%) from the opening price — seller is motivated, your offer sets the floor, not the list.
- Current owner paid $59k; list at $140k implies a 137% gain — meaningful room to come down on a strong offer.
Risks & watch-outs
- Watch-outs: built in 1900 — expect roof / HVAC / electrical / plumbing capex.
Questions for the listing agent
- What do current leases actually rent for vs. the listed asking? Can we see a recent rent roll and the last 12 months of T-12 income?
- Built in 1900 — when were the roof, HVAC, electrical panel, plumbing, and water heater last replaced?
- Is there a deadline driving the sale (1031 exchange, divorce, estate, relocation)? That informs how much negotiation room exists.
- Schools are F-rated, which usually means shorter tenancies and higher turnover. Who's the typical renter profile here, and what's been the actual vacancy rate?
- The area grade is low — what's the realistic commute time and amenity access for the typical tenant pool here? Any planned neighborhood developments (good or bad) we should know about?
- What's the average days-on-market for RENTAL listings here right now (not sales)? A rising rental-DOM trend means longer vacancies and softer asking-rent achievability than the comps imply.
- What's the recent tenant-quality profile in this submarket — average credit score on applications, eviction rate, late-payment / NSF rate, and stable-employment percentage? A property-management company in the area should have these aggregated.
- How much new for-sale + rental construction is in the pipeline within 1–3 miles? Heavy new supply typically softens prices + rents 12–24 months out; constrained supply supports both.
Investment metrics
- 1% rule
- 0.91% ✗
- Cap rate
- 5.90%
- Cash-on-cash
- -1.41%
- DSCR
- 0.94
- GRM
- 9.1
CMA / ARV
No comps found within radius.
Projected returns pro-forma
-2.31% appreciation · 3.0% rent growth · sell at horizon
- IRR
- -14.4%
- Equity multiple
- 0.45×
- Total profit
- $-21,470
- Equity at exit
- $25,169
- IRR
- -6.5%
- Equity multiple
- 0.52×
- Total profit
- $-18,607
- Equity at exit
- $19,631
Cash invested: $39,172 (down + closing). Projections, not guarantees.
Landlord ↔ Tenant lean methodology
- Overall (STATE)
- 43 Moderately Tenant-Leaning
- State Illinois
- 43 Moderately Tenant-Leaning · D+7
- County
- — inherits STATE
- City
- — inherits STATE
ZIP-level market 61876
- Home prices YoY
- -1.9%
- Active inventory
- 2
- Price-to-rent
- 9.1×
Monthly cashflow live
- Estimated rent
- $1,278 medium interval (Pro) →
- Mortgage (P&I)
- −$734
- Tax from tax record
- −$264 /mo · $3,164/yr
- Insurance
- −$58
- HOA
- −$0
- Vacancy / Maint / Mgmt
- −$268
- Net cashflow
- $-46
Break-even live
Sensitivity live
| Price | -10% $33 | -5% $-6 | +0% $-46 | +5% $-86 | +10% $-125 |
|---|---|---|---|---|---|
| Rent | -10% $-147 | -5% $-96 | +0% $-46 | +5% $5 | +10% $55 |
| Rate | -1.0pp $25 | -0.5pp $-10 | base $-46 | +0.5pp $-82 | +1.0pp $-119 |
UW: 25.0% down · 7.5% · 30yr · 1.5% tax · 5.0% vac · 8.0% maint · 8.0% mgmt
Financing live
Cash to close
- Down payment
- $34,975
- Closing costs
- $4,197
- Reserves months
- —
- Total cash needed
- —
Loan-product check · same deal, 3 products live
Conventional
25% down · 7.5% · 30yr
- Down + closing
- —
- Monthly P&I
- —
- Monthly cashflow
- —
- DSCR
- —
- Eligible?
- —
Personal DTI + credit; lowest rate.
DSCR
20% down · 8.5% · 30yr
- Down + closing
- —
- Monthly P&I
- —
- Monthly cashflow
- —
- DSCR
- —
- Eligible?
- —
No personal income docs; deal must DSCR.
Hard money
10% down · 12.0% · 12mo
- Down + closing
- —
- Monthly P&I
- —
- Monthly cashflow
- —
- DSCR
- —
- Eligible?
- —
Short-term bridge; refi at stabilization.
Listing history 22 events
-
2026-06-19days on market $139,900 Active 29 DOM
-
2026-06-18days on market $139,900 Active 28 DOM
-
2026-06-17days on market $139,900 Active 27 DOM
-
2026-06-16days on market $139,900 Active 26 DOM
-
2026-06-15days on market $139,900 Active 25 DOM
-
2026-06-14days on market $139,900 Active 254 DOM
-
2026-06-12days on market $139,900 Active 253 DOM
-
2026-06-09days on market $139,900 Active 250 DOM
-
2026-06-08days on market $139,900 Active 249 DOM
-
2026-06-07days on market $139,900 Active 248 DOM
-
2026-06-03days on market $139,900 Active 244 DOM
-
2026-06-02days on market $139,900 Active 243 DOM
-
2026-06-01days on market $139,900 Active 242 DOM
-
2026-05-31days on market $139,900 Active 241 DOM
-
2026-05-30days on market $139,900 Active 240 DOM
-
2026-05-21$149,900 Active 757-char remark
Show marketing remark (757 chars)
Welcome to this spacious 4 bedroom, 2 bath brick ranch situated on a double half acre corner lot in peaceful Sidell! Inside, you're greeted by a warm and inviting living room with beautiful hardwood floors. The heart of the home is the cozy family room featuring a fireplace, creating the ideal spot to relax. With four bedrooms, this home provides flexibility for family, guests, or a home office. The two full bathrooms offer convenience and functionality. Outside, the corner lot provides extra yard space and curb appeal, giving you room to enjoy the outdoors. Find peace of mind with a brand new roof in 2025. Whether you're looking for space to grow or a place to settle into for years to come, this home combines comfort and charm. Take a look today!
-
2026-03-26price $149,900
-
2026-01-07price $154,900
-
2025-12-09price $159,900
-
2025-10-22price $164,900
-
2025-10-02$169,900 Active
-
2002-11-28soldstatus $59,000
ⓘ Source: listings_history table (triggers on properties + properties_extension) + one-shot
backfill from property_details.listing_events for pre-trigger history.
Tax reassessment forecast IL · Partial reset (capped growth)
- Current annual tax
- $3,164 · $264/mo
- Projected year-2 tax
- $3,170 · $264/mo
- Expected delta
- +$6/yr ($0/mo · 0.2%)
ⓘ Screening estimate from a state-policy table — verify with the county assessor before closing.
Climate risk First Street
- Flood 4/10 Moderate FEMA zone X (unshaded) · 22% chance over 30 yrs
- Wildfire 1/10 Low
- Heat 3/10 Moderate 7 d/yr ≥104°F today · 18 d/yr by 30 yrs out
- Wind 2/10 Low 100% chance of damaging wind over 30 yrs
- Air quality 2/10 Low 1 unhealthy d/yr today · 2 by 30 yrs out
Nearby sold comps map
Loading sold comps map…
Walkable amenities ~0.75 mi
Loading nearby amenities…
Taxation est. · year 1
- Rental income
- $15,337
- − Mortgage interest
- −$7,837
- − Property taxes
- −$3,164
- − Insurance
- −$700
- − Repairs & maintenance
- −$1,227
- − Management
- −$1,227
- − Depreciation
- −$4,070
- Taxable loss
- −$2,887
- Est. tax savings @ 24.0%
- +$693
- After-tax cash flow
- $142/yr
For passive investors: Depreciation is non-cash, so a rental often shows a tax loss while cash-flowing — sheltering income. Rental losses are passive: they offset passive income freely, and up to $25,000/yr can offset ordinary (W-2) income if you actively participate and your MAGI is under $100k (phasing out to $0 by $150k); unused losses carry forward. On sale, claimed depreciation is recaptured at up to 25%, and gains may owe capital-gains tax (a 1031 exchange can defer both). Figures are a year-1 estimate at your 24.0% rate — not tax advice; consult a CPA.
Schools (NCES district)
No district data.
Livability — Sidell
- Score
- 65/100
- State rank
- #633
- US rank
- #12947
Category grades
Schools grade is shown separately in the Schools card above.
Census & demographics
- Census place
- Sidell, IL
- Population (ZIP)
- 823
Population outlook (Vermilion County) Hauer SSP2
- Today (2025)
- 72,775 people
- By 2030
- 69,235 · -4.9%
- By 2040
- 62,360 · -14.3%
- By 2050
- 55,539 · -23.7%
- By 2075
- 40,606 · -44.2%
- By 2100
- 26,985 · -62.9%
Race, ethnicity, and origin ACS 2023
- Neighborhood character
- Predominantly White (99%)
- Race & ethnicity
- White 99%
- Common ancestry
- Lithuanian 1%
- Foreign-born
- 2% · South Korea
- Languages at home
- 98% English-only · German/W. Germanic 1% Korean 1%
Political lean MEDSL · Vermilion
- 2024 margin
- Solid R (+35.7) · D 31.4% · R 67.0% · Other 1.6%
- 2008→2024 swing
- -36.2pp toward R · 2008: 0.6pp · 2024: -35.7pp
- All cycles
- 2024: R+35.7 2020: R+32.9 2016: R+29.2 2012: R+15.7 2008: D+0.6
Not yet ingested
- Civics
- —
Market trends
- HPI YoY
- ▼ -2.31%
- Current HPI
- 116.1097
- Rent YoY
- —
- Metro
- —
- State GDP YoY
- ▲ 1.59%
- F500 in state
- 60
Industry mix (Fortune 500 HQ in IL)
| Industry | F500 HQs | Revenue |
|---|---|---|
| Insurance | 4 | $201B |
|
||
| Consumer Goods | 4 | $87B |
|
||
| Industrial Machinery | 3 | $64B |
|
||
| Healthcare | 2 | $55B |
|
||
| Retail / Pharmacy | 1 | $148B |
|
||
| Agriculture / Food | 1 | $86B |
|
||
Price history
+154.1% since first listed7 events — show timeline
- 2026-05-21 Listed $149,900 CIBR
- 2026-03-26 Price Changed $149,900 MRED as Distributed by MLS Grid
- 2026-01-07 Price Changed $154,900 MRED as Distributed by MLS Grid
- 2025-12-09 Price Changed $159,900 MRED as Distributed by MLS Grid
- 2025-10-22 Price Changed $164,900 MRED as Distributed by MLS Grid
- 2025-10-02 Listed $169,900 MRED as Distributed by MLS Grid
- 2002-11-28 Sold (Public Records) $59,000 Public Records
Property tax history
+5.3%/yrLatest (2024): $3,164 · +0.4% YoY. Source: county tax records.
Cash-flow waterfall
monthlySold comps — $/sqft
last 12 mo · ≤1 miLoading sold comps…