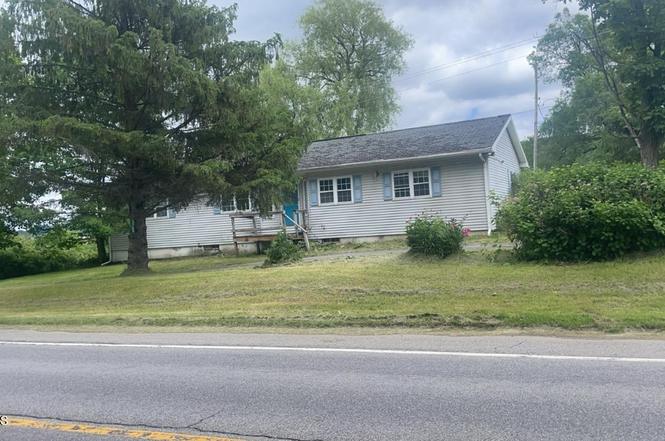
3798 Ny-166 · Cherry Valley, NY
Flood risk 1/10 · Minimal
- FEMA flood zone
- X (unshaded)
- Chance of flooding over 30 yrs
- 0.0%
- Est. flood insurance / yr
- $473 – $860
Fire risk 3/10 · Minor
- Est. fire insurance / yr
- $691 – $1,283
Heat risk 1/10 · Minimal
- Hot days now (above 88°F)
- 8 days/yr
- Hot days in 30 yrs
- 18 days/yr
Wind risk 2/10 · Minimal
- Chance of severe wind over 30 yrs
- 1.0%
Air-quality risk 1/10 · Minimal
- Unhealthy air days now
- 0 days/yr
- Unhealthy air days in 30 yrs
- 0 days/yr
Risk factors via First Street. Map © Google.
Why this score? — see what drove the B+ grade
The composite is a weighted blend of 9 inputs, each scored 0–100. Each bar is that input's sub-score; the figure is the points it added to the 100-point composite (weight × sub-score).
- Cash flow +30.0/30.0
- 1% rule +10.0/10.0
- DSCR +10.0/10.0
- Appreciation +10.0/10.0
- ARV discount +7.5/15.0
- Schools +4.1/10.0
- Livability +3.0/5.0
- Rent growth +2.5/5.0
- Condition / age +2.5/5.0
$75,000
🖨 Deal sheet (PDF) 📄 Offer letter ✓ Due diligence
Listing remarks MLS
Well-maintained 3 bedroom, 2 bath home on 1.13 acres. Living room, dining room, den, eat-in kitchen, laundry room and bedrooms all on 1 convenient floor. Central air conditioning, full basement w/ large workshop. Refrigerator, washer & dryer only 2 years old. Private backyard for outdoor enjoyment. Great year-round living or easy to care for vacation home. Just outside of the village of Cherry Valley with ease access to Cooperstown, Oneonta and Albany.
Key facts
- 1.13 acre lot
- 4 parking spots
- Built 1974
Property features AI
Exterior
- Parking: Driveway with space for 4 vehicles
- Utilities: Septic tank
- Home design: Single-family residence; Fixer condition; Living area approximately 1,440
- Construction: Vinyl siding; Asphalt roof
- Exterior features: Deck; Paved driveway; Garden; Outdoor lighting; Level lot
Interior
- Kitchen: Range hood; Refrigerator
- Bedrooms: Primary bedroom on the first floor; Two additional bedrooms on the first floor
- Bathrooms: Two full bathrooms on the first floor
- Heating & cooling: Forced air heating; Kerosene heating; Propane heating; Central air conditioning
- Interior features: Built-in features; Full basement
- Laundry & utility: Dedicated laundry room
Neighborhood map
What this means for you Summary
Snapshot
- This is a 3-bed/2.0-bath manufactured listed at $75k.
Deal economics
- At list price, monthly cash flow is $467 ($6k/yr) — positive.
- The deal already cash-flows at list — no discount required.
- Meets the 1% rule at list price ($1k rent vs $75k).
Location & tenants
- Location reads 60/100 on livability (#990 in NY) — a middle-class / working-renter tenant base. Strengths: housing A+, cost of living B+; Watch: schools C-, health & safety C-, employment D.
- Cherry Valley-Springfield Central School District (rural): math 45% / reading 45% proficiency, ranked #564 of 755 in NY (top 75%) — families likely to look elsewhere, expect single-tenant / working-renter base with shorter leases.
- Market conditions: 17 active listings in the ZIP; 133 units permitted in Otsego County in 2024 (10 in 5+ unit buildings).
Forward outlook
- In year one you build about $8k of equity ($519 loan paydown + $8k appreciation (10.0% local appreciation)).
- Otsego County population projected at -21% by 2050 — secular population decline; favor cash flow + early exit over multi-decade hold.
- At projected returns (10.0% appreciation + 3.0% rent growth), your $21k cash investment doubles in ~2 years — after that, you're playing with house money.
- By year 5, paydown + projected appreciation supports a ~$37k cash-out refi (75% LTV) — recoverable capital for the next deal without selling this one.
Negotiation context
- Only 2 days on market — expect competitive offers; lowballing is unlikely to land.
- 5 sale attempts since 15y ago with the ask held roughly flat each time — persistent listings suggest the price (not the market) is what's stuck; bring a comps-based counter.
- Current owner paid $60k; 25% above their basis — modest negotiation headroom, anchor on the comps not their cost.
Risks & watch-outs
- Watch-outs: property tax is 2.8% of price.
Questions for the listing agent
- Built in 1974 — when were the roof, HVAC, electrical panel, plumbing, and water heater last replaced?
- Property tax is high relative to price — has the assessment been appealed recently, and will the sale trigger a re-assessment?
- Is there a deadline driving the sale (1031 exchange, divorce, estate, relocation)? That informs how much negotiation room exists.
- Crime grade is F in this area — have there been break-ins, vandalism, or insurance claims at this property in the last 3 years? What carrier currently insures it and at what premium?
- What's the average days-on-market for RENTAL listings here right now (not sales)? A rising rental-DOM trend means longer vacancies and softer asking-rent achievability than the comps imply.
- What's the recent tenant-quality profile in this submarket — average credit score on applications, eviction rate, late-payment / NSF rate, and stable-employment percentage? A property-management company in the area should have these aggregated.
- How much new for-sale + rental construction is in the pipeline within 1–3 miles? Heavy new supply typically softens prices + rents 12–24 months out; constrained supply supports both.
Investment metrics
- 1% rule
- 1.80% ✓
- Cap rate
- 13.77%
- Cash-on-cash
- 26.70%
- DSCR
- 2.19
- GRM
- 4.6
CMA / ARV
No comps found within radius.
Projected returns pro-forma
10.0% appreciation · 3.0% rent growth · sell at horizon
- IRR
- 44.5%
- Equity multiple
- 4.37×
- Total profit
- $70,673
- Equity at exit
- $67,566
- IRR
- 38.5%
- Equity multiple
- 9.80×
- Total profit
- $184,854
- Equity at exit
- $145,709
Cash invested: $21,000 (down + closing). Projections, not guarantees.
Landlord ↔ Tenant lean methodology
- Overall (STATE)
- 15 Strongly Tenant-Friendly
- State New York
- 15 Strongly Tenant-Friendly · D+10
- County
- — inherits STATE
- City
- — inherits STATE
ZIP-level market 13320
- Home prices YoY
- 2.4%
- Active inventory
- 17
- Price-to-rent
- 4.6×
Monthly cashflow live
- Estimated rent
- $1,346 medium interval (Pro) →
- Mortgage (P&I)
- −$393
- Tax from tax record
- −$172 /mo · $2,063/yr
- Insurance
- −$31
- HOA
- −$0
- Vacancy / Maint / Mgmt
- −$283
- Net cashflow
- $467
Break-even live
Sensitivity live
| Price | -10% $510 | -5% $488 | +0% $467 | +5% $446 | +10% $425 |
|---|---|---|---|---|---|
| Rent | -10% $361 | -5% $414 | +0% $467 | +5% $520 | +10% $574 |
| Rate | -1.0pp $505 | -0.5pp $486 | base $467 | +0.5pp $448 | +1.0pp $428 |
UW: 25.0% down · 7.5% · 30yr · 1.5% tax · 5.0% vac · 8.0% maint · 8.0% mgmt
Financing live
Cash to close
- Down payment
- $18,750
- Closing costs
- $2,250
- Reserves months
- —
- Total cash needed
- —
Loan-product check · same deal, 3 products live
Conventional
25% down · 7.5% · 30yr
- Down + closing
- —
- Monthly P&I
- —
- Monthly cashflow
- —
- DSCR
- —
- Eligible?
- —
Personal DTI + credit; lowest rate.
DSCR
20% down · 8.5% · 30yr
- Down + closing
- —
- Monthly P&I
- —
- Monthly cashflow
- —
- DSCR
- —
- Eligible?
- —
No personal income docs; deal must DSCR.
Hard money
10% down · 12.0% · 12mo
- Down + closing
- —
- Monthly P&I
- —
- Monthly cashflow
- —
- DSCR
- —
- Eligible?
- —
Short-term bridge; refi at stabilization.
Listing history 3 events
-
2026-06-21statusdays on market $75,000 Pending 2 DOM
-
2026-06-17remarks 324-char remark
-
2026-06-17$75,000 Active 1 DOM
ⓘ Source: listings_history table (triggers on properties + properties_extension) + one-shot
backfill from property_details.listing_events for pre-trigger history.
Tax reassessment forecast NY · Partial reset (capped growth)
- Current annual tax
- $2,063 · $172/mo
- Projected year-2 tax
- $2,063 · $172/mo
- Expected delta
- $0/yr ($0/mo · 0.0%)
ⓘ Screening estimate from a state-policy table — verify with the county assessor before closing.
Climate risk First Street
- Flood 1/10 Low FEMA zone X (unshaded) · 0% chance over 30 yrs
- Wildfire 3/10 Moderate
- Heat 1/10 Low 8 d/yr ≥88°F today · 18 d/yr by 30 yrs out
- Wind 2/10 Low 100% chance of damaging wind over 30 yrs
- Air quality 1/10 Low 0 unhealthy d/yr today · 0 by 30 yrs out
Nearby sold comps map
Loading sold comps map…
Walkable amenities ~0.75 mi
Loading nearby amenities…
Taxation est. · year 1
- Rental income
- $16,157
- − Mortgage interest
- −$4,201
- − Property taxes
- −$2,063
- − Insurance
- −$375
- − Repairs & maintenance
- −$1,293
- − Management
- −$1,293
- − Depreciation
- −$2,182
- Taxable income
- $4,751
- Est. tax owed @ 24.0%
- −$1,140
- After-tax cash flow
- $4,466/yr
For passive investors: Depreciation is non-cash, so a rental often shows a tax loss while cash-flowing — sheltering income. Rental losses are passive: they offset passive income freely, and up to $25,000/yr can offset ordinary (W-2) income if you actively participate and your MAGI is under $100k (phasing out to $0 by $150k); unused losses carry forward. On sale, claimed depreciation is recaptured at up to 25%, and gains may owe capital-gains tax (a 1031 exchange can defer both). Figures are a year-1 estimate at your 24.0% rate — not tax advice; consult a CPA.
Schools (NCES district)
- District
- Cherry Valley-Springfield Central School District
- NCES district ID
- 3600006
- Math proficiency
- 45% ▲ 5.00%
- Reading proficiency
- 45% ▲ 10.00%
- Median HH income
- $49,619
- Composite
- 40.82/100
- National rank
- #7553
- State rank
- #564 of 755 in NY
Livability — Cherry Valley
- Score
- 60/100
- State rank
- #990
- US rank
- #19371
Category grades
Schools grade is shown separately in the Schools card above.
Census & demographics
- Population (ZIP)
- 2,027
Population outlook (Otsego County) Hauer SSP2
- Today (2025)
- 57,987 people
- By 2030
- 55,403 · -4.5%
- By 2040
- 50,336 · -13.2%
- By 2050
- 45,715 · -21.2%
- By 2075
- 38,769 · -33.1%
- By 2100
- 33,468 · -42.3%
Race, ethnicity, and origin ACS 2023
- Neighborhood character
- Predominantly White (96%)
- Race & ethnicity
- White 96% Two or more races 2% Hispanic / Latino 2%
- Common ancestry
- Iranian 8% Romanian 4% Italian 4%
- Foreign-born
- 3% · Canada, Jamaica
- Languages at home
- 93% English-only · German/W. Germanic 5% Spanish 1%
Political lean MEDSL · Otsego
- 2024 margin
- Lean R (+7.9) · D 46.1% · R 53.9%
- 2008→2024 swing
- -13.8pp toward R · 2008: 5.9pp · 2024: -7.9pp
- All cycles
- 2024: R+7.9 2020: R+5.0 2016: R+13.0 2012: D+2.0 2008: D+5.9
Not yet ingested
- Civics
- —
Market trends
- HPI YoY
- ▲ 10.81%
- Current HPI
- 462.6521
- Rent YoY
- —
- Metro
- —
- State GDP YoY
- ▲ 2.60%
- F500 in state
- 92
Industry mix (Fortune 500 HQ in NY)
| Industry | F500 HQs | Revenue |
|---|---|---|
| Financial Services | 10 | $950B |
|
||
| Consumer Goods | 9 | $162B |
|
||
| Insurance | 4 | $225B |
|
||
| Telecommunications | 2 | $144B |
|
||
| Pharmaceuticals | 2 | $112B |
|
||
| Media / Entertainment | 2 | $69B |
|
||
Price history
+10.3% since first listed11 events — show timeline
- 2026-06-16 Listed $75,000 Global MLS
- 2014-07-29 Sold (Public Records) $60,000 Public Records
- 2014-07-03 Sold (MLS) $60,000 UNYREIS
- 2014-06-03 Sold (MLS) $60,000 Global MLS
- 2014-01-30 Listed $75,000 Global MLS
- 2014-01-30 Listed $75,000 UNYREIS
- 2011-10-17 Sold (Public Records) $50,000 Public Records
- 2011-10-08 Sold (MLS) $50,000 UNYREIS
- 2011-09-30 Sold (MLS) $50,000 Global MLS
- 2011-07-02 Listed $68,000 Global MLS
- 2011-07-02 Listed $68,000 UNYREIS
Property tax history
+9.3%/yrLatest (2025): $2,063 · -10.2% YoY. Source: county tax records.
Cash-flow waterfall
monthlySold comps — $/sqft
last 12 mo · ≤1 miLoading sold comps…