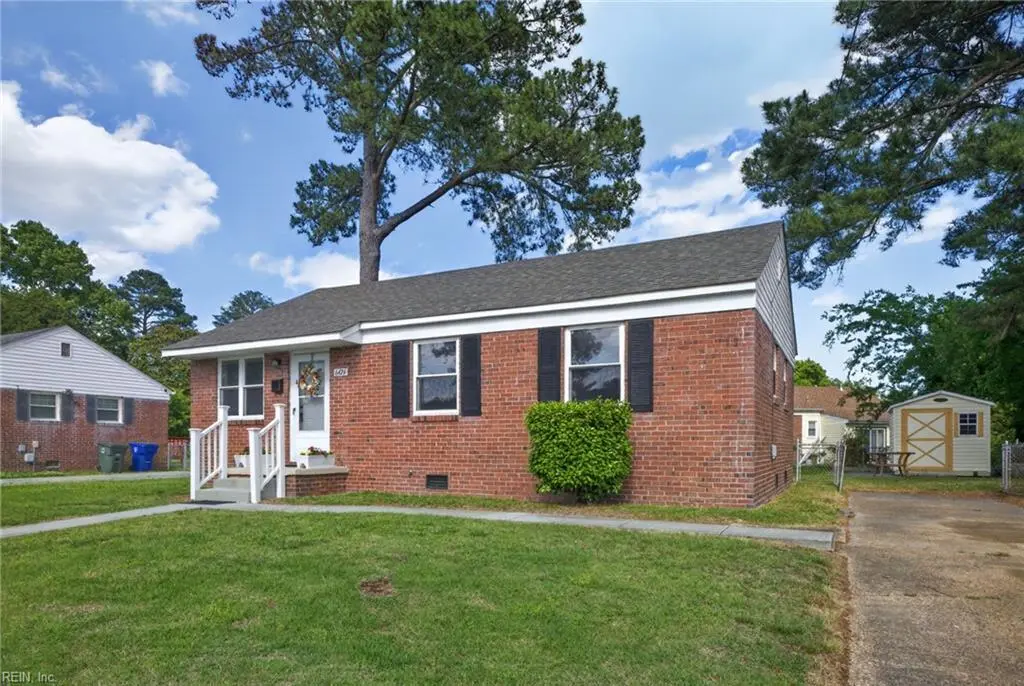
6424 Tappahannock Dr · Norfolk, VA
Flood risk 4/10 · Minor
- FEMA flood zone
- X (shaded)
- Chance of flooding over 30 yrs
- 0.21%
- Est. flood insurance / yr
- $507 – $1,088
Fire risk 1/10 · Minimal
- Est. fire insurance / yr
- $666 – $1,236
Heat risk 9/10 · Severe
- Hot days now (above 105°F)
- 7 days/yr
- Hot days in 30 yrs
- 16 days/yr
Wind risk 8/10 · Major
- Chance of severe wind over 30 yrs
- 80.0%
Air-quality risk 3/10 · Minor
- Unhealthy air days now
- 2 days/yr
- Unhealthy air days in 30 yrs
- 5 days/yr
Risk factors via First Street. Map © Google.
Why this score? — see what drove the D grade
The composite is a weighted blend of 9 inputs, each scored 0–100. Each bar is that input's sub-score; the figure is the points it added to the 100-point composite (weight × sub-score).
- ARV discount +9.6/15.0
- Cash flow +8.4/30.0
- Rent growth +5.0/5.0
- Livability +4.2/5.0
- Schools +3.5/10.0
- Appreciation +2.9/10.0
- Condition / age +2.5/5.0
- DSCR +2.3/10.0
- 1% rule +2.1/10.0
$251,200
🖨 Deal sheet 📄 Offer letter ✓ Due diligence
Listing remarks
Welcome to this well-maintained 3-bedroom, 1 bath brick ranch in Roland Park. This one-level home features new paint and LVP flooring throughout, plus updated granite kitchen countertops. Nice, fenced backyard offers space to relax or entertain, and a playground at end of street adds to the neighborhood charm. It is conveniently located minutes from shopping, beaches, Lafayette Branch Library, Norfolk International Airport, Norfolk Naval Base, Naval Air Station Norfolk, Interstate 64 and the Hampton Roads Bridge Tunnel Project. Virtual Staging so you can envision the possibilities!Shore Investments LLC has 3 members: Richard Kelly Jr, Karen Shanley and Jean Rogers. Jean Rogers is the Broker
Key facts
- New paint
- Lvp flooring
- Fenced backyard
Tags
Property features AI
Finance
- HOA & community: No HOA
Exterior
- Parking: Off-street parking; Driveway parking spaces
- Utilities: City/County water; City/County sewer; Gas water heater
- Home design: Detached single-family home; Ranch style; One story; One living level; Simple ownership
- Construction: Brick siding; Asphalt shingle roof; Crawl foundation
- Exterior features: Patio; Back chain link fence; Storage shed
Interior
- Kitchen: Electric range; Refrigerator
- Bedrooms: Master bedroom; Additional bedroom; Bedroom and full bathroom on the first floor
- Flooring: Laminate
- Bathrooms: One full bathroom
- Heating & cooling: Natural gas heating; Central air conditioning
- Interior features: Laminate flooring; Attic; Patio access from the home
- Laundry & utility: Washer hookup; Dryer hookup; Utility room
Neighborhood map
What this means for you Summary
Snapshot
- This is a 3-bed/1.0-bath single-family listed at $251k.
Deal economics
- At list price, monthly cash flow is $-225 ($-3k/yr) — negative.
- To cash-flow at today's rent, offer at most $211k (15.8% below list).
- To meet the 1% rule (rent ≥ 1% of price), the offer needs to be $178k (29.0% below list).
- Recommended offer: $178k (29.0% below list) — sets the bar for 1% rule.
- Cap rate 5.2% vs local median 4.0% in Norfolk — top-decile yield for the area; either an underpriced asset or a hidden risk that comps aren't pricing in. Stress-test before assuming the spread holds.
Location & tenants
- Location reads 83/100 on livability (#43 in VA, #1,026 nationally) — a professional / high-income tenant draw. Strengths: amenities A+, commute A+, health & safety A+; Watch: employment C-, crime F.
- Norfolk City Public School District (urban): math 27% / reading 56% proficiency, ranked #118 of 131 in VA (top 90%) — families likely to look elsewhere, expect single-tenant / working-renter base with shorter leases.
- Zoned schools: Willard Elementary (math 27% / reading 52%, grade F, #900 of 1,108 statewide, top 83%, 506 students, 98% FRL); Matthew Fontaine Maury High (math 46% / reading 90%, grade B, #180 of 319 statewide, top 57%, 1,697 students, 96% FRL) — zoned schools average 97% FRL vs 59% district-wide (38 pts higher); higher-poverty schools than district average — tighter screening recommended.
- Zoned-school proficiency averages 54% at this address vs 42% district-wide (+12 pts) — the actual schools serving this property are materially stronger than the Norfolk City Public School District average implies; a family-tenant draw the district grade alone would hide.
- Market conditions: Rents rising fast (+14.0%/yr); 77 active listings in the ZIP; 40 comparable units currently listed for rent nearby; rentals at typical pace (median 21d on market — plan ~3-4 weeks tenant-placement turnaround); 438 units permitted in Norfolk city in 2024 (273 in 5+ unit buildings).
Forward outlook
- Local home prices are declining (-3.0%/yr); year-one equity from $2k of loan paydown is wiped out by about $8k of value loss. Plan a longer hold.
Negotiation context
- Only 6 days on market — expect competitive offers; lowballing is unlikely to land.
Risks & watch-outs
- Watch-outs: built in 1952 — expect roof / HVAC / electrical / plumbing capex.
- Climate carrying-cost: severe wind risk, 80% chance of damaging wind over 30y; extreme-heat days projected 7→16/yr by 2055 (HVAC capex compounding) — expect insurance premiums to compound above CPI over the hold.
Questions for the listing agent
- What do current leases actually rent for vs. the listed asking? Can we see a recent rent roll and the last 12 months of T-12 income?
- Built in 1952 — when were the roof, HVAC, electrical panel, plumbing, and water heater last replaced?
- Is there a deadline driving the sale (1031 exchange, divorce, estate, relocation)? That informs how much negotiation room exists.
- Schools are A-rated — typically a magnet for longer-tenancy family renters. What's the average tenant stay here, and is there a school-zone premium baked into asking?
- Crime grade is F in this area — have there been break-ins, vandalism, or insurance claims at this property in the last 3 years? What carrier currently insures it and at what premium?
- The area grade is low — what's the realistic commute time and amenity access for the typical tenant pool here? Any planned neighborhood developments (good or bad) we should know about?
- What's the average days-on-market for RENTAL listings here right now (not sales)? A rising rental-DOM trend means longer vacancies and softer asking-rent achievability than the comps imply.
- What's the recent tenant-quality profile in this submarket — average credit score on applications, eviction rate, late-payment / NSF rate, and stable-employment percentage? A property-management company in the area should have these aggregated.
- How much new for-sale + rental construction is in the pipeline within 1–3 miles? Heavy new supply typically softens prices + rents 12–24 months out; constrained supply supports both.
Investment metrics
- 1% rule
- 0.71% ✗
- Cap rate
- 5.22%
- Cash-on-cash
- -3.84%
- DSCR
- 0.83
- GRM
- 11.7
CMA / ARV
- ARV (median comp)
- $263,422
- List price
- $251,200
- Delta
- -4.64%
- Verdict
- FAIR
- Comps
- 20 within 1.0 mi
Show comp detail 12 sales within ~0.75 mi
| Address | Dist | Beds/Ba | Sqft | Sold | Price | $/sf | Match |
|---|---|---|---|---|---|---|---|
| 6424 Tappahannock Dr | 0.00mi | 3/1.0 | 967 (0%) | 0mo | $251,200 | $260 | 100 |
| 610 Muskogee Ave | 0.09mi | 3/1.0 | 967 (0%) | 7mo | $250,000 | $259 | 90 |
| 6428 Garland Cir | 0.19mi | 3/1.0 | 967 (0%) | 3mo | $260,000 | $269 | 89 |
| 561 Garren Ave | 0.08mi | 3/1.0 | 987 (+2%) | 8mo | $265,000 | $268 | 86 |
| 6449 Tappahannock Dr | 0.08mi | 3/2.0 | 967 (0%) | 9mo | $260,000 | $269 | 85 |
| 606 Muskogee Ave | 0.07mi | 3/1.0 | 1,000 (+3%) | 9mo | $270,000 | $270 | 83 |
| 6317 Sangamon Ave | 0.17mi | 3/1.0 | 924 (-4%) | 3mo | $257,000 | $278 | 82 |
| 628 Summers Dr | 0.11mi | 3/1.5 | 1,011 (+5%) | 9mo | $260,000 | $257 | 77 |
| 6508 Eva Cir | 0.12mi | 3/1.0 | 1,083 (+12%) | 7mo | $275,000 | $254 | 69 |
| 6250 Tappahannock Dr | 0.24mi | 3/1.0 | 1,100 (+14%) | 1mo | $280,000 | $255 | 66 |
| 228 Forsythe St | 0.75mi | 3/1.0 | 934 (-3%) | 0mo | $175,000 | $187 | 59 |
| 6210 Sunshine Ave | 0.49mi | 4/1.0 (+1) | 1,050 (+9%) | 8mo | $240,000 | $229 | 51 |
Match score weights: distance 35% · size 25% · config 20% · recency 20%. Top-matched comps best support the ARV.
Projected returns pro-forma
-3.0% appreciation · 8.0% rent growth · sell at horizon
- IRR
- -17.7%
- Equity multiple
- 0.35×
- Total profit
- $-45,658
- Equity at exit
- $37,455
- IRR
- -2.7%
- Equity multiple
- 0.78×
- Total profit
- $-15,469
- Equity at exit
- $21,719
Cash invested: $70,336 (down + closing). Projections, not guarantees.
Landlord ↔ Tenant lean methodology
- Overall (STATE)
- 55 Moderately Landlord-Leaning
- State Virginia
- 55 Moderately Landlord-Leaning · D+2
- County
- — inherits STATE
- City
- — inherits STATE
ZIP-level market 23509
- Home prices YoY
- -1.3%
- Rents YoY
- 14.0%
- Active inventory
- 77
- Price-to-rent
- 11.7×
Monthly cashflow live
- Estimated rent
- $1,784 high interval (Pro) →
- Mortgage (P&I)
- −$1,317
- Tax from tax record
- −$212 /mo · $2,547/yr
- Insurance
- −$105
- HOA
- −$0
- Vacancy / Maint / Mgmt
- −$375
- Net cashflow
- $-225
Break-even live
UW: 25.0% down · 7.5% · 30yr · 1.5% tax · 5.0% vac · 8.0% maint · 8.0% mgmt
Financing live
Cash to close
- Down payment
- $62,800
- Closing costs
- $7,536
- Reserves months
- —
- Total cash needed
- —
Loan-product check · same deal, 3 products live
Conventional
25% down · 7.5% · 30yr
- Down + closing
- —
- Monthly P&I
- —
- Monthly cashflow
- —
- DSCR
- —
- Eligible?
- —
Personal DTI + credit; lowest rate.
DSCR
20% down · 8.5% · 30yr
- Down + closing
- —
- Monthly P&I
- —
- Monthly cashflow
- —
- DSCR
- —
- Eligible?
- —
No personal income docs; deal must DSCR.
Hard money
10% down · 12.0% · 12mo
- Down + closing
- —
- Monthly P&I
- —
- Monthly cashflow
- —
- DSCR
- —
- Eligible?
- —
Short-term bridge; refi at stabilization.
Rent comps 40 comps
| Address | Beds | Baths | Sqft | Rent | $/sqft | DOM | Units | Dist |
|---|---|---|---|---|---|---|---|---|
| 609 Summers Dr Norfolk, VA | 3.0 | 1.0 | 998 | $1,995 | $2.00 | 3d | 1 | 0.04mi |
| 739 Waukesha Ave Norfolk, VA | 2.0 | 1.0 | 860 | $1,800 | $2.09 | 23d | 1 | 0.38mi |
| 6115 Tidewater Dr Norfolk, VA | 1.0–2.0 | 1.0–2.0 | 956 | $2,274 | $2.38 | 1d | 8 | 0.47mi |
| 837 Tifton St Norfolk, VA | 3.0 | 2.0 | 1072 | $2,300 | $2.15 | 23d | 1 | 0.66mi |
| 715 Easy St Unit 2 Norfolk, VA | 2.0 | 1.0 | 750 | $1,200 | $1.60 | 14d | 1 | 0.78mi |
| 7427 Tyndale Ct Unit 1 Norfolk, VA | 2.0 | 1.0 | 786 | $995 | $1.27 | 43d | 1 | 0.81mi |
| 7433 Fenner St Norfolk, VA | 1.0–2.0 | 1.0 | 715 | $1,399 | $1.96 | 14d | 7 | 0.82mi |
| 7465 Fenner St Unit 7468-2-A8 Norfolk, VA | 2.0 | 1.0 | 900 | $1,399 | $1.55 | 20d | 1 | 0.92mi |
| 3872 Wake Cir Unit A Norfolk, VA | 2.0 | 1.0 | 750 | $1,395 | $1.86 | 2d | 1 | 0.92mi |
| 3872 Wake Cir Unit A Norfolk, VA | 2.0 | 1.0 | 750 | $1,395 | $1.86 | 43d | 1 | 0.92mi |
| 7474 Pennington Rd Unit 7474 Norfolk, VA | 2.0 | 1.0 | 1000 | $1,525 | $1.52 | 1d | 1 | 0.93mi |
| 5404 Douglas St Norfolk, VA | 3.0 | 1.0 | 981 | $1,950 | $1.99 | 43d | 1 | 0.94mi |
| 310 Naval Base Rd Norfolk, VA | 3.0 | 1.0 | 1000 | $1,850 | $1.85 | 23d | 1 | 1.03mi |
| 7108 Gregory Dr Norfolk, VA | 2.0 | 1.0 | 720 | $1,400 | $1.94 | 43d | 1 | 1.08mi |
| 7128 Gregory Dr Norfolk, VA | 2.0 | 1.0 | 720 | $1,800 | $2.50 | 43d | 1 | 1.09mi |
| 3801 Chatham Cir Unit 2 Norfolk, VA | 2.0 | 1.0 | 1100 | $1,350 | $1.23 | 7d | 1 | 1.09mi |
| 351 San Antonio Blvd Unit 8 Norfolk, VA | 2.0 | 1.0 | 675 | $1,250 | $1.85 | 12d | 1 | 1.11mi |
| 440 San Antonio Blvd Norfolk, VA | 2.0 | 1.0 | 800 | $1,535 | $1.92 | 23d | 1 | 1.16mi |
| 3820 Essex Cir Unit B 1 Norfolk, VA | 2.0 | 1.0 | 900 | $1,700 | $1.89 | 21d | 1 | 1.24mi |
| 3820 Essex Cir #1 Norfolk, VA | 2.0 | 1.0 | 1000 | $2,250 | $2.25 | 17d | 1 | 1.24mi |
| 3820 Essex Cir Unit A Norfolk, VA | 2.0 | 1.0 | 1000 | $2,200 | $2.20 | 21d | 1 | 1.24mi |
| 6340 Sewells Point Rd Apt communities Norfolk, VA | 2.0 | 1.0 | 750 | $1,099 | $1.47 | 21d | 1 | 1.26mi |
| 417 E Little Creek Rd Apt 4 Norfolk, VA | 2.0 | 1.0 | 700 | $1,050 | $1.50 | 7d | 1 | 1.28mi |
| 6343 Chesapeake Blvd Apt communities Norfolk, VA | 2.0 | 1.0 | 750 | $1,099 | $1.47 | 21d | 1 | 1.31mi |
| 507 Ashlawn Dr Norfolk, VA | 2.0 | 1.0 | 750 | $1,395 | $1.86 | 43d | 1 | 1.33mi |
| 7922 Old Ocean View Rd Norfolk, VA | 1.0–3.0 | 1.0–1.5 | 890 | $1,300 | $1.46 | 1d | 3 | 1.36mi |
| 508 Ashlawn Dr Unit 2 Norfolk, VA | 2.0 | 1.0 | 725 | $1,250 | $1.72 | 21d | 1 | 1.36mi |
| 504 Ashlawn Dr Norfolk, VA | 2.0 | 1.0 | 725 | $1,250 | $1.72 | 21d | 1 | 1.37mi |
| 504 Ashlawn Dr Unit 2 Norfolk, VA | 2.0 | 1.0 | 725 | $1,250 | $1.72 | 23d | 1 | 1.37mi |
| 7996 Diggs Rd Unit D Norfolk, VA | 3.0 | 2.0 | 950 | $1,375 | $1.45 | 43d | 1 | 1.37mi |
| 311 Ashlawn Dr Unit 3 Norfolk, VA | 2.0 | 1.0 | 800 | $1,195 | $1.49 | 44d | 1 | 1.37mi |
| 312 Ashlawn Dr Norfolk, VA | 2.0 | 1.0 | 720 | $1,200 | $1.67 | 43d | 1 | 1.40mi |
| 6234 Chesapeake Blvd Norfolk, VA | 2.0 | 1.0 | 986 | $925 | $0.94 | 17d | 1 | 1.40mi |
| 4566 Hampshire Ave Unit A Norfolk, VA | 2.0 | 1.0 | 870 | $1,350 | $1.55 | 43d | 1 | 1.41mi |
| 307 W Little Creek Rd Unit C Norfolk, VA | 2.0 | 1.0 | 830 | $1,395 | $1.68 | 10d | 1 | 1.41mi |
| 1607 Lasalle Ave Unit 3 Norfolk, VA | 2.0 | 1.0 | 816 | $1,400 | $1.72 | 43d | 1 | 1.41mi |
| 6228 Chesapeake Blvd Unit G Norfolk, VA | 2.0 | 1.0 | 885 | $925 | $1.05 | 43d | 1 | 1.42mi |
| 1801 Lasalle Ave Norfolk, VA | 3.0 | 1.0 | 1102 | $1,880 | $1.71 | 44d | 1 | 1.43mi |
| 6241 Alexander St Unit F Norfolk, VA | 2.0 | 1.0 | 704 | $895 | $1.27 | 12d | 1 | 1.45mi |
| 6249 Alexander St Unit F Norfolk, VA | 2.0 | 1.0 | 817 | $1,195 | $1.46 | 3d | 1 | 1.45mi |
Listing history 4 events
-
2026-05-13$251,200 Active 735-char remark
-
2003-05-20soldstatus $64,000
-
1996-05-24soldstatus $63,900
-
1967-07-12soldstatus $9,300
ⓘ Source: listings_history table (triggers on properties + properties_extension) + one-shot
backfill from property_details.listing_events for pre-trigger history.
Tax reassessment forecast VA · Resets to sale price
- Current annual tax
- $2,547 · $212/mo
- Projected year-2 tax
- $2,547 · $212/mo
- Expected delta
- $0/yr ($0/mo · 0.0%)
ⓘ Screening estimate from a state-policy table — verify with the county assessor before closing.
Climate risk First Street
- Flood 4/10 Moderate FEMA zone X (shaded) · 21% chance over 30 yrs
- Wildfire 1/10 Low
- Heat 9/10 Extreme 7 d/yr ≥105°F today · 16 d/yr by 30 yrs out
- Wind 8/10 Severe 80% chance of damaging wind over 30 yrs
- Air quality 3/10 Moderate 2 unhealthy d/yr today · 5 by 30 yrs out
Nearby sold comps map
Loading sold comps map…
Walkable amenities ~0.75 mi
Loading nearby amenities…
Taxation est. · year 1
- Rental income
- $21,404
- − Mortgage interest
- −$14,071
- − Property taxes
- −$2,547
- − Insurance
- −$1,256
- − Repairs & maintenance
- −$1,712
- − Management
- −$1,712
- − Depreciation
- −$7,308
- Taxable loss
- −$7,203
- Est. tax savings @ 24.0%
- +$1,729
- After-tax cash flow
- $-974/yr
For passive investors: Depreciation is non-cash, so a rental often shows a tax loss while cash-flowing — sheltering income. Rental losses are passive: they offset passive income freely, and up to $25,000/yr can offset ordinary (W-2) income if you actively participate and your MAGI is under $100k (phasing out to $0 by $150k); unused losses carry forward. On sale, claimed depreciation is recaptured at up to 25%, and gains may owe capital-gains tax (a 1031 exchange can defer both). Figures are a year-1 estimate at your 24.0% rate — not tax advice; consult a CPA.
Schools (NCES district)
- District
- Norfolk City Public School District
- NCES district ID
- 5102670
- Math proficiency
- 27% ▼ -44.00%
- Reading proficiency
- 56% ▼ -10.00%
- Median HH income
- $44,358
- Composite
- 35.08/100
- National rank
- #5026
- State rank
- #118 of 131 in VA
Livability — Norfolk
- Score
- 83/100
- State rank
- #43
- US rank
- #1026
Category grades
Schools grade is shown separately in the Schools card above.
Census & demographics
- Census place
- Norfolk, VA
- County
- Norfolk City · 214,042 people
- City population
- 214,042
- Metro
- Virginia Beach-Norfolk-Newport News, VA-NC
- Population (ZIP)
- 13,105
- Household income
- $72,816
- Rent vs Own
- Severe rent burden
- 575.0
Population outlook (Norfolk County) Hauer SSP2
- Today (2025)
- 249,032 people
- By 2030
- 252,347 · +1.3%
- By 2040
- 253,644 · +1.9%
- By 2050
- 251,913 · +1.2%
- By 2075
- 245,281 · -1.5%
- By 2100
- 219,548 · -11.8%
Race, ethnicity, and origin ACS 2023
- Neighborhood character
- Diverse neighborhood (Simpson 0.64)
- Race & ethnicity
- White 44% Black 39% Hispanic / Latino 9% Two or more races 8% Asian 2%
- Hispanic origin (detail)
- Mexican 2% Puerto Rican 2%
- Common ancestry
- Italian 4% Serbian 2% Romanian 1%
- Foreign-born
- 6% · Canada, China
- Languages at home
- 91% English-only · Spanish 5% Other Asian/Pacific 1%
Political lean MEDSL · Norfolk
- 2024 margin
- Solid D (+41.5) · D 70.0% · R 28.5% · Other 1.6%
- 2008→2024 swing
- -1.4pp toward R · 2008: 43.0pp · 2024: 41.5pp
- All cycles
- 2024: D+41.5 2020: D+45.6 2016: D+42.0 2012: D+44.0 2008: D+43.0
Not yet ingested
- Civics
- —
Market trends
- HPI YoY
- ▼ -4.16%
- Current HPI
- 321.56
- Rent YoY
- ▲ 13.99%
- Metro
- Virginia Beach-Norfolk-Newport News, VA-NC
- State GDP YoY
- ▲ 2.40%
- F500 in state
- 50
Industry mix (Fortune 500 HQ in VA)
| Industry | F500 HQs | Revenue |
|---|---|---|
| Aerospace / Defense | 4 | $236B |
|
||
| Technology / Defense | 3 | $32B |
|
||
| Financial Services | 2 | $176B |
|
||
| Utilities | 2 | $27B |
|
||
| Insurance | 2 | $25B |
|
||
| Technology | 2 | $15B |
|
||
Price history
+2601.1% since first listed6 events — show timeline
- 2026-06-16 Sold (MLS) $251,200 REINMLS
- 2026-05-20 Pending — REINMLS
- 2026-05-13 Listed $251,200 REINMLS
- 2003-05-20 Sold (Public Records) $64,000 Public Records
- 1996-05-24 Sold (Public Records) $63,900 Public Records
- 1967-07-12 Sold (Public Records) $9,300 Public Records
Property tax history
+4.0%/yrLatest (2025): $2,547 · +1.5% YoY. Source: county tax records.
Cash-flow waterfall
monthlySold comps — $/sqft
last 12 mo · ≤1 miLoading sold comps…