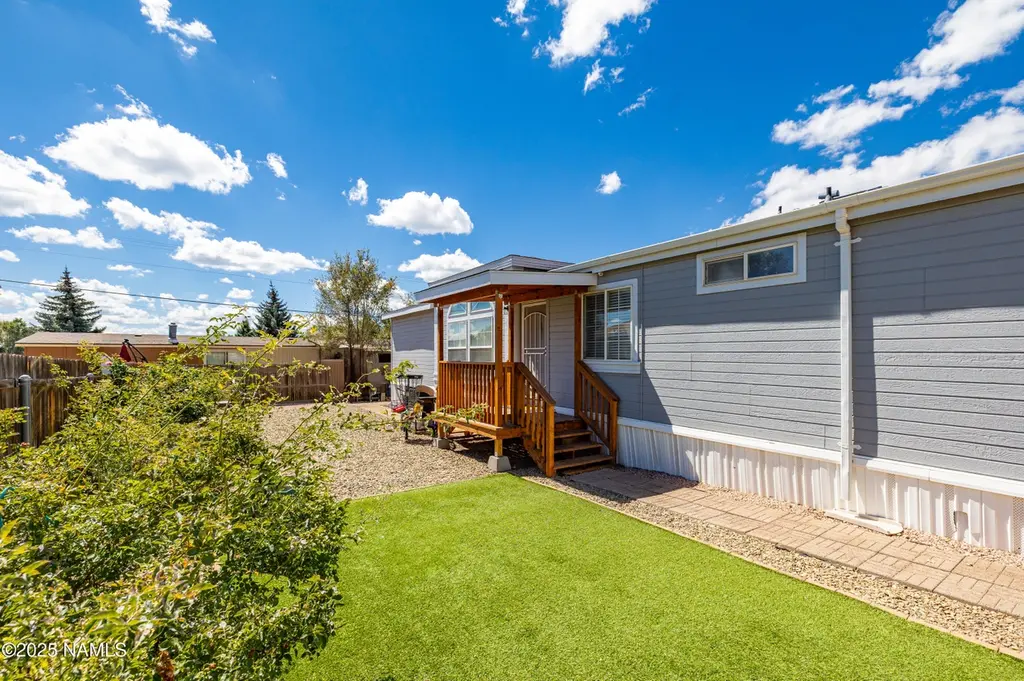
5075 E Dean Ave · Flagstaff, AZ
Flood risk 6/10 · Moderate
- FEMA flood zone
- X (unshaded)
- Chance of flooding over 30 yrs
- 0.69%
- Est. flood insurance / yr
- $507 – $1,088
Fire risk 8/10 · Major
- Est. fire insurance / yr
- $610 – $1,132
Heat risk 2/10 · Minimal
- Hot days now (above 88°F)
- 7 days/yr
- Hot days in 30 yrs
- 16 days/yr
Wind risk 1/10 · Minimal
- Chance of severe wind over 30 yrs
- —
Air-quality risk 1/10 · Minimal
- Unhealthy air days now
- 0 days/yr
- Unhealthy air days in 30 yrs
- 0 days/yr
Risk factors via First Street. Map © Google.
Why this score? — see what drove the B- grade
The composite is a weighted blend of 9 inputs, each scored 0–100. Each bar is that input's sub-score; the figure is the points it added to the 100-point composite (weight × sub-score).
- Cash flow +30.0/30.0
- 1% rule +10.0/10.0
- DSCR +10.0/10.0
- ARV discount +7.5/15.0
- Livability +3.1/5.0
- Rent growth +2.9/5.0
- Condition / age +2.5/5.0
- Schools +2.1/10.0
- Appreciation +0.0/10.0
$160,000
🖨 Deal sheet 📄 Offer letter ✓ Due diligence
Listing remarks
Sellers are EXTREMELY motivated and willing to pay the first three months of lot rent, either through a buyer credit at closing or directly to the buyer as part of an accepted contract. Beautifully maintained 3-bedroom, 2-bath home offering 1,680 sq ft of comfortable living on leased land. This spacious home features two inviting living areas and an open kitchen with abundant cabinetry and counter space that flows seamlessly into the dining area. The private primary suite includes a walk-in closet and en suite bath, while two additional bedrooms offer flexibility for guests or a home office. A new hot water heater adds peace of mind. Enjoy Mount Elden views from the fully fenced, landscaped
Key facts
- Walk-in closet
- Abundant cabinetry
- En suite bath
Tags
Property features AI
Exterior
- Security: Smoke detectors
- Utilities: Electricity available; Natural gas available; Cable available; Phone available
- Home design: One-story home
- Construction: Crawl space foundation; Year built (owner reported)
- Exterior features: Perimeter fencing; Landscaped yard; Shed(s); Level lot; Mountain views; Paved, publicly maintained road access
Interior
- Kitchen: Gas range
- Flooring: Carpet; Vinyl
- Bathrooms: 2 bathrooms
- Heating & cooling: Natural gas forced-air heating; Ceiling fan(s)
- Interior features: Kitchen island; Pantry; Double pane windows; Wood-burning fireplace
Neighborhood map
What this means for you Summary
Snapshot
- This is a 3-bed/2.0-bath manufactured listed at $160k.
Deal economics
- At list price, monthly cash flow is $1k ($13k/yr) — positive.
- The deal already cash-flows at list — no discount required.
- Meets the 1% rule at list price ($3k rent vs $160k).
- Recommended offer: $155k (3.0% below list) — sets the bar for market timing.
- Cap rate 14.5% vs local median 2.1% in Flagstaff — top-decile yield for the area; either an underpriced asset or a hidden risk that comps aren't pricing in. Stress-test before assuming the spread holds.
Location & tenants
- Location reads 61/100 on livability (#167 in AZ) — a middle-class / working-renter tenant base. Strengths: housing B; Watch: schools C-, employment C-, crime D-.
- Flagstaff Unified District (4192) (urban): math 18% / reading 29% proficiency, ranked #158 of 249 in AZ (top 64%) — low school quality limits family demand, transient renter base, plan for 1-2y turnover.
- Market conditions: Rents rising (+1.6%/yr); 308 active listings in the ZIP; 3 comparable units currently listed for rent nearby; rentals lingering (median 44d on market — plan ~5-8 weeks vacancy on turnover, expect pricing pressure); 100% of comp listings sitting > 30 days — soft ceiling on asking rent; solid renter incomes; 698 units permitted in Coconino County in 2024 (354 in 5+ unit buildings).
- This rent runs 41% of the median local income ($81k/yr) — at the standard rent-burdened threshold; future hikes will face affordability resistance.
Forward outlook
- Local home prices are declining (-3.0%/yr); year-one equity from $1k of loan paydown is wiped out by about $5k of value loss. Plan a longer hold.
- Coconino County population projected at +20% by 2050 — long-run rental-demand tailwind backs the buy-and-hold thesis.
- At projected returns (-3.0% appreciation + 1.6% rent growth), your $45k cash investment doubles in ~5 years — after that, you're playing with house money.
Negotiation context
- It's been on market 37 days — a 3% lower offer ($155k) is reasonable based on typical stale-listing flexibility.
- 3 sale attempts; this cycle's ask has dropped $10k (6%) from the opening price — seller is motivated, your offer sets the floor, not the list.
Risks & watch-outs
- Climate carrying-cost: major flood risk; severe wildfire risk — expect insurance premiums to compound above CPI over the hold.
Questions for the listing agent
- It's been on market 37 days. Have you received any prior offers? Is the seller open to a 3% concession, seller financing, or rate buy-down credit?
- Is there a deadline driving the sale (1031 exchange, divorce, estate, relocation)? That informs how much negotiation room exists.
- Crime grade is D in this area — have there been break-ins, vandalism, or insurance claims at this property in the last 3 years? What carrier currently insures it and at what premium?
- What's the average days-on-market for RENTAL listings here right now (not sales)? A rising rental-DOM trend means longer vacancies and softer asking-rent achievability than the comps imply.
- What's the recent tenant-quality profile in this submarket — average credit score on applications, eviction rate, late-payment / NSF rate, and stable-employment percentage? A property-management company in the area should have these aggregated.
- How much new for-sale + rental construction is in the pipeline within 1–3 miles? Heavy new supply typically softens prices + rents 12–24 months out; constrained supply supports both.
Investment metrics
- 1% rule
- 1.74% ✓
- Cap rate
- 14.54%
- Cash-on-cash
- 29.44%
- DSCR
- 2.31
- GRM
- 4.8
CMA / ARV
- ARV (median comp)
- $404,547
- List price
- $160,000
- Delta
- -60.45%
- Verdict
- UNDERPRICED
- Comps
- 14 within 1.0 mi
Show comp detail 12 sales within ~0.75 mi
| Address | Dist | Beds/Ba | Sqft | Sold | Price | $/sf | Match |
|---|---|---|---|---|---|---|---|
| 4879 E Gibson Ave | 0.31mi | 4/2.0 (+1) | 1,628 (+0%) | 1mo | $440,000 | $270 | 79 |
| 4862 E Lowell Dr | 0.20mi | 3/2.0 | 1,692 (+4%) | 10mo | $450,000 | $266 | 74 |
| 4925 E Allen Ave #74 | 0.14mi | 3/2.0 | 1,792 (+11%) | 4mo | $145,000 | $81 | 73 |
| 5276 N Thornton Pl | 0.34mi | 4/2.0 (+1) | 1,628 (+0%) | 7mo | $460,000 | $283 | 73 |
| 4950 E Dean Ave | 0.12mi | 4/2.0 (+1) | 1,792 (+11%) | 2mo | $100,000 | $56 | 70 |
| 4724 E Lowell Dr | 0.30mi | 3/2.0 | 1,599 (-1%) | 20mo | $422,000 | $264 | 68 |
| 4801 E Kinsey Dr | 0.28mi | 3/2.0 | 1,456 (-10%) | 6mo | $430,000 | $295 | 65 |
| 5367 N Thornton Pl | 0.32mi | 4/2.0 (+1) | 1,628 (+0%) | 17mo | $418,000 | $257 | 65 |
| 5300 N Thornton Pl | 0.32mi | 3/2.0 | 1,528 (-6%) | 14mo | $442,000 | $289 | 64 |
| 5211 N Thornton Pl | 0.38mi | 4/2.0 (+1) | 1,621 (+0%) | 20mo | $410,000 | $253 | 60 |
| 6289 N Snowflake Dr | 0.69mi | 4/2.0 (+1) | 1,568 (-3%) | 5mo | $435,000 | $277 | 53 |
| 4333 E Wintergreen Rd | 0.64mi | 3/2.0 | 1,536 (-5%) | 16mo | $439,900 | $286 | 49 |
Match score weights: distance 35% · size 25% · config 20% · recency 20%. Top-matched comps best support the ARV.
Projected returns pro-forma
-3.0% appreciation · 1.59% rent growth · sell at horizon
- IRR
- 22.3%
- Equity multiple
- 1.90×
- Total profit
- $40,217
- Equity at exit
- $23,857
- IRR
- 29.4%
- Equity multiple
- 3.45×
- Total profit
- $109,761
- Equity at exit
- $13,834
Cash invested: $44,800 (down + closing). Projections, not guarantees.
Landlord ↔ Tenant lean methodology
- Overall (STATE)
- 87 Strongly Landlord-Friendly
- State Arizona
- 87 Strongly Landlord-Friendly · R+3
- County
- — inherits STATE
- City
- — inherits STATE
ZIP-level market 86004
- Rents YoY
- 1.6%
- Active inventory
- 308
- Price-to-rent
- 4.8×
Monthly cashflow live
- Estimated rent
- $2,791 medium interval (Pro) →
- Mortgage (P&I)
- −$839
- Tax est. 1.5%
- −$200 /mo · $2,400/yr
- Insurance
- −$67
- HOA
- −$0
- Vacancy / Maint / Mgmt
- −$586
- Net cashflow
- $1,099
Break-even live
UW: 25.0% down · 7.5% · 30yr · 1.5% tax · 5.0% vac · 8.0% maint · 8.0% mgmt
Financing live
Cash to close
- Down payment
- $40,000
- Closing costs
- $4,800
- Reserves months
- —
- Total cash needed
- —
Loan-product check · same deal, 3 products live
Conventional
25% down · 7.5% · 30yr
- Down + closing
- —
- Monthly P&I
- —
- Monthly cashflow
- —
- DSCR
- —
- Eligible?
- —
Personal DTI + credit; lowest rate.
DSCR
20% down · 8.5% · 30yr
- Down + closing
- —
- Monthly P&I
- —
- Monthly cashflow
- —
- DSCR
- —
- Eligible?
- —
No personal income docs; deal must DSCR.
Hard money
10% down · 12.0% · 12mo
- Down + closing
- —
- Monthly P&I
- —
- Monthly cashflow
- —
- DSCR
- —
- Eligible?
- —
Short-term bridge; refi at stabilization.
Rent comps 3 comps
| Address | Beds | Baths | Sqft | Rent | $/sqft | DOM | Units | Dist |
|---|---|---|---|---|---|---|---|---|
| 3950 E Philip Ave Flagstaff, AZ | 3.0 | 2.0 | 1560 | $2,600 | $1.67 | 43d | 1 | 1.18mi |
| 3844 Jacamar Dr Flagstaff, AZ | 3.0 | 2.5 | 1932 | $3,000 | $1.55 | 43d | 1 | 1.43mi |
| 4343 E Soliere Ave Flagstaff, AZ | 1.0–3.0 | 1.0–2.0 | 1000 | $2,995 | $3.00 | 43d | 12 | 1.49mi |
Listing history 14 events
-
2026-06-07days on market $160,000 Active 37 DOM
-
2026-06-05days on market $160,000 Active 34 DOM
-
2026-06-03days on market $160,000 Active 33 DOM
-
2026-06-02days on market $160,000 Active 32 DOM
-
2026-06-01days on market $160,000 Active 31 DOM
-
2026-05-31days on market $160,000 Active 30 DOM
-
2026-05-30days on market $160,000 Active 29 DOM
-
2026-05-18price $165,000 752-char remark
-
2026-05-01$170,000 Active 752-char remark
-
2026-03-14historical
-
2026-02-23$170,000 Active
-
2026-01-24historical
-
2025-11-23price $205,000
-
2025-10-03$215,000 Active
ⓘ Source: listings_history table (triggers on properties + properties_extension) + one-shot
backfill from property_details.listing_events for pre-trigger history.
Climate risk First Street
- Flood 6/10 Major FEMA zone X (unshaded) · 69% chance over 30 yrs
- Wildfire 8/10 Severe
- Heat 2/10 Low 7 d/yr ≥88°F today · 16 d/yr by 30 yrs out
- Wind 1/10 Low
- Air quality 1/10 Low 0 unhealthy d/yr today · 0 by 30 yrs out
Nearby sold comps map
Loading sold comps map…
Walkable amenities ~0.75 mi
Loading nearby amenities…
Taxation est. · year 1
- Rental income
- $33,492
- − Mortgage interest
- −$8,962
- − Property taxes
- −$2,400
- − Insurance
- −$800
- − Repairs & maintenance
- −$2,679
- − Management
- −$2,679
- − Depreciation
- −$4,655
- Taxable income
- $11,316
- Est. tax owed @ 24.0%
- −$2,716
- After-tax cash flow
- $10,474/yr
For passive investors: Depreciation is non-cash, so a rental often shows a tax loss while cash-flowing — sheltering income. Rental losses are passive: they offset passive income freely, and up to $25,000/yr can offset ordinary (W-2) income if you actively participate and your MAGI is under $100k (phasing out to $0 by $150k); unused losses carry forward. On sale, claimed depreciation is recaptured at up to 25%, and gains may owe capital-gains tax (a 1031 exchange can defer both). Figures are a year-1 estimate at your 24.0% rate — not tax advice; consult a CPA.
Schools (NCES district)
- District
- Flagstaff Unified District (4192)
- NCES district ID
- 0402860
- Math proficiency
- 18% ▼ -16.00%
- Reading proficiency
- 29% ▼ -10.00%
- Median HH income
- $53,510
- Composite
- 21.11/100
- National rank
- #8437
- State rank
- #158 of 249 in AZ
Livability — Flagstaff
- Score
- 61/100
- State rank
- #167
- US rank
- #18308
Category grades
Schools grade is shown separately in the Schools card above.
Census & demographics
- Census place
- Flagstaff, AZ
- County
- Coconino County · 91,667 people
- City population
- 91,667
- Metro
- Flagstaff, AZ
- Population (ZIP)
- 36,394
- Household income
- $81,172
- Rent vs Own
- Severe rent burden
- 1475.0
Population outlook (Coconino County) Hauer SSP2
- Today (2025)
- 150,645 people
- By 2030
- 156,857 · +4.1%
- By 2040
- 168,714 · +12.0%
- By 2050
- 181,082 · +20.2%
- By 2075
- 218,399 · +45.0%
- By 2100
- 238,853 · +58.6%
Race, ethnicity, and origin ACS 2023
- Neighborhood character
- Diverse neighborhood (Simpson 0.61)
- Race & ethnicity
- White 59% Hispanic / Latino 21% Two or more races 13% Native American 12% Asian 1% Black 1%
- Hispanic origin (detail)
- Mexican 15%
- Common ancestry
- Italian 4% Romanian 3% Slovak 2%
- Foreign-born
- 7% · Canada
- Languages at home
- 80% English-only · Spanish 12% German/W. Germanic 1% Other Asian/Pacific 1%
Political lean MEDSL · Coconino
- 2024 margin
- D (+19.9) · D 59.2% · R 39.4% · Other 1.4%
- 2008→2024 swing
- +2.9pp toward D · 2008: 17.0pp · 2024: 19.9pp
- All cycles
- 2024: D+19.9 2020: D+24.1 2016: D+19.4 2012: D+14.9 2008: D+17.0
Not yet ingested
- Civics
- —
Market trends
- HPI YoY
- ▼ -454.67%
- Current HPI
- 411.8577
- Rent YoY
- ▲ 1.59%
- Metro
- Flagstaff, AZ
- State GDP YoY
- ▲ 4.54%
- F500 in state
- 20
Industry mix (Fortune 500 HQ in AZ)
| Industry | F500 HQs | Revenue |
|---|---|---|
| Technology | 2 | $13B |
|
||
| Mining / Metals | 1 | $23B |
|
||
| Environmental Services | 1 | $16B |
|
||
| Metals / Steel | 1 | $14B |
|
||
| Technology Distribution | 1 | $9B |
|
||
| Homebuilding | 1 | $8B |
|
||
Price history
-25.6% since first listed8 events — show timeline
- 2026-05-20 Price Changed $160,000 NAZMLS
- 2026-05-18 Price Changed $165,000 NAZMLS
- 2026-05-01 Listed $170,000 NAZMLS
- 2026-03-14 Listing Removed — NAZMLS
- 2026-02-23 Listed $170,000 NAZMLS
- 2026-01-24 Listing Removed — NAZMLS
- 2025-11-23 Price Changed $205,000 NAZMLS
- 2025-10-03 Listed $215,000 NAZMLS
Property tax history
+3.2%/yrLatest (2025): $249 · +3.0% YoY. Source: county tax records.
Cash-flow waterfall
monthlySold comps — $/sqft
last 12 mo · ≤1 miLoading sold comps…