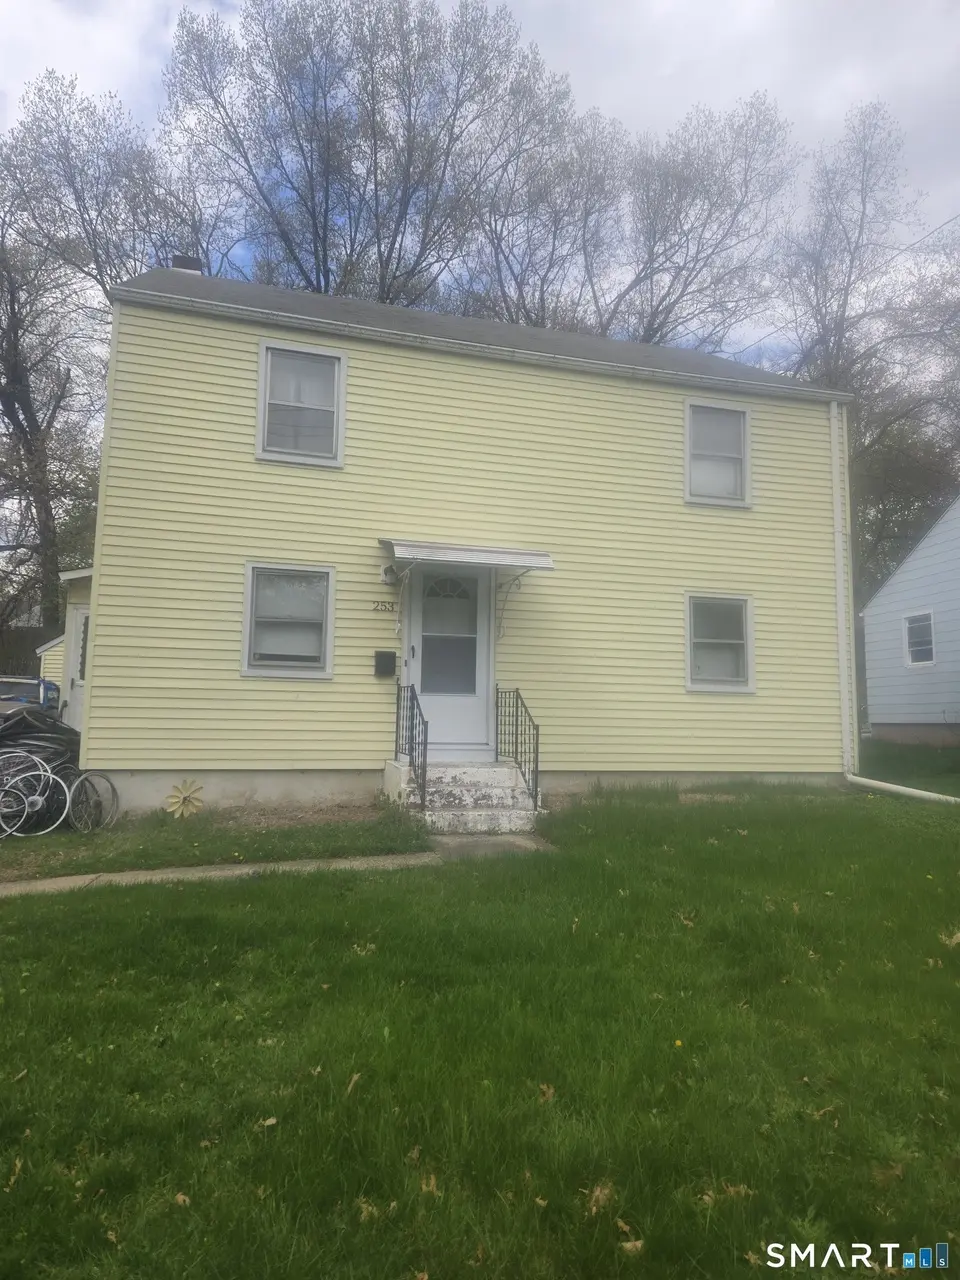
253 Hilliard St · Manchester, CT
Flood risk 6/10 · Moderate
- FEMA flood zone
- X (unshaded)
- Chance of flooding over 30 yrs
- 0.72%
- Est. flood insurance / yr
- $507 – $1,088
Fire risk 1/10 · Minimal
- Est. fire insurance / yr
- $829 – $1,539
Heat risk 5/10 · Moderate
- Hot days now (above 96°F)
- 7 days/yr
- Hot days in 30 yrs
- 16 days/yr
Wind risk 6/10 · Moderate
- Chance of severe wind over 30 yrs
- 27.0%
Air-quality risk 3/10 · Minor
- Unhealthy air days now
- 3 days/yr
- Unhealthy air days in 30 yrs
- 4 days/yr
Risk factors via First Street. Map © Google.
Why this score? — see what drove the B- grade
The composite is a weighted blend of 9 inputs, each scored 0–100. Each bar is that input's sub-score; the figure is the points it added to the 100-point composite (weight × sub-score).
- Cash flow +24.8/30.0
- ARV discount +15.0/15.0
- DSCR +8.0/10.0
- 1% rule +7.5/10.0
- Livability +3.8/5.0
- Rent growth +3.7/5.0
- Schools +2.5/10.0
- Condition / age +2.5/5.0
- Appreciation +0.0/10.0
$189,900
🖨 Deal sheet 📄 Offer letter ✓ Due diligence
Listing remarks MLS
Much potential in this 4BR 1 1/2 Bath Colonial, but extremely cluttered and dirty. Eat-in kitchen, formal living room, 2 bedrooms on first floor (one was used as a dining room) and a 2 large bedrooms on the second floor. Hardwood under carpets in living room. Needs paint, removal of wallpaper, cleaning, repairs to small plumbing joint in basement, furnace, and hot water heater. Being sold "as-is". Cash or conventional only. Home and garage will be cleaned out prior to closing.
Key facts
- 6,969 sq ft lot
- Garage
- Built 1942
Neighborhood map
What this means for you Summary
Snapshot
- This is a 3-bed/1.5-bath single-family listed at $190k.
Deal economics
- At list price, monthly cash flow is $399 ($5k/yr) — positive.
- The deal already cash-flows at list — no discount required.
- Meets the 1% rule at list price ($2k rent vs $190k).
- Cap rate 8.8% vs local median 3.8% in Manchester — top-decile yield for the area; either an underpriced asset or a hidden risk that comps aren't pricing in. Stress-test before assuming the spread holds.
Location & tenants
- Location reads 76/100 on livability (#59 in CT, #3,580 nationally) — a middle-class / working-renter tenant base. Strengths: housing A+, health & safety A+, cost of living A-; Watch: amenities D, commute F.
- Manchester School District (suburban): math 21% / reading 32% proficiency, ranked #130 of 153 in CT (top 85%) — low school quality limits family demand, transient renter base, plan for 1-2y turnover.
- Market conditions: Rents rising fast (+4.8%/yr); 57 active listings in the ZIP; 19 comparable units currently listed for rent nearby; rentals at typical pace (median 22d on market — plan ~3-4 weeks tenant-placement turnaround); 42% of comp listings sitting > 30 days — soft ceiling on asking rent; solid renter incomes; 1,867 units permitted in Capitol Planning Region in 2024 (1,399 in 5+ unit buildings).
- This rent runs 31% of the median local income ($92k/yr) — at the standard rent-burdened threshold; future hikes will face affordability resistance.
Forward outlook
- Local home prices are declining (-3.0%/yr); year-one equity from $1k of loan paydown is wiped out by about $6k of value loss. Plan a longer hold.
- At projected returns (-3.0% appreciation + 4.8% rent growth), your $53k cash investment doubles in ~10 years — after that, you're playing with house money.
Negotiation context
- Only 5 days on market — expect competitive offers; lowballing is unlikely to land.
Risks & watch-outs
- Watch-outs: built in 1942 — expect roof / HVAC / electrical / plumbing capex.
- Climate carrying-cost: major flood risk; major wind risk, 27% chance of damaging wind over 30y; extreme-heat days projected 7→16/yr by 2055 (HVAC capex compounding) — expect insurance premiums to compound above CPI over the hold.
Questions for the listing agent
- Built in 1942 — when were the roof, HVAC, electrical panel, plumbing, and water heater last replaced?
- Is there a deadline driving the sale (1031 exchange, divorce, estate, relocation)? That informs how much negotiation room exists.
- Schools are B-rated — typically a magnet for longer-tenancy family renters. What's the average tenant stay here, and is there a school-zone premium baked into asking?
- What's the average days-on-market for RENTAL listings here right now (not sales)? A rising rental-DOM trend means longer vacancies and softer asking-rent achievability than the comps imply.
- What's the recent tenant-quality profile in this submarket — average credit score on applications, eviction rate, late-payment / NSF rate, and stable-employment percentage? A property-management company in the area should have these aggregated.
- How much new for-sale + rental construction is in the pipeline within 1–3 miles? Heavy new supply typically softens prices + rents 12–24 months out; constrained supply supports both.
Investment metrics
- 1% rule
- 1.25% ✓
- Cap rate
- 8.82%
- Cash-on-cash
- 9.01%
- DSCR
- 1.40
- GRM
- 6.7
CMA / ARV
- ARV (median comp)
- $299,556
- List price
- $189,900
- Delta
- -36.61%
- Verdict
- UNDERPRICED
- Comps
- 20 within 1.0 mi
Show comp detail 12 sales within ~0.75 mi
| Address | Dist | Beds/Ba | Sqft | Sold | Price | $/sf | Match |
|---|---|---|---|---|---|---|---|
| 237 Woodland St | 0.12mi | 4/2.0 (+1) | 1,358 (-2%) | 6mo | $264,500 | $195 | 79 |
| 22 Carroll Rd | 0.43mi | 3/1.5 | 1,380 (-1%) | 1mo | $375,000 | $272 | 78 |
| 444 Hilliard St | 0.42mi | 3/2.0 | 1,354 (-3%) | 2mo | $337,500 | $249 | 72 |
| 15 Stock Place St | 0.31mi | 3/2.0 | 1,296 (-7%) | 4mo | $329,900 | $255 | 69 |
| 186 Irving St | 0.19mi | 3/2.0 | 1,248 (-10%) | 6mo | $330,000 | $264 | 67 |
| 514 Hilliard St | 0.57mi | 3/1.0 | 1,360 (-2%) | 3mo | $325,000 | $239 | 65 |
| 65 Broad St | 0.21mi | 3/1.0 | 1,242 (-11%) | 8mo | $220,000 | $177 | 64 |
| 11 Penn Rd | 0.59mi | 3/1.0 | 1,370 (-2%) | 7mo | $319,900 | $234 | 62 |
| 94 Broad St | 0.29mi | 3/1.0 | 1,229 (-12%) | 5mo | $301,500 | $245 | 60 |
| 3 French Rd | 0.64mi | 3/1.0 | 1,325 (-5%) | 1mo | $270,000 | $204 | 59 |
| 94 BRENT Rd | 0.58mi | 3/1.0 | 1,524 (+10%) | 1mo | $320,000 | $210 | 54 |
| 30 Duval St | 0.64mi | 3/2.0 | 1,527 (+10%) | 7mo | $340,000 | $223 | 46 |
Match score weights: distance 35% · size 25% · config 20% · recency 20%. Top-matched comps best support the ARV.
Projected returns pro-forma
-3.0% appreciation · 4.8% rent growth · sell at horizon
- IRR
- -0.4%
- Equity multiple
- 0.98×
- Total profit
- $-850
- Equity at exit
- $28,315
- IRR
- 11.2%
- Equity multiple
- 1.96×
- Total profit
- $51,106
- Equity at exit
- $16,419
Cash invested: $53,172 (down + closing). Projections, not guarantees.
Landlord ↔ Tenant lean methodology
- Overall (STATE)
- 27 Tenant-Leaning
- State Connecticut
- 27 Tenant-Leaning · D+7
- County
- — inherits STATE
- City
- — inherits STATE
ZIP-level market 06042
- Rents YoY
- 4.8%
- Active inventory
- 57
- Price-to-rent
- 6.7×
Monthly cashflow live
- Estimated rent
- $2,366 high interval (Pro) →
- Mortgage (P&I)
- −$996
- Tax from tax record
- −$395 /mo · $4,735/yr
- Insurance
- −$79
- HOA
- −$0
- Vacancy / Maint / Mgmt
- −$497
- Net cashflow
- $399
Break-even live
UW: 25.0% down · 7.5% · 30yr · 1.5% tax · 5.0% vac · 8.0% maint · 8.0% mgmt
Financing live
Cash to close
- Down payment
- $47,475
- Closing costs
- $5,697
- Reserves months
- —
- Total cash needed
- —
Loan-product check · same deal, 3 products live
Conventional
25% down · 7.5% · 30yr
- Down + closing
- —
- Monthly P&I
- —
- Monthly cashflow
- —
- DSCR
- —
- Eligible?
- —
Personal DTI + credit; lowest rate.
DSCR
20% down · 8.5% · 30yr
- Down + closing
- —
- Monthly P&I
- —
- Monthly cashflow
- —
- DSCR
- —
- Eligible?
- —
No personal income docs; deal must DSCR.
Hard money
10% down · 12.0% · 12mo
- Down + closing
- —
- Monthly P&I
- —
- Monthly cashflow
- —
- DSCR
- —
- Eligible?
- —
Short-term bridge; refi at stabilization.
Rent comps 19 comps
| Address | Beds | Baths | Sqft | Rent | $/sqft | DOM | Units | Dist |
|---|---|---|---|---|---|---|---|---|
| 68 Westerly St Manchester, CT | 3.0 | 1.5 | 1400 | $2,200 | $1.57 | 44d | 1 | 0.17mi |
| 6 Oak Forest Dr #3 Manchester, CT | 2.0 | 1.5 | 1150 | $2,450 | $2.13 | 21d | 1 | 0.48mi |
| 184 Main St Unit D Manchester, CT | 3.0 | 2.5 | 1860 | $2,900 | $1.56 | 3d | 1 | 0.58mi |
| 527 Hilliard St Unit A Manchester, CT | 2.0 | 1.5 | 1168 | $2,100 | $1.80 | 44d | 1 | 0.63mi |
| 39 Buckland St Manchester, CT | 1.0–2.0 | 1.0–2.0 | 995 | $2,515 | $2.53 | 2d | 7 | 0.76mi |
| 156 Union St Unit 2 Manchester, CT | 2.0 | 1.0 | 1000 | $1,900 | $1.90 | 2d | 1 | 0.79mi |
| 334 Summit St Unit 334 Manchester, CT | 2.0 | 1.5 | 946 | $1,800 | $1.90 | 24d | 1 | 0.79mi |
| 1500 Horizon Way Manchester, CT | 2.0 | 1.0–2.0 | 1046 | $2,960 | $2.83 | 2d | 22 | 0.80mi |
| 1500 Horizon Way Manchester, CT | 2.0 | 1.0–2.0 | 1046 | $2,950 | $2.82 | 44d | 20 | 0.80mi |
| 424 Middle Tpke W Manchester, CT | 1.0–2.0 | 1.0–1.5 | 997 | $2,150 | $2.16 | 2d | 7 | 0.81mi |
| 30 Catherines Way Manchester, CT | 1.0–3.0 | 1.0–2.0 | 1102 | $2,763 | $2.51 | 2d | 5 | 0.82mi |
| 47 Bigelow St Manchester, CT | 3.0 | 1.0 | 1500 | $1,925 | $1.28 | 44d | 1 | 1.02mi |
| 92 Valley St Manchester, CT | 2.0 | 1.0 | 900 | $1,500 | $1.67 | 44d | 1 | 1.23mi |
| 31 Nolan Cir #31 Manchester, CT | 2.0 | 1.5 | 1240 | $2,500 | $2.02 | 2d | 1 | 1.25mi |
| 633 Center St Unit E Manchester, CT | 2.0 | 1.5 | 952 | $1,825 | $1.92 | 44d | 1 | 1.25mi |
| 63 Ridge St Manchester, CT | 3.0 | 1.5 | 1590 | $2,050 | $1.29 | 44d | 1 | 1.36mi |
| Woodbridge St Unit 425 Manchester, CT | 3.0 | 1.0 | 950 | $1,900 | $2.00 | 44d | 1 | 1.40mi |
| 167 E Center St Manchester, CT | 1.0–2.0 | 1.0–1.5 | 800 | $2,199 | $2.75 | 2d | 2 | 1.41mi |
| 345 Buckland Hills Dr Manchester, CT | 1.0–3.0 | 1.0–2.0 | 991 | $2,799 | $2.82 | 2d | 27 | 1.41mi |
Listing history 3 events
-
2026-05-04status Under Contract 491-char remark
Show marketing remark (491 chars)
Much potential in this 4BR 1 1/2 Bath Colonial, but extremely cluttered and dirty. Eat-in kitchen, formal living room, 2 bedrooms on first floor (one was used as a dining room) and a 2 large bedrooms on the second floor. Hardwood under carpets in living room. Needs paint, removal of wallpaper, cleaning, repairs to small plumbing joint in basement, furnace, and hot water heater. Being sold "as-is". Cash or conventional only. Home and garage will be cleaned out prior to closing.
-
2026-04-30$189,900 Active 491-char remark
Show marketing remark (491 chars)
Much potential in this 4BR 1 1/2 Bath Colonial, but extremely cluttered and dirty. Eat-in kitchen, formal living room, 2 bedrooms on first floor (one was used as a dining room) and a 2 large bedrooms on the second floor. Hardwood under carpets in living room. Needs paint, removal of wallpaper, cleaning, repairs to small plumbing joint in basement, furnace, and hot water heater. Being sold "as-is". Cash or conventional only. Home and garage will be cleaned out prior to closing.
-
2026-04-20historical $189,900 491-char remark
Show marketing remark (491 chars)
Much potential in this 4BR 1 1/2 Bath Colonial, but extremely cluttered and dirty. Eat-in kitchen, formal living room, 2 bedrooms on first floor (one was used as a dining room) and a 2 large bedrooms on the second floor. Hardwood under carpets in living room. Needs paint, removal of wallpaper, cleaning, repairs to small plumbing joint in basement, furnace, and hot water heater. Being sold "as-is". Cash or conventional only. Home and garage will be cleaned out prior to closing.
ⓘ Source: listings_history table (triggers on properties + properties_extension) + one-shot
backfill from property_details.listing_events for pre-trigger history.
Tax reassessment forecast CT · Partial reset (capped growth)
- Current annual tax
- $4,735 · $395/mo
- Projected year-2 tax
- $4,735 · $395/mo
- Expected delta
- $0/yr ($0/mo · 0.0%)
ⓘ Screening estimate from a state-policy table — verify with the county assessor before closing.
Climate risk First Street
- Flood 6/10 Major FEMA zone X (unshaded) · 72% chance over 30 yrs
- Wildfire 1/10 Low
- Heat 5/10 Major 7 d/yr ≥96°F today · 16 d/yr by 30 yrs out
- Wind 6/10 Major 27% chance of damaging wind over 30 yrs
- Air quality 3/10 Moderate 3 unhealthy d/yr today · 4 by 30 yrs out
Nearby sold comps map
Loading sold comps map…
Walkable amenities ~0.75 mi
Loading nearby amenities…
Taxation est. · year 1
- Rental income
- $28,387
- − Mortgage interest
- −$10,637
- − Property taxes
- −$4,735
- − Insurance
- −$950
- − Repairs & maintenance
- −$2,271
- − Management
- −$2,271
- − Depreciation
- −$5,524
- Taxable income
- $1,999
- Est. tax owed @ 24.0%
- −$480
- After-tax cash flow
- $4,311/yr
For passive investors: Depreciation is non-cash, so a rental often shows a tax loss while cash-flowing — sheltering income. Rental losses are passive: they offset passive income freely, and up to $25,000/yr can offset ordinary (W-2) income if you actively participate and your MAGI is under $100k (phasing out to $0 by $150k); unused losses carry forward. On sale, claimed depreciation is recaptured at up to 25%, and gains may owe capital-gains tax (a 1031 exchange can defer both). Figures are a year-1 estimate at your 24.0% rate — not tax advice; consult a CPA.
Schools (NCES district)
- District
- Manchester School District
- NCES district ID
- 0902310
- Math proficiency
- 21% ▼ -8.00%
- Reading proficiency
- 32% ▼ -5.00%
- Median HH income
- $63,391
- Composite
- 24.54/100
- National rank
- #7643
- State rank
- #130 of 153 in CT
Livability — Manchester
- Score
- 76/100
- State rank
- #59
- US rank
- #3580
Category grades
Schools grade is shown separately in the Schools card above.
Census & demographics
- Census place
- Manchester, CT
- County
- Hartford County · 754,208 people
- City population
- 59,635
- Metro
- Hartford-East Hartford-Middletown, CT
- Population (ZIP)
- 23,822
- Household income
- $91,892
- Rent vs Own
- Severe rent burden
- 730.0
Population outlook (Capitol County) Hauer SSP2
- By 2040
- 1,063,519
Race, ethnicity, and origin ACS 2023
- Neighborhood character
- Diverse neighborhood (Simpson 0.63)
- Race & ethnicity
- White 56% Asian 14% Black 14% Hispanic / Latino 13% Two or more races 7%
- Hispanic origin (detail)
- Puerto Rican 8%
- Common ancestry
- Lithuanian 6% Romanian 6% Slovak 2%
- Foreign-born
- 20% · Canada, Vietnam, Jamaica
- Languages at home
- 72% English-only · Spanish 10% Other Indo-European 7% Other Asian/Pacific 3%
Political lean MEDSL · Capitol
- 2024 margin
- Strong D (+21.9) · D 60.1% · R 38.2% · Other 1.7%
- All cycles
- 2024: D+21.9
Not yet ingested
- Civics
- —
Market trends
- HPI YoY
- ▼ -112.15%
- Current HPI
- 196.8782
- Rent YoY
- ▲ 4.80%
- Metro
- Hartford-East Hartford-Middletown, CT
- State GDP YoY
- ▲ 1.06%
- F500 in state
- 38
Industry mix (Fortune 500 HQ in CT)
| Industry | F500 HQs | Revenue |
|---|---|---|
| Industrial Machinery | 4 | $38B |
|
||
| Insurance | 3 | $71B |
|
||
| Financial Services | 2 | $25B |
|
||
| Transportation / Logistics | 2 | $18B |
|
||
| Healthcare | 1 | $247B |
|
||
| Telecommunications | 1 | $55B |
|
||
Price history
+0.0% since first listed3 events — show timeline
- 2026-05-04 Pending — Smart MLS
- 2026-04-30 Listed $189,900 Smart MLS
- 2026-04-20 Coming Soon $189,900 Smart MLS
Property tax history
+2.4%/yrLatest (2025): $4,735 · +3.0% YoY. Source: county tax records.
Cash-flow waterfall
monthlySold comps — $/sqft
last 12 mo · ≤1 miLoading sold comps…