 Duplex
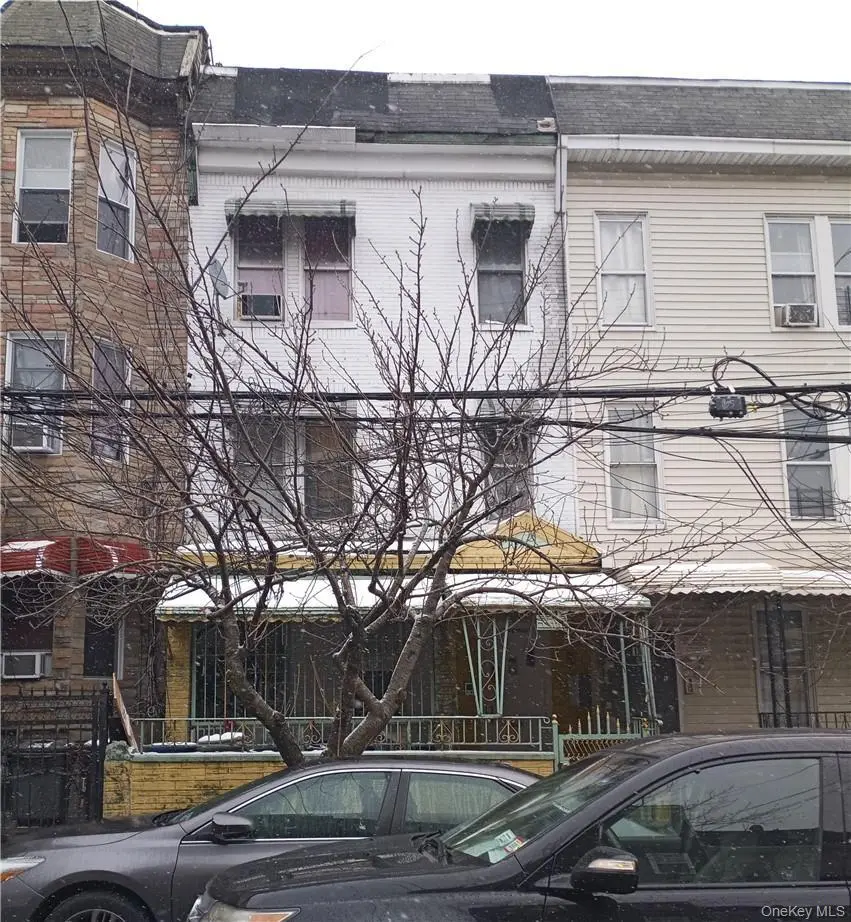
1316 Clay Ave · New York, NY
Flood risk 1/10 · Minimal
- FEMA flood zone
- X (unshaded)
- Chance of flooding over 30 yrs
- 0.0%
- Est. flood insurance / yr
- $507 – $1,088
Fire risk 1/10 · Minimal
- Est. fire insurance / yr
- $691 – $1,283
Heat risk 6/10 · Moderate
- Hot days now (above 99°F)
- 7 days/yr
- Hot days in 30 yrs
- 15 days/yr
Wind risk 6/10 · Moderate
- Chance of severe wind over 30 yrs
- 27.0%
Air-quality risk 4/10 · Minor
- Unhealthy air days now
- 5 days/yr
- Unhealthy air days in 30 yrs
- 6 days/yr
Risk factors via First Street. Map © Google.
Why this score? — see what drove the C+ grade
The composite is a weighted blend of 9 inputs, each scored 0–100. Each bar is that input's sub-score; the figure is the points it added to the 100-point composite (weight × sub-score).
- ARV discount +15.0/15.0
- Cash flow +13.9/30.0
- Appreciation +9.3/10.0
- Schools +5.0/10.0
- DSCR +4.2/10.0
- 1% rule +3.9/10.0
- Livability +3.8/5.0
- Rent growth +2.5/5.0
- Condition / age +2.5/5.0
$700,000
🖨 Deal sheet (PDF) 📄 Offer letter ✓ Due diligence
Multi-family units
County records classify this as Multi-Family (2-4 Unit). Listing-text estimate: 2 units. confirmed
Listing remarks
Presenting a unique opportunity, this property, currently offered as a short sale, beckons you to envision its untapped potential. Although there is no direct interior access at the moment, this two-family residence provides a canvas for your creativity. Seize the chance to reimagine and unlock the hidden value within. The property comprises two distinct units. The second floor features 3 bedrooms, a living room, an eat-in kitchen, and a bathroom. On the first floor, you'll find 3 bedrooms, a living room, a kitchen, and a bathroom. The full finished basemen with bthroom, equipped with front and back doors, adds an extra dimension to the living space. This short sale is being offered "A
Key facts
- 1,520 sq ft lot
- Built 1910
- Listed 438 days
Property features AI
Exterior
- Parking: No carport; No designated parking
- Utilities: Electric service by Con-Edison; Public sewer; Public trash collection
- Home design: Duplex
- Exterior features: Not waterfront; No additional parcels
Interior
- Bedrooms: Two 3-bedroom units
- Bathrooms: Two full bathrooms
- Heating & cooling: Baseboard heating; Natural gas heating; No central cooling
- Interior features: Basement
Neighborhood map
What this means for you Summary
Snapshot
- This is a 2 × 3-bed/1.0-bath units multifamily listed at $700k.
Deal economics
- At list price, monthly cash flow is $77 ($925/yr) — positive. Per door: $39/mo.
- The deal already cash-flows at list — no discount required.
- To meet the 1% rule (rent ≥ 1% of price), the offer needs to be $622k (11.1% below list).
- Recommended offer: $616k (12.0% below list) — sets the bar for market timing.
- Cap rate 6.4% vs local median 2.6% in New York — top-decile yield for the area; either an underpriced asset or a hidden risk that comps aren't pricing in. Stress-test before assuming the spread holds.
Location & tenants
- Location reads 75/100 on livability (#268 in NY, #4,188 nationally) — a middle-class / working-renter tenant base. Strengths: amenities A+, commute A+, health & safety A; Watch: crime F, cost of living F.
- Zoned schools: Elm Tree Elementary School (math 27% / reading 52%, grade F, #1,444 of 2,108 statewide, top 71%, 806 students, 94% FRL); Jhs 383 Philippa Schuyler (math 32% / reading 67%, grade C, #280 of 729 statewide, top 40%, 822 students, 85% FRL); Midwood High School (math 94% / reading 96%, grade A+, #83 of 1,100 statewide, top 8%, 4,062 students, 73% FRL).
- Market conditions: 52 active listings in the ZIP; lower-income renter base — watch delinquency; 6,929 units permitted in Bronx County in 2024 (6,829 in 5+ unit buildings).
- At $6,221/mo this rent would consume 214% of the median local household income ($35k/yr) (locally 11195% of renters already pay >50% of income on rent) — very limited rent-growth headroom before tenants either downsize or default.
Forward outlook
- In year one you build about $65k of equity ($5k loan paydown + $60k appreciation (8.6% local appreciation)).
- Bronx County population projected at +21% by 2050 — long-run rental-demand tailwind backs the buy-and-hold thesis.
- At projected returns (8.6% appreciation + 3.0% rent growth), your $196k cash investment doubles in ~3 years — after that, you're playing with house money.
- By year 2, paydown + projected appreciation supports a ~$104k cash-out refi (75% LTV) — recoverable capital for the next deal without selling this one.
Negotiation context
- It's been on market 438 days — a 12% lower offer ($616k) is reasonable based on typical stale-listing flexibility.
- 4 sale attempts since 8y ago; this cycle's ask is 17% above the opening price — seller raised mid-cycle; expect resistance to lowballs.
Risks & watch-outs
- Watch-outs: built in 1910 — expect roof / HVAC / electrical / plumbing capex.
- Climate carrying-cost: major wind risk, 27% chance of damaging wind over 30y; extreme-heat days projected 7→15/yr by 2055 (HVAC capex compounding) — expect insurance premiums to compound above CPI over the hold.
Questions for the listing agent
- It's been on market 438 days. Have you received any prior offers? Is the seller open to a 12% concession, seller financing, or rate buy-down credit?
- Can we see the unit-by-unit rent roll, current vacancy, and any below-market leases? What's the average tenancy length?
- What capital expenditures (roof, boiler, parking lot, exteriors) have been made in the last 5 years, and what's planned in the next 2?
- Built in 1910 — when were the roof, HVAC, electrical panel, plumbing, and water heater last replaced?
- Why hasn't it sold? Are there any deal-killer items the seller is aware of (foundation, flood, title, zoning, code violations)?
- Is there a deadline driving the sale (1031 exchange, divorce, estate, relocation)? That informs how much negotiation room exists.
- Schools are B-rated — typically a magnet for longer-tenancy family renters. What's the average tenant stay here, and is there a school-zone premium baked into asking?
- Crime grade is F in this area — have there been break-ins, vandalism, or insurance claims at this property in the last 3 years? What carrier currently insures it and at what premium?
- What's the average days-on-market for RENTAL listings here right now (not sales)? A rising rental-DOM trend means longer vacancies and softer asking-rent achievability than the comps imply.
- What's the recent tenant-quality profile in this submarket — average credit score on applications, eviction rate, late-payment / NSF rate, and stable-employment percentage? A property-management company in the area should have these aggregated.
- How much new apartment / multifamily construction is in the pipeline within 1–3 miles? Heavy new supply (>2% of stock underway) typically softens rents 12–24 months out; light construction supports rent growth.
Investment metrics
- 1% rule
- 0.89% ✗
- Cap rate
- 6.43%
- Cash-on-cash
- 0.47%
- DSCR
- 1.02
- GRM
- 9.4
CMA / ARV
- ARV (on-the-fly)
- $902,778
- Comps found
- 4
Show comp detail 4 sales within ~0.75 mi
| Address | Dist | Beds/Ba | Sqft | Sold | Price | $/sf | Match |
|---|---|---|---|---|---|---|---|
| 1417 Crotona Ave | 0.56mi | 7/2.0 (+1) | 2,410 (+1%) | 4mo | $850,000 | $353 | 64 |
| 1312 Findlay Ave | 0.10mi | 6/5.0 | 2,160 (-9%) | 6mo | $850,000 | $394 | 63 |
| 769 E 168th St | 0.56mi | 5/5.0 (-1) | 2,400 (+1%) | 18mo | $910,000 | $379 | 40 |
| 1049 Trinity Ave | 0.60mi | 6/3.0 | 2,655 (+12%) | 13mo | $700,000 | $264 | 38 |
Match score weights: distance 35% · size 25% · config 20% · recency 20%. Top-matched comps best support the ARV.
Projected returns pro-forma
8.55% appreciation · 3.0% rent growth · sell at horizon
- IRR
- 21.6%
- Equity multiple
- 2.62×
- Total profit
- $318,258
- Equity at exit
- $558,294
- IRR
- 19.7%
- Equity multiple
- 5.70×
- Total profit
- $921,792
- Equity at exit
- $1,134,470
Cash invested: $196,000 (down + closing). Projections, not guarantees.
Landlord ↔ Tenant lean methodology
- Overall (CITY)
- 0 Strongly Tenant-Friendly
- State New York
- 15 Strongly Tenant-Friendly · D+10
- County
- — inherits STATE
- City New York
- 0 Strongly Tenant-Friendly · D+34
ZIP-level market 10456
- Home prices YoY
- 3.0%
- Active inventory
- 52
- Price-to-rent
- 18.8×
Monthly cashflow live
- Estimated rent
- $6,221 medium interval (Pro) →
- Mortgage (P&I)
- −$3,671
- Tax est. 1.5%
- −$875 /mo · $10,500/yr
- Insurance
- −$292
- HOA
- −$0
- Vacancy / Maint / Mgmt
- −$1,306
- Net cashflow
- $77
Break-even live
Sensitivity live
| Price | -10% $561 | -5% $319 | +0% $77 | +5% $-165 | +10% $-407 |
|---|---|---|---|---|---|
| Rent | -10% $-414 | -5% $-169 | +0% $77 | +5% $323 | +10% $569 |
| Rate | -1.0pp $430 | -0.5pp $255 | base $77 | +0.5pp $-104 | +1.0pp $-289 |
2-unit breakdown (identical units grouped — click to expand)
| Units | Beds | Baths | Est. rent |
|---|---|---|---|
| 2× units | 3 | 1 | $6,220 |
| #1 | 3 | 1 | $3,110 |
| #2 | 3 | 1 | $3,110 |
| Total (2 units) | $6,221 | ||
UW: 25.0% down · 7.5% · 30yr · 1.5% tax · 5.0% vac · 8.0% maint · 8.0% mgmt
Financing live
Cash to close
- Down payment
- $175,000
- Closing costs
- $21,000
- Reserves months
- —
- Total cash needed
- —
Loan-product check · same deal, 3 products live
Conventional
25% down · 7.5% · 30yr
- Down + closing
- —
- Monthly P&I
- —
- Monthly cashflow
- —
- DSCR
- —
- Eligible?
- —
Personal DTI + credit; lowest rate.
DSCR
20% down · 8.5% · 30yr
- Down + closing
- —
- Monthly P&I
- —
- Monthly cashflow
- —
- DSCR
- —
- Eligible?
- —
No personal income docs; deal must DSCR.
Hard money
10% down · 12.0% · 12mo
- Down + closing
- —
- Monthly P&I
- —
- Monthly cashflow
- —
- DSCR
- —
- Eligible?
- —
Short-term bridge; refi at stabilization.
Listing history 18 events
-
2026-06-21days on market $700,000 Active 438 DOM
-
2026-06-18days on market $700,000 Active 435 DOM
-
2026-06-17days on market $700,000 Active 434 DOM
-
2026-06-15days on market $700,000 Active 432 DOM
-
2026-06-13days on market $700,000 Active 430 DOM
-
2026-06-10days on market $700,000 Active 426 DOM
-
2026-06-08days on market $700,000 Active 425 DOM
-
2026-06-03days on market $700,000 Active 420 DOM
-
2026-06-01days on market $700,000 Active 418 DOM
-
2026-05-31days on market $700,000 Active 417 DOM
-
2025-10-21status Active
-
2024-08-04price $700,000
-
2024-01-23$600,000 Active
-
2019-07-08historical
-
2019-01-30$475,000 Active
-
2019-01-01historical
-
2018-08-30price $475,000
-
2018-08-16$499,000 Active
ⓘ Source: listings_history table (triggers on properties + properties_extension) + one-shot
backfill from property_details.listing_events for pre-trigger history.
Climate risk First Street
- Flood 1/10 Low FEMA zone X (unshaded) · 0% chance over 30 yrs
- Wildfire 1/10 Low
- Heat 6/10 Major 7 d/yr ≥99°F today · 15 d/yr by 30 yrs out
- Wind 6/10 Major 27% chance of damaging wind over 30 yrs
- Air quality 4/10 Moderate 5 unhealthy d/yr today · 6 by 30 yrs out
Nearby sold comps map
Loading sold comps map…
Walkable amenities ~0.75 mi
Loading nearby amenities…
Taxation est. · year 1
- Rental income
- $74,652
- − Mortgage interest
- −$39,211
- − Property taxes
- −$10,500
- − Insurance
- −$3,500
- − Repairs & maintenance
- −$5,972
- − Management
- −$5,972
- − Depreciation
- −$20,364
- Taxable loss
- −$10,867
- Est. tax savings @ 24.0%
- +$2,608
- After-tax cash flow
- $3,533/yr
For passive investors: Depreciation is non-cash, so a rental often shows a tax loss while cash-flowing — sheltering income. Rental losses are passive: they offset passive income freely, and up to $25,000/yr can offset ordinary (W-2) income if you actively participate and your MAGI is under $100k (phasing out to $0 by $150k); unused losses carry forward. On sale, claimed depreciation is recaptured at up to 25%, and gains may owe capital-gains tax (a 1031 exchange can defer both). Figures are a year-1 estimate at your 24.0% rate — not tax advice; consult a CPA.
Schools (NCES district)
No district data.
Livability — New York
- Score
- 75/100
- State rank
- #268
- US rank
- #4188
Category grades
Schools grade is shown separately in the Schools card above.
Census & demographics
- Census place
- New York, NY
- County
- Bronx County · 1,197,324 people
- City population
- 7,731,280
- Metro
- New York-Newark-Jersey City, NY-NJ-PA
- Population (ZIP)
- 87,533
- Household income
- $34,954
- Rent vs Own
- Severe rent burden
- 11195.0
Population outlook (Bronx County) Hauer SSP2
- Today (2025)
- 1,607,353 people
- By 2030
- 1,681,852 · +4.6%
- By 2040
- 1,824,421 · +13.5%
- By 2050
- 1,945,470 · +21.0%
- By 2075
- 2,187,887 · +36.1%
- By 2100
- 2,244,136 · +39.6%
Race, ethnicity, and origin ACS 2023
- Neighborhood character
- Diverse neighborhood (Simpson 0.56)
- Race & ethnicity
- Hispanic / Latino 52% Black 41% Two or more races 14% White 3% Native American 1%
- Hispanic origin (detail)
- Mexican 3% Puerto Rican 15% Dominican 26%
- Foreign-born
- 30% · Canada, Jamaica
- Languages at home
- 44% English-only · Spanish 44% French/Haitian/Cajun 3% Other Indo-European 1%
Political lean MEDSL · Bronx
- 2024 margin
- Solid D (+45.4) · D 72.7% · R 27.3%
- 2008→2024 swing
- -32.3pp toward R · 2008: 77.8pp · 2024: 45.4pp
- All cycles
- 2024: D+45.4 2020: D+67.6 2016: D+79.1 2012: D+82.9 2008: D+77.8
Not yet ingested
- Civics
- —
Market trends
- HPI YoY
- ▲ 8.55%
- Current HPI
- 293.766
- Rent YoY
- —
- Metro
- New York-Newark-Jersey City, NY-NJ-PA
- State GDP YoY
- ▲ 2.60%
- F500 in state
- 92
Industry mix (Fortune 500 HQ in NY)
| Industry | F500 HQs | Revenue |
|---|---|---|
| Financial Services | 10 | $950B |
|
||
| Consumer Goods | 9 | $162B |
|
||
| Insurance | 4 | $225B |
|
||
| Telecommunications | 2 | $144B |
|
||
| Pharmaceuticals | 2 | $112B |
|
||
| Media / Entertainment | 2 | $69B |
|
||
Price history
+40.3% since first listed8 events — show timeline
- 2025-10-21 Relisted — OneKey® MLS as Distributed by MLS Grid
- 2024-08-04 Price Changed $700,000 OneKey® MLS as Distributed by MLS Grid
- 2024-01-23 Listed $600,000 OneKey® MLS as Distributed by MLS Grid
- 2019-07-08 Listing Removed — OneKey® MLS as Distributed by MLS Grid
- 2019-01-30 Listed $475,000 OneKey® MLS as Distributed by MLS Grid
- 2019-01-01 Listing Removed — OneKey® MLS as Distributed by MLS Grid
- 2018-08-30 Price Changed $475,000 OneKey® MLS as Distributed by MLS Grid
- 2018-08-16 Listed $499,000 OneKey® MLS as Distributed by MLS Grid
Cash-flow waterfall
monthlySold comps — $/sqft
last 12 mo · ≤1 miLoading sold comps…