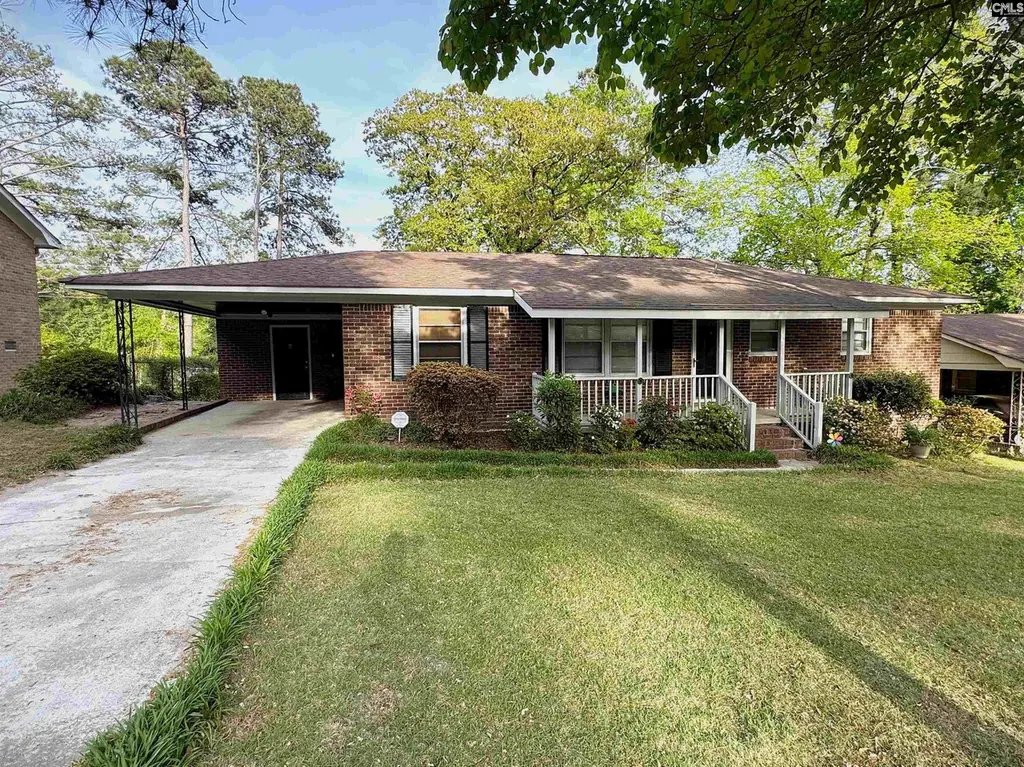
1731 Cermack St · Woodfield, SC
Flood risk 1/10 · Minimal
- FEMA flood zone
- X (unshaded)
- Chance of flooding over 30 yrs
- 0.0%
- Est. flood insurance / yr
- $507 – $1,088
Fire risk 3/10 · Minor
- Est. fire insurance / yr
- $783 – $1,453
Heat risk 6/10 · Moderate
- Hot days now (above 108°F)
- 7 days/yr
- Hot days in 30 yrs
- 16 days/yr
Wind risk 6/10 · Moderate
- Chance of severe wind over 30 yrs
- 69.0%
Air-quality risk 3/10 · Minor
- Unhealthy air days now
- 2 days/yr
- Unhealthy air days in 30 yrs
- 2 days/yr
Risk factors via First Street. Map © Google.
Why this score? — see what drove the C- grade
The composite is a weighted blend of 9 inputs, each scored 0–100. Each bar is that input's sub-score; the figure is the points it added to the 100-point composite (weight × sub-score).
- Cash flow +17.4/30.0
- ARV discount +13.5/15.0
- DSCR +5.4/10.0
- Schools +3.6/10.0
- 1% rule +3.3/10.0
- Livability +3.2/5.0
- Rent growth +2.6/5.0
- Condition / age +2.5/5.0
- Appreciation +0.0/10.0
$184,500
🖨 Deal sheet (PDF) 📄 Offer letter ✓ Due diligence
Listing remarks
Welcome to 1731 Cermack Street in Northeast Columbia—a charming, move-in ready home that blends comfort, convenience, and character. This beautifully maintained all-brick home is in meticulous condition and has 1,170 sq ft of inviting living space with 3 bedrooms and 1.5 bathrooms. Inside, you’ll find gleaming hardwood floors, updated bathrooms, ceiling fans throughout, and built-in shelving in the living room, providing both style and functionality. Major updates include a newer roof and HVAC system, giving peace of mind for years to come. Step outside and enjoy the best of Southern living. The rocking chair front porch is perfect for sipping your morning coffee or relaxing wit
Key facts
- Built in shelving
- Newer roof
- Ceiling fans
Tags
Property features AI
Exterior
- Parking: Attached carport; One garage space
- Utilities: Public water; Public sewer
- Home design: Single-story home; Faces west; Crawlspace foundation
- Construction: Crawlspace foundation; Brick-all-sides exterior
- Exterior features: Brick exterior above foundation; Rear chain-link fence; Paved road access
Interior
- Kitchen: Eat-in kitchen; Stained wood cabinets; Refrigerator
- Bedrooms: Primary bedroom on the main level with a private closet
- Bathrooms: One full bath; One half bath
- Heating & cooling: Central heating; Central air conditioning
- Interior features: Living room with built-in bookshelves; Covered front porch; Tankless water heater
- Laundry & utility: Utility room with washer and dryer included
Neighborhood map
What this means for you Summary
Snapshot
- This is a 3-bed/2.0-bath single-family listed at $184k.
Deal economics
- At list price, monthly cash flow is $139 ($2k/yr) — positive.
- The deal already cash-flows at list — no discount required.
- To meet the 1% rule (rent ≥ 1% of price), the offer needs to be $154k (16.5% below list).
- Recommended offer: $154k (16.5% below list) — sets the bar for 1% rule.
Location & tenants
- Location reads 63/100 on livability (#165 in SC) — a middle-class / working-renter tenant base. Strengths: cost of living A+, housing A+; Watch: employment D+, crime D-, amenities F.
- Richland 02 (suburban): math 35% / reading 47% proficiency, ranked #29 of 80 in SC (top 36%) — families likely to look elsewhere, expect single-tenant / working-renter base with shorter leases.
- Zoned schools: L. W. Conder Elementary (math 18% / reading 19%, grade F, #506 of 597 statewide, top 85%, 462 students, 100% FRL); Dent Middle (math 25% / reading 42%, grade F, #113 of 229 statewide, top 50%, 1,018 students, 100% FRL); Richland Northeast High (math 42% / reading 82%, grade B-, #99 of 196 statewide, top 53%, 1,359 students, 70% FRL) — zoned schools average 90% FRL vs 38% district-wide (52 pts higher); higher-poverty schools than district average — tighter screening recommended.
- Market conditions: Rents flat; 341 active listings in the ZIP; 21 comparable units currently listed for rent nearby; rentals at typical pace (median 26d on market — plan ~3-4 weeks tenant-placement turnaround); 3,472 units permitted in Richland County in 2024 (1,096 in 5+ unit buildings).
Forward outlook
- Local home prices are declining (-3.0%/yr); year-one equity from $1k of loan paydown is wiped out by about $6k of value loss. Plan a longer hold.
- Richland County population projected at +30% by 2050 — long-run rental-demand tailwind backs the buy-and-hold thesis.
Negotiation context
- It's been on market 65 days — a 6% lower offer ($173k) is reasonable based on typical stale-listing flexibility.
- Current owner paid $50k; list at $184k implies a 269% gain — meaningful room to come down on a strong offer.
Risks & watch-outs
- Climate carrying-cost: major wind risk, 69% chance of damaging wind over 30y; extreme-heat days projected 7→16/yr by 2055 (HVAC capex compounding) — expect insurance premiums to compound above CPI over the hold.
Questions for the listing agent
- It's been on market 65 days. Have you received any prior offers? Is the seller open to a 17% concession, seller financing, or rate buy-down credit?
- Built in 1966 — when were the roof, HVAC, electrical panel, plumbing, and water heater last replaced?
- Why hasn't it sold? Are there any deal-killer items the seller is aware of (foundation, flood, title, zoning, code violations)?
- Is there a deadline driving the sale (1031 exchange, divorce, estate, relocation)? That informs how much negotiation room exists.
- Schools are D-rated, which usually means shorter tenancies and higher turnover. Who's the typical renter profile here, and what's been the actual vacancy rate?
- Crime grade is D in this area — have there been break-ins, vandalism, or insurance claims at this property in the last 3 years? What carrier currently insures it and at what premium?
- What's the average days-on-market for RENTAL listings here right now (not sales)? A rising rental-DOM trend means longer vacancies and softer asking-rent achievability than the comps imply.
- What's the recent tenant-quality profile in this submarket — average credit score on applications, eviction rate, late-payment / NSF rate, and stable-employment percentage? A property-management company in the area should have these aggregated.
- How much new for-sale + rental construction is in the pipeline within 1–3 miles? Heavy new supply typically softens prices + rents 12–24 months out; constrained supply supports both.
Investment metrics
- 1% rule
- 0.83% ✗
- Cap rate
- 7.20%
- Cash-on-cash
- 3.23%
- DSCR
- 1.14
- GRM
- 10.0
CMA / ARV
- ARV (on-the-fly)
- $212,940
- Comps found
- 1
Show comp detail 1 sale within ~0.75 mi
| Address | Dist | Beds/Ba | Sqft | Sold | Price | $/sf | Match |
|---|---|---|---|---|---|---|---|
| 1615 Long Shadow Ln | 0.14mi | 3/2.0 | 1,091 (-7%) | 15mo | $199,000 | $182 | 70 |
Match score weights: distance 35% · size 25% · config 20% · recency 20%. Top-matched comps best support the ARV.
Projected returns pro-forma
-3.0% appreciation · 0.21% rent growth · sell at horizon
- IRR
- -14.0%
- Equity multiple
- 0.51×
- Total profit
- $-25,337
- Equity at exit
- $27,510
- IRR
- -9.7%
- Equity multiple
- 0.47×
- Total profit
- $-27,372
- Equity at exit
- $15,952
Cash invested: $51,660 (down + closing). Projections, not guarantees.
Landlord ↔ Tenant lean methodology
- Overall (STATE)
- 90 Strongly Landlord-Friendly
- State South Carolina
- 90 Strongly Landlord-Friendly · R+6
- County
- — inherits STATE
- City
- — inherits STATE
ZIP-level market 29223
- Rents YoY
- 0.2%
- Active inventory
- 341
- Price-to-rent
- 10.0×
Monthly cashflow live
- Estimated rent
- $1,540 high interval (Pro) →
- Mortgage (P&I)
- −$968
- Tax from tax record
- −$33 /mo · $399/yr
- Insurance
- −$77
- HOA
- −$0
- Vacancy / Maint / Mgmt
- −$323
- Net cashflow
- $139
Break-even live
Sensitivity live
| Price | -10% $244 | -5% $191 | +0% $139 | +5% $87 | +10% $-186 |
|---|---|---|---|---|---|
| Rent | -10% $17 | -5% $78 | +0% $139 | +5% $200 | +10% $261 |
| Rate | -1.0pp $232 | -0.5pp $186 | base $139 | +0.5pp $91 | +1.0pp $43 |
UW: 25.0% down · 7.5% · 30yr · 1.5% tax · 5.0% vac · 8.0% maint · 8.0% mgmt
Financing live
Cash to close
- Down payment
- $46,125
- Closing costs
- $5,535
- Reserves months
- —
- Total cash needed
- —
Loan-product check · same deal, 3 products live
Conventional
25% down · 7.5% · 30yr
- Down + closing
- —
- Monthly P&I
- —
- Monthly cashflow
- —
- DSCR
- —
- Eligible?
- —
Personal DTI + credit; lowest rate.
DSCR
20% down · 8.5% · 30yr
- Down + closing
- —
- Monthly P&I
- —
- Monthly cashflow
- —
- DSCR
- —
- Eligible?
- —
No personal income docs; deal must DSCR.
Hard money
10% down · 12.0% · 12mo
- Down + closing
- —
- Monthly P&I
- —
- Monthly cashflow
- —
- DSCR
- —
- Eligible?
- —
Short-term bridge; refi at stabilization.
Rent comps 21 comps
| Address | Beds | Baths | Sqft | Rent | $/sqft | DOM | Units | Dist |
|---|---|---|---|---|---|---|---|---|
| 1633 Overhill Rd Columbia, SC | 3.0 | 1.5 | 1052 | $1,661 | $1.58 | 25d | 1 | 0.16mi |
| 3611 Ranch Rd Columbia, SC | 2.0–3.0 | 2.0 | 1400 | $1,400 | $1.00 | 5d | 3 | 0.34mi |
| 2102 Long Shadow Ln Columbia, SC | 2.0 | 1.5 | 1150 | $1,300 | $1.13 | 5d | 1 | 0.37mi |
| 1630 Edgemore Rd Unit 1 Columbia, SC | 3.0 | 2.0 | 1225 | $1,650 | $1.35 | 25d | 1 | 0.38mi |
| 3630 Ranch Rd Unit 3-8 Columbia, SC | 2.0 | 2.0 | 1400 | $1,250 | $0.89 | 25d | 1 | 0.39mi |
| 1930 Greenoaks Rd Unit A Columbia, SC | 2.0 | 1.5 | 900 | $1,175 | $1.31 | 13d | 1 | 0.43mi |
| 7006 Brookfield Rd Columbia, SC | 1.0–3.0 | 1.0–2.0 | 1090 | $1,295 | $1.19 | 13d | 7 | 0.64mi |
| 1817 E Boundary Rd Columbia, SC | 4.0 | 2.0 | 1200 | $1,895 | $1.58 | 13d | 1 | 0.83mi |
| 7501 Brookfield Rd Columbia, SC | 1.0–3.0 | 1.0–2.5 | 1097 | $1,249 | $1.14 | 25d | 1 | 0.87mi |
| 300 Meredith Sq Columbia, SC | 2.0–3.0 | 2.0–2.5 | 1258 | $1,499 | $1.19 | 25d | 1 | 0.90mi |
| 3509 Lake Ave Columbia, SC | 1.0–3.0 | 1.0–2.0 | 1195 | $1,465 | $1.23 | 5d | 23 | 0.97mi |
| 7602 Hunt Club Rd Columbia, SC | 1.0–2.0 | 1.0–2.5 | 950 | $1,295 | $1.36 | 25d | 2 | 1.04mi |
| 7602 Hunt Club Rd Unit I-104 Columbia, SC | 2.0 | 2.5 | 1200 | $1,295 | $1.08 | 21d | 1 | 1.05mi |
| 7502 Hunt Club Rd Columbia, SC | 1.0–2.0 | 1.0–2.0 | 825 | $1,305 | $1.58 | 5d | 22 | 1.07mi |
| 7502 Hunt Club Rd Columbia, SC | 1.0–3.0 | 1.0–2.0 | 875 | $1,515 | $1.73 | 25d | 1 | 1.07mi |
| 7400 Hunt Club Rd Columbia, SC | 1.0–3.0 | 1.0–2.0 | 1087 | $1,200 | $1.10 | 25d | 1 | 1.14mi |
| 6905 Cleaton Rd Columbia, SC | 3.0 | 2.5–3.0 | 1546 | $1,925 | $1.25 | 25d | 3 | 1.22mi |
| 308 Percival Rd Columbia, SC | 3.0 | 2.5 | 1360 | $1,395 | $1.03 | 25d | 1 | 1.42mi |
| 8720 Windsor Lake Blvd Columbia, SC | 1.0–3.0 | 1.0–2.0 | 967 | $1,415 | $1.46 | 25d | 15 | 1.43mi |
| 1725 Cheltenham Ln Columbia, SC | 3.0 | 2.0 | 1444 | $1,675 | $1.16 | 25d | 1 | 1.46mi |
| 202 Partridge Dr Columbia, SC | 3.0 | 2.0 | 1500 | $1,850 | $1.23 | 16d | 1 | 1.47mi |
Listing history 18 events
-
2026-06-22pricedays on market $184,500 Active 65 DOM
-
2026-06-18days on market $189,900 Active 62 DOM
-
2026-06-17days on market $189,900 Active 61 DOM
-
2026-06-16days on market $189,900 Active 60 DOM
-
2026-06-15days on market $189,900 Active 59 DOM
-
2026-06-14days on market $189,900 Active 57 DOM
-
2026-06-13days on market $189,900 Active 56 DOM
-
2026-06-10days on market $189,900 Active 54 DOM
-
2026-06-09days on market $189,900 Active 53 DOM
-
2026-06-08days on market $189,900 Active 52 DOM
-
2026-06-07days on market $189,900 Active 51 DOM
-
2026-06-05pricedays on market $189,900 Active 48 DOM
-
2026-06-03days on market $195,000 Active 47 DOM
-
2026-06-03days on market $195,000 Active 46 DOM
-
2026-06-01days on market $195,000 Active 45 DOM
-
2026-05-31days on market $195,000 Active 44 DOM
-
2026-04-16$195,000 Active
-
1990-03-02soldstatus $49,950
ⓘ Source: listings_history table (triggers on properties + properties_extension) + one-shot
backfill from property_details.listing_events for pre-trigger history.
Tax reassessment forecast SC · Resets to sale price
- Current annual tax
- $399 · $33/mo
- Projected year-2 tax
- $1,052 · $88/mo
- Expected delta
- +$653/yr (+$54/mo · 163.6%)
ⓘ Screening estimate from a state-policy table — verify with the county assessor before closing.
Climate risk First Street
- Flood 1/10 Low FEMA zone X (unshaded) · 0% chance over 30 yrs
- Wildfire 3/10 Moderate
- Heat 6/10 Major 7 d/yr ≥108°F today · 16 d/yr by 30 yrs out
- Wind 6/10 Major 69% chance of damaging wind over 30 yrs
- Air quality 3/10 Moderate 2 unhealthy d/yr today · 2 by 30 yrs out
Nearby sold comps map
Loading sold comps map…
Walkable amenities ~0.75 mi
Loading nearby amenities…
Taxation est. · year 1
- Rental income
- $18,484
- − Mortgage interest
- −$10,335
- − Property taxes
- −$399
- − Insurance
- −$922
- − Repairs & maintenance
- −$1,479
- − Management
- −$1,479
- − Depreciation
- −$5,367
- Taxable loss
- −$1,497
- Est. tax savings @ 24.0%
- +$359
- After-tax cash flow
- $2,030/yr
For passive investors: Depreciation is non-cash, so a rental often shows a tax loss while cash-flowing — sheltering income. Rental losses are passive: they offset passive income freely, and up to $25,000/yr can offset ordinary (W-2) income if you actively participate and your MAGI is under $100k (phasing out to $0 by $150k); unused losses carry forward. On sale, claimed depreciation is recaptured at up to 25%, and gains may owe capital-gains tax (a 1031 exchange can defer both). Figures are a year-1 estimate at your 24.0% rate — not tax advice; consult a CPA.
Schools (NCES district)
- District
- Richland 02
- NCES district ID
- 4503390
- Math proficiency
- 35% ▼ -15.00%
- Reading proficiency
- 47% ▼ -5.00%
- Median HH income
- $59,684
- Composite
- 36.2/100
- National rank
- #4730
- State rank
- #29 of 80 in SC
Livability — Woodfield
- Score
- 63/100
- State rank
- #165
- US rank
- #15019
Category grades
Schools grade is shown separately in the Schools card above.
Census & demographics
- Census place
- Woodfield, SC
- County
- Richland County · 389,530 people
- Metro
- Columbia, SC
- Population (ZIP)
- 53,074
- Household income
- $62,408
- Rent vs Own
- Severe rent burden
- 2857.0
Population outlook (Richland County) Hauer SSP2
- Today (2025)
- 459,667 people
- By 2030
- 487,524 · +6.1%
- By 2040
- 542,035 · +17.9%
- By 2050
- 595,371 · +29.5%
- By 2075
- 732,998 · +59.5%
- By 2100
- 820,415 · +78.5%
Race, ethnicity, and origin ACS 2023
- Neighborhood character
- Diverse neighborhood (Simpson 0.60)
- Race & ethnicity
- Black 57% White 23% Hispanic / Latino 11% Two or more races 6% Asian 4%
- Hispanic origin (detail)
- Mexican 5% Puerto Rican 2%
- Common ancestry
- Slovak 1% Serbian 1% Italian 1%
- Foreign-born
- 10% · Canada, South Korea
- Languages at home
- 86% English-only · Spanish 8% Other Indo-European 2% Korean 1%
Political lean MEDSL · Richland
- 2024 margin
- Solid D (+34.6) · D 66.4% · R 31.8% · Other 1.8%
- 2008→2024 swing
- +5.7pp toward D · 2008: 28.9pp · 2024: 34.6pp
- All cycles
- 2024: D+34.6 2020: D+38.3 2016: D+32.9 2012: D+33.3 2008: D+28.9
Not yet ingested
- Civics
- —
Market trends
- HPI YoY
- ▼ -135.96%
- Current HPI
- 195.3158
- Rent YoY
- ▲ 0.21%
- Metro
- Columbia, SC
- State GDP YoY
- ▲ 4.51%
- F500 in state
- 2
Industry mix (Fortune 500 HQ in SC)
| Industry | F500 HQs | Revenue |
|---|---|---|
| Packaging | 1 | $7B |
|
||
Price history
+290.4% since first listed2 events — show timeline
- 2026-04-16 Listed $195,000 Consolidated MLS
- 1990-03-02 Sold (Public Records) $49,950 Public Records
Property tax history
-6.0%/yrLatest (2025): $399 · +3.4% YoY. Source: county tax records.
Cash-flow waterfall
monthlySold comps — $/sqft
last 12 mo · ≤1 miLoading sold comps…