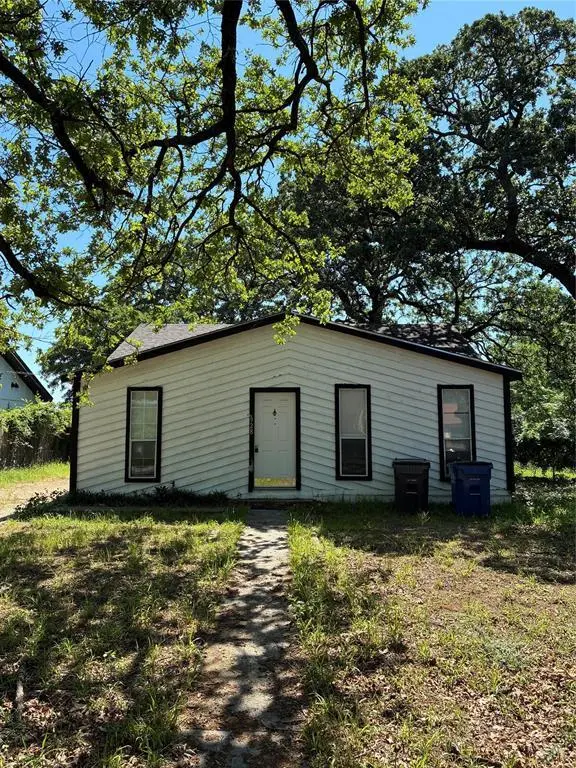
2928 Hiawatha Trl · Lake Worth, TX
Flood risk 1/10 · Minimal
- FEMA flood zone
- X (unshaded)
- Chance of flooding over 30 yrs
- 0.0%
- Est. flood insurance / yr
- $507 – $1,088
Fire risk 3/10 · Minor
- Est. fire insurance / yr
- $1,222 – $2,270
Heat risk 7/10 · Major
- Hot days now (above 109°F)
- 7 days/yr
- Hot days in 30 yrs
- 23 days/yr
Wind risk 4/10 · Minor
- Chance of severe wind over 30 yrs
- 24.0%
Air-quality risk 3/10 · Minor
- Unhealthy air days now
- 3 days/yr
- Unhealthy air days in 30 yrs
- 4 days/yr
Risk factors via First Street. Map © Google.
Why this score? — see what drove the B- grade
The composite is a weighted blend of 9 inputs, each scored 0–100. Each bar is that input's sub-score; the figure is the points it added to the 100-point composite (weight × sub-score).
- Cash flow +25.3/30.0
- ARV discount +15.0/15.0
- DSCR +8.3/10.0
- 1% rule +7.9/10.0
- Livability +3.6/5.0
- Rent growth +2.6/5.0
- Condition / age +2.5/5.0
- Schools +1.4/10.0
- Appreciation +0.0/10.0
$139,000
🖨 Deal sheet (PDF) 📄 Offer letter ✓ Due diligence
Listing remarks MLS
This home is completely remodeled in 06' with new carpet, paint inside and out, new counter tops, fixtures. Electrical and plumbing up to code. Too many adds to list here! Show your pickiest buyers this one.
Key facts
- Investment property
- Access to hwy 820
- No hoa
Tags
Property features AI
Finance
- Other: Possession at closing/funding; Property listing status: Active; Listing source: Matrix
- Financial info: Listing terms: Cash; Listing agreement: Exclusive right to sell; Second mortgage: None / No
- HOA & community: No homeowners association
Exterior
- Parking: Attached garage (1 covered space, 1 garage space)
- Utilities: City water; City sewer; No municipal utility district
- Home design: Single-family residence; Residential property; One story; Not attached to other properties; Built in 1946
- Construction: Year built: 1946
- Exterior features: Lot under 0.5 acre (approximately 0.20 acres); Subdivision: Indian Oaks; Directions: From TX-199 (Jacksboro Hwy), turn north onto Hiawatha Trail, continue about 0.3 miles into the neighborhood; property will be on the right
Interior
- Kitchen: Dishwasher; Microwave
- Bedrooms: 3 bedrooms (primary bedroom on main level)
- Bathrooms: 1 full bathroom
- Interior features: One-level layout; Walk-in closet(s); Other interior features; Open living area (1 living area); Total room count: 4
Neighborhood map
What this means for you Summary
Snapshot
- This is a 3-bed/1.0-bath single-family listed at $139k.
Deal economics
- At list price, monthly cash flow is $314 ($4k/yr) — positive.
- The deal already cash-flows at list — no discount required.
- Meets the 1% rule at list price ($2k rent vs $139k).
- Recommended offer: $135k (3.0% below list) — sets the bar for market timing.
- Cap rate 9.0% vs local median 5.3% in Lake Worth — top-decile yield for the area; either an underpriced asset or a hidden risk that comps aren't pricing in. Stress-test before assuming the spread holds.
Location & tenants
- Location reads 72/100 on livability (#269 in TX) — a middle-class / working-renter tenant base. Strengths: cost of living A+, housing A+, health & safety A+; Watch: crime F, commute F.
- Lake Worth ISD (suburban): math 12% / reading 22% proficiency, ranked #801 of 826 in TX (top 97%) — low school quality limits family demand, transient renter base, plan for 1-2y turnover; 73% free/reduced lunch — lower-income household profile, screen leases tightly.
- Zoned schools: Effie Morris Early Learning Academy (440 students, 93% FRL); Lucyle Collins Middle (math 13% / reading 21%, grade F, #1,520 of 1,662 statewide, top 92%, 793 students, 92% FRL); Lake Worth H S (math 13% / reading 31%, grade F, #1,366 of 1,632 statewide, top 84%, 996 students, 85% FRL) — zoned schools average 90% FRL vs 73% district-wide (17 pts higher); higher-poverty schools than district average — tighter screening recommended.
- Market conditions: Rents flat; 160 active listings in the ZIP; 11 comparable units currently listed for rent nearby; rentals lingering (median 46d on market — plan ~5-8 weeks vacancy on turnover, expect pricing pressure); 64% of comp listings sitting > 30 days — soft ceiling on asking rent; 18,938 units permitted in Tarrant County in 2024 (8,336 in 5+ unit buildings).
Forward outlook
- Local home prices are declining (-3.0%/yr); year-one equity from $961 of loan paydown is wiped out by about $4k of value loss. Plan a longer hold.
- Tarrant County population projected at +41% by 2050 — long-run rental-demand tailwind backs the buy-and-hold thesis.
Negotiation context
- It's been on market 52 days — a 3% lower offer ($135k) is reasonable based on typical stale-listing flexibility.
- 2 sale attempts since 19y ago; this cycle's ask has dropped $11k (7%) from the opening price — seller is motivated, your offer sets the floor, not the list.
- Current owner paid $96k; 45% above their basis — modest negotiation headroom, anchor on the comps not their cost.
Risks & watch-outs
- Watch-outs: property tax is 2.7% of price; built in 1946 — expect roof / HVAC / electrical / plumbing capex.
- Climate carrying-cost: extreme-heat days projected 7→23/yr by 2055 (HVAC capex compounding) — expect insurance premiums to compound above CPI over the hold.
Questions for the listing agent
- It's been on market 52 days. Have you received any prior offers? Is the seller open to a 3% concession, seller financing, or rate buy-down credit?
- Built in 1946 — when were the roof, HVAC, electrical panel, plumbing, and water heater last replaced?
- Property tax is high relative to price — has the assessment been appealed recently, and will the sale trigger a re-assessment?
- Is there a deadline driving the sale (1031 exchange, divorce, estate, relocation)? That informs how much negotiation room exists.
- Schools are F-rated, which usually means shorter tenancies and higher turnover. Who's the typical renter profile here, and what's been the actual vacancy rate?
- Crime grade is F in this area — have there been break-ins, vandalism, or insurance claims at this property in the last 3 years? What carrier currently insures it and at what premium?
- What's the average days-on-market for RENTAL listings here right now (not sales)? A rising rental-DOM trend means longer vacancies and softer asking-rent achievability than the comps imply.
- What's the recent tenant-quality profile in this submarket — average credit score on applications, eviction rate, late-payment / NSF rate, and stable-employment percentage? A property-management company in the area should have these aggregated.
- How much new for-sale + rental construction is in the pipeline within 1–3 miles? Heavy new supply typically softens prices + rents 12–24 months out; constrained supply supports both.
Investment metrics
- 1% rule
- 1.29% ✓
- Cap rate
- 9.01%
- Cash-on-cash
- 9.69%
- DSCR
- 1.43
- GRM
- 6.4
CMA / ARV
- ARV (median comp)
- $198,690
- List price
- $139,000
- Delta
- -30.04%
- Verdict
- UNDERPRICED
- Comps
- 20 within 1.0 mi
Show comp detail 10 sales within ~0.75 mi
| Address | Dist | Beds/Ba | Sqft | Sold | Price | $/sf | Match |
|---|---|---|---|---|---|---|---|
| 3116 Chippewa Trl | 0.18mi | 2/1.0 (-1) | 1,176 (+1%) | 13mo | $150,000 | $128 | 74 |
| 3132 Huron Trl | 0.28mi | 3/1.0 | 1,094 (-6%) | 17mo | $219,900 | $201 | 62 |
| 3208 Huron Trl | 0.32mi | 3/1.0 | 1,242 (+6%) | 16mo | $190,000 | $153 | 61 |
| 7213 Pawnee Trl | 0.42mi | 3/1.0 | 1,027 (-12%) | 3mo | $116,000 | $113 | 58 |
| 3345 Pueblo Trl | 0.50mi | 3/1.0 | 1,199 (+3%) | 18mo | $199,999 | $167 | 57 |
| 7521 Pawnee | 0.19mi | 2/2.0 (-1) | 1,025 (-12%) | 7mo | $139,900 | $136 | 56 |
| 3304 Chippewa Trl | 0.35mi | 2/1.0 (-1) | 1,274 (+9%) | 11mo | $259,000 | $203 | 54 |
| 2909 Huron Trl | 0.14mi | 2/1.0 (-1) | 992 (-15%) | 14mo | $85,000 | $86 | 52 |
| 3600 Mohawk Trl | 0.68mi | 3/1.5 | 1,169 (+0%) | 22mo | $240,000 | $205 | 48 |
| 3205 Caddo Trl | 0.56mi | 3/2.0 | 1,304 (+12%) | 3mo | $295,000 | $226 | 48 |
Match score weights: distance 35% · size 25% · config 20% · recency 20%. Top-matched comps best support the ARV.
Projected returns pro-forma
-3.0% appreciation · 0.48% rent growth · sell at horizon
- IRR
- -4.8%
- Equity multiple
- 0.82×
- Total profit
- $-6,824
- Equity at exit
- $20,725
- IRR
- 1.2%
- Equity multiple
- 1.08×
- Total profit
- $2,983
- Equity at exit
- $12,018
Cash invested: $38,920 (down + closing). Projections, not guarantees.
Landlord ↔ Tenant lean methodology
- Overall (STATE)
- 87 Strongly Landlord-Friendly
- State Texas
- 87 Strongly Landlord-Friendly · R+5
- County
- — inherits STATE
- City
- — inherits STATE
ZIP-level market 76135
- Home prices YoY
- -17.3%
- Rents YoY
- 0.5%
- Active inventory
- 160
- Price-to-rent
- 6.4×
Monthly cashflow live
- Estimated rent
- $1,796 high interval (Pro) →
- Mortgage (P&I)
- −$729
- Tax from tax record
- −$318 /mo · $3,812/yr
- Insurance
- −$58
- HOA
- −$0
- Vacancy / Maint / Mgmt
- −$377
- Net cashflow
- $314
Break-even live
Sensitivity live
| Price | -10% $393 | -5% $354 | +0% $314 | +5% $275 | +10% $236 |
|---|---|---|---|---|---|
| Rent | -10% $173 | -5% $243 | +0% $314 | +5% $385 | +10% $456 |
| Rate | -1.0pp $384 | -0.5pp $350 | base $314 | +0.5pp $278 | +1.0pp $242 |
UW: 25.0% down · 7.5% · 30yr · 1.5% tax · 5.0% vac · 8.0% maint · 8.0% mgmt
Financing live
Cash to close
- Down payment
- $34,750
- Closing costs
- $4,170
- Reserves months
- —
- Total cash needed
- —
Loan-product check · same deal, 3 products live
Conventional
25% down · 7.5% · 30yr
- Down + closing
- —
- Monthly P&I
- —
- Monthly cashflow
- —
- DSCR
- —
- Eligible?
- —
Personal DTI + credit; lowest rate.
DSCR
20% down · 8.5% · 30yr
- Down + closing
- —
- Monthly P&I
- —
- Monthly cashflow
- —
- DSCR
- —
- Eligible?
- —
No personal income docs; deal must DSCR.
Hard money
10% down · 12.0% · 12mo
- Down + closing
- —
- Monthly P&I
- —
- Monthly cashflow
- —
- DSCR
- —
- Eligible?
- —
Short-term bridge; refi at stabilization.
Rent comps 11 comps
| Address | Beds | Baths | Sqft | Rent | $/sqft | DOM | Units | Dist |
|---|---|---|---|---|---|---|---|---|
| 7521 Pawnee Trl Lake Worth, TX | 2.0 | 2.0 | 972 | $1,600 | $1.65 | 5d | 1 | 0.22mi |
| 3217 Huron Trl Fort Worth, TX | 3.0 | 2.0 | 1108 | $1,850 | $1.67 | 45d | 1 | 0.36mi |
| 7300 Comanche Trl Unit 4 Lake Worth, TX | 2.0 | 1.0 | 865 | $1,275 | $1.47 | 45d | 1 | 0.67mi |
| 3901 Dakota Trl Fort Worth, TX | 3.0 | 2.0 | 1481 | $1,990 | $1.34 | 1d | 1 | 1.03mi |
| 3901 Dakota Trl Fort Worth, TX | 3.0 | 2.0 | 1481 | $1,990 | $1.34 | 45d | 1 | 1.03mi |
| 4009 Shawnee Trl Fort Worth, TX | 3.0 | 2.0 | 1496 | $1,801 | $1.20 | 45d | 1 | 1.03mi |
| 4009 Caddo Trl Fort Worth, TX | 3.0 | 1.0 | 1237 | $1,850 | $1.50 | 45d | 1 | 1.06mi |
| 4025 Caddo Trl Fort Worth, TX | 3.0 | 2.0 | 1382 | $1,750 | $1.27 | 45d | 1 | 1.11mi |
| 7104 Foster Dr Fort Worth, TX | 4.0 | 2.0 | 1476 | $1,925 | $1.30 | 9d | 1 | 1.16mi |
| 6655 Calgary Ln Fort Worth, TX | 1.0–3.0 | 1.0–2.0 | 949 | $1,359 | $1.43 | 45d | 1 | 1.19mi |
| 6555 Shady Oaks Manor Dr Fort Worth, TX | 1.0–2.0 | 1.0–2.0 | 689 | $1,401 | $2.03 | 5d | 18 | 1.42mi |
Listing history 29 events
-
2026-06-21days on market $139,000 Active 52 DOM
-
2026-06-18days on market $139,000 Active 49 DOM
-
2026-06-17days on market $139,000 Active 48 DOM
-
2026-06-16days on market $139,000 Active 47 DOM
-
2026-06-15days on market $139,000 Active 46 DOM
-
2026-06-13days on market $139,000 Active 44 DOM
-
2026-06-13pricedays on market $139,000 Active 43 DOM
-
2026-06-09days on market $145,000 Active 40 DOM
-
2026-06-08days on market $145,000 Active 39 DOM
-
2026-06-07days on market $145,000 Active 38 DOM
-
2026-06-04days on market $145,000 Active 35 DOM
-
2026-06-03days on market $145,000 Active 34 DOM
-
2026-06-02days on market $145,000 Active 33 DOM
-
2026-06-01days on market $145,000 Active 32 DOM
-
2026-05-31days on market $145,000 Active 31 DOM
-
2026-05-11price $145,000 713-char remark
-
2026-04-30$150,000 Active 713-char remark
-
2022-01-15price $1,350
-
2016-01-19soldstatus
-
2008-12-04soldstatus $95,906
-
2007-06-15soldstatus 208-char remark
Show marketing remark (208 chars)
This home is completely remodeled in 06' with new carpet, paint inside and out, new counter tops, fixtures. Electrical and plumbing up to code. Too many adds to list here! Show your pickiest buyers this one.
-
2007-06-02historical 208-char remark
Show marketing remark (208 chars)
This home is completely remodeled in 06' with new carpet, paint inside and out, new counter tops, fixtures. Electrical and plumbing up to code. Too many adds to list here! Show your pickiest buyers this one.
-
2007-05-31$82,950 208-char remark
Show marketing remark (208 chars)
This home is completely remodeled in 06' with new carpet, paint inside and out, new counter tops, fixtures. Electrical and plumbing up to code. Too many adds to list here! Show your pickiest buyers this one.
-
2004-11-15soldstatus
-
2003-07-08soldstatus $56,500
-
2003-07-08soldstatus $56,500
-
2000-11-03soldstatus
-
1996-08-05soldstatus
-
1996-08-05soldstatus
ⓘ Source: listings_history table (triggers on properties + properties_extension) + one-shot
backfill from property_details.listing_events for pre-trigger history.
Tax reassessment forecast TX · Resets to sale price
- Current annual tax
- $3,812 · $318/mo
- Projected year-2 tax
- $3,812 · $318/mo
- Expected delta
- $0/yr ($0/mo · 0.0%)
ⓘ Screening estimate from a state-policy table — verify with the county assessor before closing.
Climate risk First Street
- Flood 1/10 Low FEMA zone X (unshaded) · 0% chance over 30 yrs
- Wildfire 3/10 Moderate
- Heat 7/10 Severe 7 d/yr ≥109°F today · 23 d/yr by 30 yrs out
- Wind 4/10 Moderate 24% chance of damaging wind over 30 yrs
- Air quality 3/10 Moderate 3 unhealthy d/yr today · 4 by 30 yrs out
Nearby sold comps map
Loading sold comps map…
Walkable amenities ~0.75 mi
Loading nearby amenities…
Taxation est. · year 1
- Rental income
- $21,554
- − Mortgage interest
- −$7,786
- − Property taxes
- −$3,812
- − Insurance
- −$695
- − Repairs & maintenance
- −$1,724
- − Management
- −$1,724
- − Depreciation
- −$4,044
- Taxable income
- $1,768
- Est. tax owed @ 24.0%
- −$424
- After-tax cash flow
- $3,349/yr
For passive investors: Depreciation is non-cash, so a rental often shows a tax loss while cash-flowing — sheltering income. Rental losses are passive: they offset passive income freely, and up to $25,000/yr can offset ordinary (W-2) income if you actively participate and your MAGI is under $100k (phasing out to $0 by $150k); unused losses carry forward. On sale, claimed depreciation is recaptured at up to 25%, and gains may owe capital-gains tax (a 1031 exchange can defer both). Figures are a year-1 estimate at your 24.0% rate — not tax advice; consult a CPA.
Schools (NCES district)
- District
- Lake Worth ISD
- NCES district ID
- 4826490
- Math proficiency
- 12% ▼ -13.00%
- Reading proficiency
- 22% ▼ -5.00%
- Median HH income
- $39,451
- Composite
- 14.38/100
- National rank
- #9436
- State rank
- #801 of 826 in TX
Livability — Lake Worth
- Score
- 72/100
- State rank
- #269
- US rank
- #6300
Category grades
Schools grade is shown separately in the Schools card above.
Census & demographics
- Census place
- Lake Worth, TX
- County
- Tarrant County · 2,033,669 people
- Metro
- Dallas-Fort Worth-Arlington, TX
- Population (ZIP)
- 19,445
- Household income
- $74,621
- Rent vs Own
- Severe rent burden
- 798.0
Population outlook (Tarrant County) Hauer SSP2
- Today (2025)
- 2,380,417 people
- By 2030
- 2,578,900 · +8.3%
- By 2040
- 2,974,995 · +25.0%
- By 2050
- 3,350,489 · +40.8%
- By 2075
- 4,216,909 · +77.2%
- By 2100
- 4,741,527 · +99.2%
Race, ethnicity, and origin ACS 2023
- Neighborhood character
- Majority White (63%)
- Race & ethnicity
- White 63% Hispanic / Latino 26% Two or more races 11% Black 8%
- Hispanic origin (detail)
- Mexican 22%
- Common ancestry
- Italian 2% Romanian 2% Russian 2%
- Foreign-born
- 7% · Canada, Jamaica
- Languages at home
- 80% English-only · Spanish 19% Russian/Polish/Slavic 1%
Political lean MEDSL · Tarrant
- 2024 margin
- Lean R (+5.1) · D 46.7% · R 51.9% · Other 1.4%
- 2008→2024 swing
- +6.6pp toward D · 2008: -11.7pp · 2024: -5.1pp
- All cycles
- 2024: R+5.1 2020: D+0.2 2016: R+8.7 2012: R+15.7 2008: R+11.7
Not yet ingested
- Civics
- —
Market trends
- HPI YoY
- ▼ -63.93%
- Current HPI
- 305.0929
- Rent YoY
- ▲ 0.48%
- Metro
- Dallas-Fort Worth-Arlington, TX
- State GDP YoY
- ▲ 3.95%
- F500 in state
- 110
Industry mix (Fortune 500 HQ in TX)
| Industry | F500 HQs | Revenue |
|---|---|---|
| Energy | 16 | $1,198B |
|
||
| Technology | 5 | $198B |
|
||
| Engineering / Construction | 4 | $72B |
|
||
| Energy Services | 3 | $60B |
|
||
| Utilities | 3 | $41B |
|
||
| Healthcare | 2 | $330B |
|
||
Price history
+146.0% since first listed15 events — show timeline
- 2026-06-10 Price Changed $139,000 NTREIS
- 2026-05-11 Price Changed $145,000 NTREIS
- 2026-04-30 Listed $150,000 NTREIS
- 2022-01-15 Price Changed $1,350 RENT.
- 2016-01-19 Sold (Public Records) — Public Records
- 2008-12-04 Sold (Public Records) $95,906 Public Records
- 2007-06-15 Sold (MLS) — NTREIS
- 2007-06-02 Listing Removed — NTREIS
- 2007-05-31 Listed $82,950 NTREIS
- 2004-11-15 Sold (Public Records) — Public Records
- 2003-07-08 Sold (Public Records) $56,500 Public Records
- 2003-07-08 Sold (Public Records) $56,500 Public Records
- 2000-11-03 Sold (Public Records) — Public Records
- 1996-08-05 Sold (Public Records) — Public Records
- 1996-08-05 Sold (Public Records) — Public Records
Property tax history
+5.4%/yrLatest (2025): $3,812 · -17.0% YoY. Source: county tax records.
Cash-flow waterfall
monthlySold comps — $/sqft
last 12 mo · ≤1 miLoading sold comps…