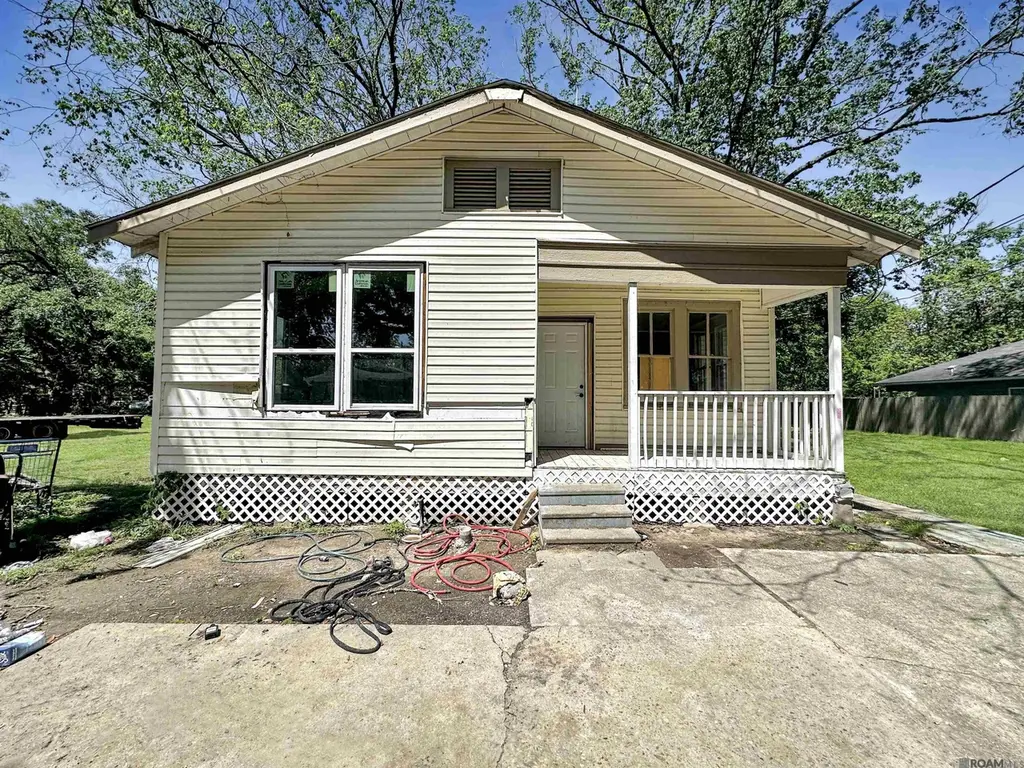
2388 Barber St · Baton Rouge, LA
Flood risk 4/10 · Minor
- FEMA flood zone
- A
- Chance of flooding over 30 yrs
- 0.22%
- Est. flood insurance / yr
- $1,009 – $1,996
Fire risk 1/10 · Minimal
- Est. fire insurance / yr
- $1,269 – $2,357
Heat risk 8/10 · Major
- Hot days now (above 108°F)
- 7 days/yr
- Hot days in 30 yrs
- 20 days/yr
Wind risk 9/10 · Severe
- Chance of severe wind over 30 yrs
- 99.0%
Air-quality risk 3/10 · Minor
- Unhealthy air days now
- 3 days/yr
- Unhealthy air days in 30 yrs
- 3 days/yr
Risk factors via First Street. Map © Google.
Why this score? — see what drove the B- grade
The composite is a weighted blend of 9 inputs, each scored 0–100. Each bar is that input's sub-score; the figure is the points it added to the 100-point composite (weight × sub-score).
- Cash flow +25.7/30.0
- ARV discount +15.0/15.0
- DSCR +8.5/10.0
- 1% rule +5.5/10.0
- Livability +3.7/5.0
- Rent growth +2.9/5.0
- Condition / age +2.5/5.0
- Schools +2.4/10.0
- Appreciation +0.0/10.0
$155,000
🖨 Deal sheet (PDF) 📄 Offer letter ✓ Due diligence
Listing remarks
Calling all buyers. This freshly remodeled home features a well-designed layout that includes a kitchen with a separate breakfast area, perfect for casual dining or morning coffee. Everything is brand new, roof and all. Located in a convenient area, you'll enjoy quick and easy access to major interstate exchanges, all the amenities you can think of from shopping to entertainment to fine dining and so much more, and downtown Baton Rouge. With its unbeatable location, this home is a must-see for first time homebuyers or anyone looking to live in the heart of Baton Rouge around all the excitement. Don't miss out on this excellent opportunity, schedule your showing today! Property back active d
Key facts
- Well-designed layout
- Brand new roof
- Access to shopping
Tags
Neighborhood map
What this means for you Summary
Snapshot
- This is a 3-bed/2.5-bath single-family listed at $155k.
Deal economics
- At list price, monthly cash flow is $244 ($3k/yr) — positive.
- The deal already cash-flows at list — no discount required.
- Meets the 1% rule at list price ($2k rent vs $155k).
- Recommended offer: $136k (12.0% below list) — sets the bar for market timing.
- Cap rate 9.2% vs local median 4.3% in Baton Rouge — top-decile yield for the area; either an underpriced asset or a hidden risk that comps aren't pricing in. Stress-test before assuming the spread holds.
Location & tenants
- Location reads 74/100 on livability (#24 in LA, #4,535 nationally) — a middle-class / working-renter tenant base. Strengths: commute A+, cost of living A+, health & safety A+; Watch: amenities D, crime F, employment D-.
- East Baton Rouge Parish (urban): math 22% / reading 34% proficiency, ranked #47 of 98 in LA (top 48%) — low school quality limits family demand, transient renter base, plan for 1-2y turnover; 77% free/reduced lunch — lower-income household profile, screen leases tightly.
- Market conditions: Rents rising (+1.5%/yr); 297 active listings in the ZIP; 30 comparable units currently listed for rent nearby; rentals at typical pace (median 20d on market — plan ~3-4 weeks tenant-placement turnaround); 2,252 units permitted in East Baton Rouge Parish in 2024 (440 in 5+ unit buildings).
Forward outlook
- Local home prices are declining (-3.0%/yr); year-one equity from $1k of loan paydown is wiped out by about $5k of value loss. Plan a longer hold.
- East Baton Rouge County population projected at +4% by 2050 — modest demand growth; plan on rents tracking national, not racing it.
Negotiation context
- It's been on market 153 days — a 12% lower offer ($136k) is reasonable based on typical stale-listing flexibility.
- 22 sale attempts since 25y ago; this cycle's ask has dropped $30k (16%) from the opening price — seller is motivated, your offer sets the floor, not the list.
- Current owner paid $60k; list at $155k implies a 158% gain — meaningful room to come down on a strong offer.
Risks & watch-outs
- Watch-outs: flood insurance adds $125/mo; built in 1950 — expect roof / HVAC / electrical / plumbing capex.
- Climate carrying-cost: in FEMA flood zone A (mandatory federal flood insurance); severe wind risk, 99% chance of damaging wind over 30y; extreme-heat days projected 7→20/yr by 2055 (HVAC capex compounding) — expect insurance premiums to compound above CPI over the hold.
Questions for the listing agent
- It's been on market 153 days. Have you received any prior offers? Is the seller open to a 12% concession, seller financing, or rate buy-down credit?
- Built in 1950 — when were the roof, HVAC, electrical panel, plumbing, and water heater last replaced?
- What's the actual annual flood-insurance premium (NFIP or private), and is the property in a SFHA with mandatory coverage?
- Why hasn't it sold? Are there any deal-killer items the seller is aware of (foundation, flood, title, zoning, code violations)?
- Is there a deadline driving the sale (1031 exchange, divorce, estate, relocation)? That informs how much negotiation room exists.
- Crime grade is F in this area — have there been break-ins, vandalism, or insurance claims at this property in the last 3 years? What carrier currently insures it and at what premium?
- What's the average days-on-market for RENTAL listings here right now (not sales)? A rising rental-DOM trend means longer vacancies and softer asking-rent achievability than the comps imply.
- What's the recent tenant-quality profile in this submarket — average credit score on applications, eviction rate, late-payment / NSF rate, and stable-employment percentage? A property-management company in the area should have these aggregated.
- How much new for-sale + rental construction is in the pipeline within 1–3 miles? Heavy new supply typically softens prices + rents 12–24 months out; constrained supply supports both.
Investment metrics
- 1% rule
- 1.05% ✓
- Cap rate
- 9.15%
- Cash-on-cash
- 10.22%
- DSCR
- 1.45
- GRM
- 7.9
CMA / ARV
- ARV (median comp)
- $190,434
- List price
- $155,000
- Delta
- -18.61%
- Verdict
- UNDERPRICED
- Comps
- 20 within 1.0 mi
Show comp detail 5 sales within ~0.75 mi
| Address | Dist | Beds/Ba | Sqft | Sold | Price | $/sf | Match |
|---|---|---|---|---|---|---|---|
| 5226 Woodside Dr | 0.29mi | 3/1.5 | 1,266 (-1%) | 2mo | $265,000 | $209 | 79 |
| 1921 Ormandy Dr | 0.31mi | 3/2.0 | 1,422 (+11%) | 21mo | $259,500 | $182 | 48 |
| 2027 Richland Ave | 0.57mi | 3/2.0 | 1,413 (+10%) | 8mo | $320,000 | $226 | 48 |
| 2525 Valley St | 0.38mi | 2/1.0 (-1) | 1,200 (-6%) | 20mo | $1,000 | $1 | 44 |
| 5144 Abelia Dr | 0.40mi | 3/2.0 | 1,448 (+13%) | 20mo | $320,000 | $221 | 41 |
Match score weights: distance 35% · size 25% · config 20% · recency 20%. Top-matched comps best support the ARV.
Projected returns pro-forma
-3.0% appreciation · 1.54% rent growth · sell at horizon
- IRR
- -7.5%
- Equity multiple
- 0.73×
- Total profit
- $-11,906
- Equity at exit
- $23,111
- IRR
- 0.1%
- Equity multiple
- 1.01×
- Total profit
- $305
- Equity at exit
- $13,402
Cash invested: $43,400 (down + closing). Projections, not guarantees.
Landlord ↔ Tenant lean methodology
- Overall (STATE)
- 90 Strongly Landlord-Friendly
- State Louisiana
- 90 Strongly Landlord-Friendly · R+12
- County
- — inherits STATE
- City
- — inherits STATE
ZIP-level market 70808
- Rents YoY
- 1.5%
- Active inventory
- 297
- Price-to-rent
- 7.9×
Monthly cashflow live
- Estimated rent
- $1,627 high interval (Pro) →
- Mortgage (P&I)
- −$813
- Tax from tax record
- −$38 /mo · $461/yr
- Insurance
- −$65
- Flood insurance flood zone
- −$125 /mo · $1,502/yr
- HOA
- −$0
- Vacancy / Maint / Mgmt
- −$342
- Net cashflow
- $244
Break-even live
Sensitivity live
| Price | -10% $332 | -5% $288 | +0% $244 | +5% $200 | +10% $157 |
|---|---|---|---|---|---|
| Rent | -10% $116 | -5% $180 | +0% $244 | +5% $309 | +10% $373 |
| Rate | -1.0pp $322 | -0.5pp $284 | base $244 | +0.5pp $204 | +1.0pp $163 |
UW: 25.0% down · 7.5% · 30yr · 1.5% tax · 5.0% vac · 8.0% maint · 8.0% mgmt
Financing live
Cash to close
- Down payment
- $38,750
- Closing costs
- $4,650
- Reserves months
- —
- Total cash needed
- —
Loan-product check · same deal, 3 products live
Conventional
25% down · 7.5% · 30yr
- Down + closing
- —
- Monthly P&I
- —
- Monthly cashflow
- —
- DSCR
- —
- Eligible?
- —
Personal DTI + credit; lowest rate.
DSCR
20% down · 8.5% · 30yr
- Down + closing
- —
- Monthly P&I
- —
- Monthly cashflow
- —
- DSCR
- —
- Eligible?
- —
No personal income docs; deal must DSCR.
Hard money
10% down · 12.0% · 12mo
- Down + closing
- —
- Monthly P&I
- —
- Monthly cashflow
- —
- DSCR
- —
- Eligible?
- —
Short-term bridge; refi at stabilization.
Rent comps 30 comps
| Address | Beds | Baths | Sqft | Rent | $/sqft | DOM | Units | Dist |
|---|---|---|---|---|---|---|---|---|
| 2411 Valley St Baton Rouge, LA | 3.0 | 1.5 | 1500 | $1,500 | $1.00 | 24d | 1 | 0.33mi |
| 2411 Valley St Baton Rouge, LA | 3.0 | 1.5 | 1500 | $1,500 | $1.00 | 45d | 1 | 0.33mi |
| 2100 College Dr Baton Rouge, LA | 1.0–2.0 | 1.0–2.0 | 915 | $1,460 | $1.60 | 15d | 12 | 0.35mi |
| 1755 College Dr #224 Baton Rouge, LA | 2.0 | 2.0 | 1036 | $1,150 | $1.11 | 24d | 1 | 0.52mi |
| 2225 College Dr Baton Rouge, LA | 1.0–3.0 | 1.0–2.0 | 954 | $1,225 | $1.28 | 15d | 32 | 0.52mi |
| 1607 College Dr Baton Rouge, LA | 1.0–2.0 | 1.0–2.0 | 1040 | $1,030 | $0.99 | 15d | 1 | 0.59mi |
| 1100 S Foster Dr Baton Rouge, LA | 1.0–2.0 | 1.0–1.5 | 795 | $918 | $1.15 | 15d | 3 | 0.83mi |
| 950 S Foster Dr Baton Rouge, LA | 1.0–2.0 | 1.0–2.0 | 888 | $975 | $1.10 | 15d | 1 | 0.90mi |
| 2500 Gates Cir Baton Rouge, LA | 1.0–3.0 | 1.0–2.0 | 1221 | $2,035 | $1.67 | 15d | 33 | 0.94mi |
| 5000 Claycut Rd Baton Rouge, LA | 1.0–4.0 | 1.0–2.5 | 1600 | $1,841 | $1.15 | 15d | 1 | 0.98mi |
| 6765 Corporate Blvd Baton Rouge, LA | 1.0–2.0 | 1.0–2.0 | 922 | $1,600 | $1.74 | 45d | 2 | 1.01mi |
| 6765 Corporate Blvd Baton Rouge, LA | 1.0–3.0 | 1.0–2.0 | 1316 | $2,300 | $1.75 | 15d | 4 | 1.01mi |
| 6929 Commerce Cir Baton Rouge, LA | 1.0–2.0 | 1.0–2.0 | 969 | $1,807 | $1.86 | 15d | 16 | 1.06mi |
| 6810 Jefferson Hwy Baton Rouge, LA | 1.0–3.0 | 1.0–2.0 | 1051 | $1,929 | $1.84 | 15d | 29 | 1.23mi |
| 2539 Fiero St Baton Rouge, LA | 2.0 | 2.0 | 1752 | $2,600 | $1.48 | 45d | 1 | 1.27mi |
| 5704 Goodwood Crossing Ln Baton Rouge, LA | 3.0 | 2.5 | 1571 | $1,900 | $1.21 | 45d | 1 | 1.32mi |
| 5704 Goodwood Crossing Ln Baton Rouge, LA | 3.0 | 2.5 | 1571 | $1,900 | $1.21 | 15d | 1 | 1.32mi |
| 352 S Foster Dr Baton Rouge, LA | 1.0–2.0 | 1.0–2.0 | 987 | $1,475 | $1.49 | 15d | 2 | 1.33mi |
| 422 Glenmore Ave Baton Rouge, LA | 3.0 | 2.0 | 1307 | $1,700 | $1.30 | 24d | 1 | 1.33mi |
| 3711 Cole Dr #3 Baton Rouge, LA | 2.0 | 1.5 | 1200 | $1,200 | $1.00 | 45d | 1 | 1.36mi |
| 1522 Stephens Ave Unit Main House Baton Rouge, LA | 2.0 | 1.5 | 1302 | $1,800 | $1.38 | 45d | 1 | 1.37mi |
| 1522 Stephens Ave Unit A Baton Rouge, LA | 2.0 | 1.0 | 1302 | $1,800 | $1.38 | 24d | 1 | 1.37mi |
| 330 Ingleside Dr Baton Rouge, LA | 1.0–3.0 | 1.0–2.0 | 773 | $1,353 | $1.75 | 15d | 6 | 1.37mi |
| 5500 Perkins Rd Baton Rouge, LA | 1.0–2.0 | 1.0–2.0 | 940 | $1,785 | $1.90 | 15d | 29 | 1.40mi |
| 373 Community College Dr Unit 206 Baton Rouge, LA | 4.0 | 2.0 | 1300 | $1,200 | $0.92 | 45d | 1 | 1.40mi |
| 373 Community College Dr Unit 302 Baton Rouge, LA | 4.0 | 2.0 | 1300 | $1,100 | $0.85 | 45d | 1 | 1.40mi |
| 305 Saint Thomas Ln Baton Rouge, LA | 2.0 | 2.0 | 1268 | $2,200 | $1.74 | 15d | 1 | 1.40mi |
| 305 Saint Thomas Ln Baton Rouge, LA | 2.0 | 2.0 | 1268 | $2,200 | $1.74 | 24d | 1 | 1.40mi |
| 343 S Fairfax Dr Baton Rouge, LA | 4.0 | 2.0 | 1421 | $1,700 | $1.20 | 20d | 1 | 1.46mi |
| 878 Kenmore Ave Unit C Baton Rouge, LA | 2.0 | 1.0 | 1100 | $1,000 | $0.91 | 22d | 1 | 1.48mi |
Listing history 50 events
-
2026-06-18days on market $155,000 Active 153 DOM
-
2026-06-17days on market $155,000 Active 152 DOM
-
2026-06-16days on market $155,000 Active 151 DOM
-
2026-06-15days on market $155,000 Active 150 DOM
-
2026-06-14days on market $155,000 Active 148 DOM
-
2026-06-10days on market $155,000 Active 145 DOM
-
2026-06-09days on market $155,000 Active 144 DOM
-
2026-06-08days on market $155,000 Active 143 DOM
-
2026-06-07remarks 699-char remark
-
2026-06-07statusdays on market $155,000 Active 142 DOM
-
2026-06-02status $155,000 Pending 140 DOM
-
2026-06-01days on market $155,000 Active 140 DOM
-
2026-05-31days on market $155,000 Active 139 DOM
-
2026-05-31days on market $155,000 Active 138 DOM
-
2026-04-09status Active
-
2026-04-09price $163,999
-
2026-04-09status Active
-
2026-04-09price $163,999
-
2026-03-25price $164,999
-
2026-03-25price $164,999
-
2026-02-27price $165,000
-
2026-02-27price $165,000
-
2026-01-17price $170,000
-
2026-01-17price $170,000
-
2025-11-23$184,999 Active
-
2025-11-23$184,999 Active
-
2025-06-03soldstatus $60,000
-
2025-06-02soldstatus Closed
-
2025-04-28status Pending
-
2025-04-22status Active
-
2025-04-16status Pending
-
2025-04-15$75,000 Active
-
2025-04-14$75,000 Active
-
2017-09-01soldstatus
-
2017-06-16$850
-
2017-03-10soldstatus
-
2017-03-06$900
-
2011-07-11soldstatus
-
2011-04-29$32,000
-
2011-04-29$32,000
-
2009-04-17$30,000
-
2009-04-17$30,000
-
2004-04-07$49,900
-
2004-04-07$49,900
-
2004-01-27soldstatus
-
2003-11-13$25,000
-
2003-11-13$25,000
-
2001-10-16soldstatus
-
2001-07-17$49,900
-
2001-07-17$49,900
ⓘ Source: listings_history table (triggers on properties + properties_extension) + one-shot
backfill from property_details.listing_events for pre-trigger history.
Tax reassessment forecast LA · Resets to sale price
- Current annual tax
- $461 · $38/mo
- Projected year-2 tax
- $852 · $71/mo
- Expected delta
- +$391/yr (+$33/mo · 84.8%)
ⓘ Screening estimate from a state-policy table — verify with the county assessor before closing.
Climate risk First Street
- Flood 4/10 Moderate FEMA zone A · 22% chance over 30 yrs
- Wildfire 1/10 Low
- Heat 8/10 Severe 7 d/yr ≥108°F today · 20 d/yr by 30 yrs out
- Wind 9/10 Extreme 99% chance of damaging wind over 30 yrs
- Air quality 3/10 Moderate 3 unhealthy d/yr today · 3 by 30 yrs out
Nearby sold comps map
Loading sold comps map…
Walkable amenities ~0.75 mi
Loading nearby amenities…
Taxation est. · year 1
- Rental income
- $19,525
- − Mortgage interest
- −$8,682
- − Property taxes
- −$461
- − Insurance
- −$2,278
- − Repairs & maintenance
- −$1,562
- − Management
- −$1,562
- − Depreciation
- −$4,509
- Taxable income
- $471
- Est. tax owed @ 24.0%
- −$113
- After-tax cash flow
- $2,819/yr
For passive investors: Depreciation is non-cash, so a rental often shows a tax loss while cash-flowing — sheltering income. Rental losses are passive: they offset passive income freely, and up to $25,000/yr can offset ordinary (W-2) income if you actively participate and your MAGI is under $100k (phasing out to $0 by $150k); unused losses carry forward. On sale, claimed depreciation is recaptured at up to 25%, and gains may owe capital-gains tax (a 1031 exchange can defer both). Figures are a year-1 estimate at your 24.0% rate — not tax advice; consult a CPA.
Schools (NCES district)
- District
- East Baton Rouge Parish
- NCES district ID
- 2200540
- Math proficiency
- 22% ▼ -36.00%
- Reading proficiency
- 34% ▼ -31.00%
- Median HH income
- $46,263
- Composite
- 24.14/100
- National rank
- #7745
- State rank
- #47 of 98 in LA
Livability — Baton Rouge
- Score
- 74/100
- State rank
- #24
- US rank
- #4535
Category grades
Schools grade is shown separately in the Schools card above.
Census & demographics
- Census place
- Baton Rouge, LA
- County
- East Baton Rouge Parish · 399,686 people
- City population
- 351,868
- Metro
- Baton Rouge, LA
- Population (ZIP)
- 35,843
- Household income
- $69,418
- Rent vs Own
- Severe rent burden
- 2545.0
Population outlook (East Baton Rouge County) Hauer SSP2
- Today (2025)
- 464,810 people
- By 2030
- 472,137 · +1.6%
- By 2040
- 480,243 · +3.3%
- By 2050
- 484,422 · +4.2%
- By 2075
- 492,069 · +5.9%
- By 2100
- 476,347 · +2.5%
Race, ethnicity, and origin ACS 2023
- Neighborhood character
- Predominantly White (66%)
- Race & ethnicity
- White 66% Black 20% Two or more races 7% Hispanic / Latino 6% Asian 5%
- Hispanic origin (detail)
- Mexican 1%
- Common ancestry
- Lithuanian 12% Slovak 2% Romanian 2%
- Foreign-born
- 8% · Canada, China, Vietnam
- Languages at home
- 90% English-only · Spanish 2% French/Haitian/Cajun 2% Other Indo-European 1%
Political lean MEDSL · East Baton Rouge
- 2024 margin
- D (+11.1) · D 54.5% · R 43.4% · Other 2.1%
- 2008→2024 swing
- +8.9pp toward D · 2008: 2.2pp · 2024: 11.1pp
- All cycles
- 2024: D+11.1 2020: D+13.1 2016: D+9.2 2012: D+5.2 2008: D+2.2
Not yet ingested
- Civics
- —
Market trends
- HPI YoY
- ▼ -351.73%
- Current HPI
- 196.4406
- Rent YoY
- ▲ 1.54%
- Metro
- Baton Rouge, LA
- State GDP YoY
- ▲ 3.29%
- F500 in state
- 10
Industry mix (Fortune 500 HQ in LA)
| Industry | F500 HQs | Revenue |
|---|---|---|
| Telecommunications | 2 | $23B |
|
||
| Utilities | 1 | $12B |
|
||
| Wholesale / Distribution | 1 | $5B |
|
||
| Advertising | 1 | $2B |
|
||
Price history
+724.1% since first listed41 events — show timeline
- 2026-04-09 Relisted — AcadianaMLS
- 2026-04-09 Price Changed $163,999 AcadianaMLS
- 2026-04-09 Relisted — GBRMLS
- 2026-04-09 Price Changed $163,999 GBRMLS
- 2026-03-25 Price Changed $164,999 AcadianaMLS
- 2026-03-25 Price Changed $164,999 GBRMLS
- 2026-02-27 Price Changed $165,000 AcadianaMLS
- 2026-02-27 Price Changed $165,000 GBRMLS
- 2026-01-17 Price Changed $170,000 AcadianaMLS
- 2026-01-17 Price Changed $170,000 GBRMLS
- 2025-11-23 Listed $184,999 GBRMLS
- 2025-11-23 Listed $184,999 AcadianaMLS
- 2025-06-03 Sold (Public Records) $60,000 Public Records
- 2025-06-02 Sold (MLS) — GBRMLS
- 2025-04-28 Pending — GBRMLS
- 2025-04-22 Relisted — GBRMLS
- 2025-04-16 Pending — GBRMLS
- 2025-04-15 Listed $75,000 GBRMLS
- 2025-04-14 Listed $75,000 AcadianaMLS
- 2017-09-01 Sold (MLS) — GBRMLS
- 2017-06-16 Listed $850 GBRMLS
- 2017-03-10 Sold (MLS) — GBRMLS
- 2017-03-06 Listed $900 GBRMLS
- 2011-07-11 Sold (MLS) — GBRMLS
- 2011-04-29 Listed $32,000 GBRMLS
- 2011-04-29 Listed $32,000 AcadianaMLS
- 2009-04-17 Listed $30,000 AcadianaMLS
- 2009-04-17 Listed $30,000 GBRMLS
- 2004-04-07 Listed $49,900 AcadianaMLS
- 2004-04-07 Listed $49,900 GBRMLS
- 2004-01-27 Sold (MLS) — GBRMLS
- 2003-11-13 Listed $25,000 AcadianaMLS
- 2003-11-13 Listed $25,000 GBRMLS
- 2001-10-16 Sold (MLS) — GBRMLS
- 2001-07-17 Listed $49,900 AcadianaMLS
- 2001-07-17 Listed $49,900 GBRMLS
- 2001-04-27 Listed $55,000 AcadianaMLS
- 2001-03-16 Sold (Public Records) — Public Records
- 2001-03-15 Sold (MLS) — GBRMLS
- 2001-01-19 Listed $19,900 GBRMLS
- 2001-01-19 Listed $19,900 AcadianaMLS
Property tax history
+2.7%/yrLatest (2025): $461 · +4.7% YoY. Source: county tax records.
Cash-flow waterfall
monthlySold comps — $/sqft
last 12 mo · ≤1 miLoading sold comps…