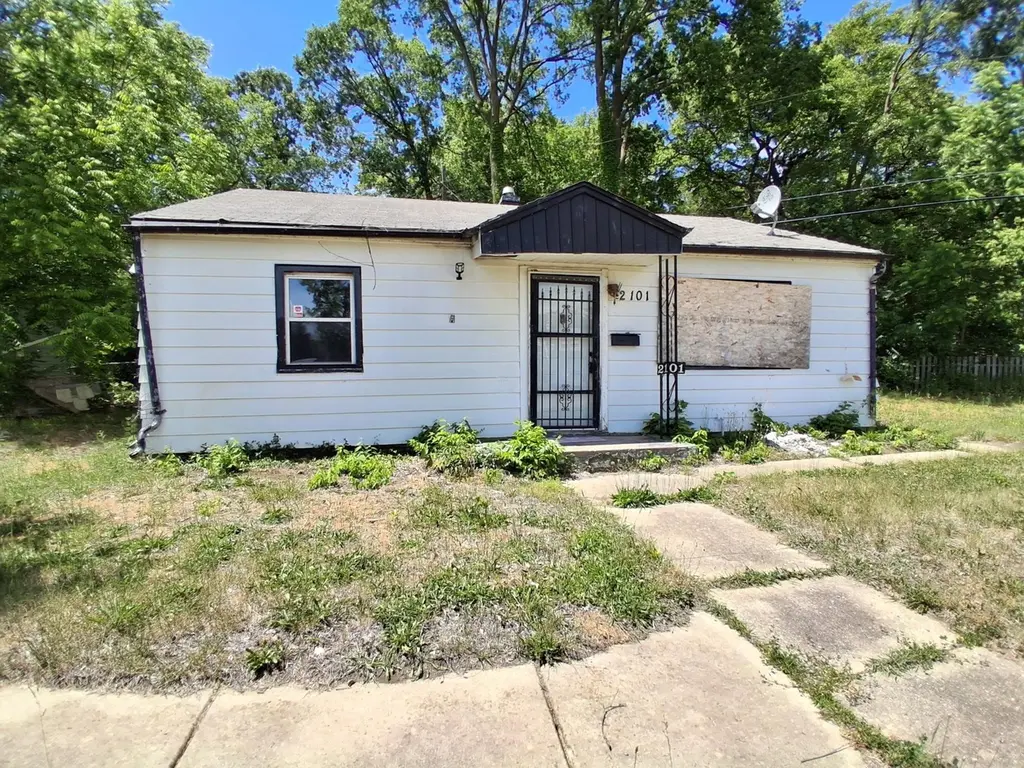
2101 Martha Ave · Rockford, IL
Flood risk 1/10 · Minimal
- FEMA flood zone
- X (unshaded)
- Chance of flooding over 30 yrs
- 0.0%
- Est. flood insurance / yr
- $507 – $1,088
Fire risk 1/10 · Minimal
- Est. fire insurance / yr
- $804 – $1,492
Heat risk 2/10 · Minimal
- Hot days now (above 101°F)
- 7 days/yr
- Hot days in 30 yrs
- 15 days/yr
Wind risk 2/10 · Minimal
- Chance of severe wind over 30 yrs
- —
Air-quality risk 2/10 · Minimal
- Unhealthy air days now
- 1 days/yr
- Unhealthy air days in 30 yrs
- 2 days/yr
Risk factors via First Street. Map © Google.
Why this score? — see what drove the B+ grade
The composite is a weighted blend of 9 inputs, each scored 0–100. Each bar is that input's sub-score; the figure is the points it added to the 100-point composite (weight × sub-score).
- Cash flow +30.0/30.0
- ARV discount +15.0/15.0
- 1% rule +10.0/10.0
- DSCR +10.0/10.0
- Rent growth +4.9/5.0
- Livability +3.1/5.0
- Condition / age +2.5/5.0
- Schools +1.2/10.0
- Appreciation +0.0/10.0
$39,900
🖨 Deal sheet (PDF) 📄 Offer letter ✓ Due diligence
Listing remarks
800+ sq ft home ready for transformation! This property has experienced significant fire damage and will require extensive renovation, but offers a blank slate for the savvy investor, contractor, or buyer looking to build equity. Home’s original footprint provides a solid starting point for redesign or rebuild. With utilities already on site and existing structure in place, this could be an ideal project for those looking to restore, reimagine, or completely customize a compact living space. Priced to reflect condition, this property is being sold As-Is with no repairs. Cash or renovation financing likely required. With vision and effort, this diamond in the rough has the potential to
Key facts
- 5,663 sq ft lot
- Built 1957
- Listed 12 days
Property features AI
Exterior
- Utilities: Public water; Public sewer; Electric service with fuses
- Home design: Single-family residence (House)
- Exterior features: Shingle roof
Interior
- Kitchen: Gas cooktop
- Bedrooms: 1 main-level bedroom
- Bathrooms: 1 full bathroom (main level)
- Heating & cooling: Forced air heating; Central air conditioning
- Interior features: Gas cooktop; Gas water heater
Neighborhood map
What this means for you Summary
Snapshot
- This is a 3-bed/1.0-bath single-family listed at $40k.
Deal economics
- At list price, monthly cash flow is $750 ($9k/yr) — positive.
- The deal already cash-flows at list — no discount required.
- Meets the 1% rule at list price ($1k rent vs $40k).
- Cap rate 28.9% vs local median 6.1% in Rockford — top-decile yield for the area; either an underpriced asset or a hidden risk that comps aren't pricing in. Stress-test before assuming the spread holds.
Location & tenants
- Location reads 62/100 on livability (#876 in IL) — a middle-class / working-renter tenant base. Strengths: cost of living A+, housing A+, health & safety A+; Watch: crime F, amenities F, commute F.
- Rockford SD 205 (urban): math 12% / reading 16% proficiency, ranked #533 of 620 in IL (top 86%) — low school quality limits family demand, transient renter base, plan for 1-2y turnover; 73% free/reduced lunch — lower-income household profile, screen leases tightly.
- Zoned schools: Julia Lathrop Elem School (math 2% / reading 2%, grade F, #1,927 of 2,056 statewide, top 100%, 295 students, 0% FRL); Rockford Envrnmntl Science Acad (math 0% / reading 7%, grade F, #652 of 665 statewide, top 98%, 1,051 students, 0% FRL); Jefferson High School (math 3% / reading 9%, grade F, #608 of 693 statewide, top 88%, 2,114 students, 0% FRL) — zoned schools average 0% FRL vs 73% district-wide (73 pts lower); this property's tenant base skews higher-income than the district average.
- Market conditions: Rents rising fast (+9.7%/yr); 69 active listings in the ZIP; 10 comparable units currently listed for rent nearby; rentals lingering (median 45d on market — plan ~5-8 weeks vacancy on turnover, expect pricing pressure); 80% of comp listings sitting > 30 days — soft ceiling on asking rent; lower-income renter base — watch delinquency; 285 units permitted in Winnebago County in 2024 (0 in 5+ unit buildings).
- At $1,287/mo this rent would consume 46% of the median local household income ($34k/yr) (locally 1406% of renters already pay >50% of income on rent) — very limited rent-growth headroom before tenants either downsize or default.
Forward outlook
- Local home prices are declining (-3.0%/yr); year-one equity from $276 of loan paydown is wiped out by about $1k of value loss. Plan a longer hold.
- Winnebago County population projected at -20% by 2050 — secular population decline; favor cash flow + early exit over multi-decade hold.
- At projected returns (-3.0% appreciation + 8.0% rent growth), your $11k cash investment doubles in ~2 years — after that, you're playing with house money.
Negotiation context
- Only 13 days on market — expect competitive offers; lowballing is unlikely to land.
- Current owner paid $25k; list at $40k implies a 60% gain — meaningful room to come down on a strong offer.
Risks & watch-outs
- Watch-outs: built in 1957 — expect roof / HVAC / electrical / plumbing capex.
Questions for the listing agent
- Built in 1957 — when were the roof, HVAC, electrical panel, plumbing, and water heater last replaced?
- Is there a deadline driving the sale (1031 exchange, divorce, estate, relocation)? That informs how much negotiation room exists.
- Schools are F-rated, which usually means shorter tenancies and higher turnover. Who's the typical renter profile here, and what's been the actual vacancy rate?
- Crime grade is F in this area — have there been break-ins, vandalism, or insurance claims at this property in the last 3 years? What carrier currently insures it and at what premium?
- What's the average days-on-market for RENTAL listings here right now (not sales)? A rising rental-DOM trend means longer vacancies and softer asking-rent achievability than the comps imply.
- What's the recent tenant-quality profile in this submarket — average credit score on applications, eviction rate, late-payment / NSF rate, and stable-employment percentage? A property-management company in the area should have these aggregated.
- How much new for-sale + rental construction is in the pipeline within 1–3 miles? Heavy new supply typically softens prices + rents 12–24 months out; constrained supply supports both.
Investment metrics
- 1% rule
- 3.23% ✓
- Cap rate
- 28.85%
- Cash-on-cash
- 80.57%
- DSCR
- 4.59
- GRM
- 2.6
CMA / ARV
- ARV (on-the-fly)
- $75,075
- Comps found
- 3
Show comp detail 3 sales within ~0.75 mi
| Address | Dist | Beds/Ba | Sqft | Sold | Price | $/sf | Match |
|---|---|---|---|---|---|---|---|
| 223 Clara Ave | 0.06mi | 3/1.0 | 864 (+5%) | 20mo | $79,000 | $91 | 72 |
| 2108 Christina St | 0.08mi | 2/1.0 (-1) | 882 (+7%) | 15mo | $52,500 | $60 | 67 |
| 807 Indiana Ave | 0.75mi | 3/1.0 | 936 (+14%) | 6mo | $134,900 | $144 | 38 |
Match score weights: distance 35% · size 25% · config 20% · recency 20%. Top-matched comps best support the ARV.
Projected returns pro-forma
-3.0% appreciation · 8.0% rent growth · sell at horizon
- IRR
- 86.3%
- Equity multiple
- 5.31×
- Total profit
- $48,127
- Equity at exit
- $5,949
- IRR
- 90.6%
- Equity multiple
- 13.03×
- Total profit
- $134,443
- Equity at exit
- $3,450
Cash invested: $11,172 (down + closing). Projections, not guarantees.
Landlord ↔ Tenant lean methodology
- Overall (STATE)
- 43 Moderately Tenant-Leaning
- State Illinois
- 43 Moderately Tenant-Leaning · D+7
- County
- — inherits STATE
- City
- — inherits STATE
ZIP-level market 61104
- Home prices YoY
- -21.4%
- Rents YoY
- 9.7%
- Active inventory
- 69
- Price-to-rent
- 2.6×
Monthly cashflow live
- Estimated rent
- $1,287 high interval (Pro) →
- Mortgage (P&I)
- −$209
- Tax from tax record
- −$41 /mo · $489/yr
- Insurance
- −$17
- HOA
- −$0
- Vacancy / Maint / Mgmt
- −$270
- Net cashflow
- $750
Break-even live
Sensitivity live
| Price | -10% $773 | -5% $761 | +0% $750 | +5% $739 | +10% $728 |
|---|---|---|---|---|---|
| Rent | -10% $648 | -5% $699 | +0% $750 | +5% $801 | +10% $852 |
| Rate | -1.0pp $770 | -0.5pp $760 | base $750 | +0.5pp $740 | +1.0pp $729 |
UW: 25.0% down · 7.5% · 30yr · 1.5% tax · 5.0% vac · 8.0% maint · 8.0% mgmt
Financing live
Cash to close
- Down payment
- $9,975
- Closing costs
- $1,197
- Reserves months
- —
- Total cash needed
- —
Loan-product check · same deal, 3 products live
Conventional
25% down · 7.5% · 30yr
- Down + closing
- —
- Monthly P&I
- —
- Monthly cashflow
- —
- DSCR
- —
- Eligible?
- —
Personal DTI + credit; lowest rate.
DSCR
20% down · 8.5% · 30yr
- Down + closing
- —
- Monthly P&I
- —
- Monthly cashflow
- —
- DSCR
- —
- Eligible?
- —
No personal income docs; deal must DSCR.
Hard money
10% down · 12.0% · 12mo
- Down + closing
- —
- Monthly P&I
- —
- Monthly cashflow
- —
- DSCR
- —
- Eligible?
- —
Short-term bridge; refi at stabilization.
Rent comps 10 comps
| Address | Beds | Baths | Sqft | Rent | $/sqft | DOM | Units | Dist |
|---|---|---|---|---|---|---|---|---|
| 2208 Christina St Rockford, IL | 2.0 | 1.0 | 700 | $1,300 | $1.86 | 22d | 1 | 0.11mi |
| 611 15th Ave Unit 2 Rockford, IL | 2.0 | 1.0 | 806 | $1,350 | $1.67 | 44d | 1 | 0.67mi |
| 914 18th Ave Rockford, IL | 2.0 | 1.0 | 1123 | $900 | $0.80 | 44d | 1 | 0.84mi |
| 810 15th Ave Unit 810-1 Rockford, IL | 2.0 | 1.0 | 1000 | $995 | $0.99 | 44d | 1 | 0.85mi |
| 810 15th Ave Unit 810-3 Rockford, IL | 2.0 | 1.0 | 1000 | $995 | $0.99 | 22d | 1 | 0.85mi |
| 1229 S Church St Unit 2 Rockford, IL | 3.0 | 1.0 | 1096 | $1,300 | $1.19 | 44d | 1 | 1.05mi |
| 1209 21st Pl Rockford, IL | 2.0 | 1.0 | 1040 | $1,350 | $1.30 | 44d | 1 | 1.06mi |
| 1211 21st Pl Rockford, IL | 2.0 | 1.0 | 1040 | $1,350 | $1.30 | 44d | 1 | 1.07mi |
| 1418 22nd Ave Rockford, IL | 2.0 | 1.0 | 950 | $1,200 | $1.26 | 44d | 1 | 1.27mi |
| 1420 22nd Ave Rockford, IL | 2.0 | 1.0 | 950 | $1,200 | $1.26 | 44d | 1 | 1.27mi |
Listing history 11 events
-
2026-06-21days on market $39,900 Active 13 DOM
-
2026-06-19days on market $39,900 Active 11 DOM
-
2026-06-18days on market $39,900 Active 10 DOM
-
2026-06-17days on market $39,900 Active 9 DOM
-
2026-06-16days on market $39,900 Active 8 DOM
-
2026-06-15days on market $39,900 Active 7 DOM
-
2026-06-14days on market $39,900 Active 5 DOM
-
2026-06-13pricedays on market $39,900 Active 4 DOM
-
2026-06-10days on market $49,000 Active 2 DOM
-
2026-06-09remarks 693-char remark
-
2026-06-09$49,000 Active 1 DOM
ⓘ Source: listings_history table (triggers on properties + properties_extension) + one-shot
backfill from property_details.listing_events for pre-trigger history.
Tax reassessment forecast IL · Partial reset (capped growth)
- Current annual tax
- $489 · $41/mo
- Projected year-2 tax
- $698 · $58/mo
- Expected delta
- +$208/yr (+$17/mo · 42.6%)
ⓘ Screening estimate from a state-policy table — verify with the county assessor before closing.
Climate risk First Street
- Flood 1/10 Low FEMA zone X (unshaded) · 0% chance over 30 yrs
- Wildfire 1/10 Low
- Heat 2/10 Low 7 d/yr ≥101°F today · 15 d/yr by 30 yrs out
- Wind 2/10 Low
- Air quality 2/10 Low 1 unhealthy d/yr today · 2 by 30 yrs out
Nearby sold comps map
Loading sold comps map…
Walkable amenities ~0.75 mi
Loading nearby amenities…
Taxation est. · year 1
- Rental income
- $15,445
- − Mortgage interest
- −$2,235
- − Property taxes
- −$489
- − Insurance
- −$200
- − Repairs & maintenance
- −$1,236
- − Management
- −$1,236
- − Depreciation
- −$1,161
- Taxable income
- $8,889
- Est. tax owed @ 24.0%
- −$2,133
- After-tax cash flow
- $6,868/yr
For passive investors: Depreciation is non-cash, so a rental often shows a tax loss while cash-flowing — sheltering income. Rental losses are passive: they offset passive income freely, and up to $25,000/yr can offset ordinary (W-2) income if you actively participate and your MAGI is under $100k (phasing out to $0 by $150k); unused losses carry forward. On sale, claimed depreciation is recaptured at up to 25%, and gains may owe capital-gains tax (a 1031 exchange can defer both). Figures are a year-1 estimate at your 24.0% rate — not tax advice; consult a CPA.
Schools (NCES district)
- District
- Rockford SD 205
- NCES district ID
- 1734510
- Math proficiency
- 12% ▼ -2.00%
- Reading proficiency
- 16% ▼ -3.00%
- Median HH income
- $42,533
- Composite
- 12.21/100
- National rank
- #9649
- State rank
- #533 of 620 in IL
Livability — Rockford
- Score
- 62/100
- State rank
- #876
- US rank
- #17035
Category grades
Schools grade is shown separately in the Schools card above.
Census & demographics
- Census place
- Rockford, IL
- County
- Winnebago County · 147,297 people
- City population
- 147,297
- Metro
- Rockford, IL
- Population (ZIP)
- 17,222
- Household income
- $33,772
- Rent vs Own
- Severe rent burden
- 1406.0
Population outlook (Winnebago County) Hauer SSP2
- Today (2025)
- 271,080 people
- By 2030
- 260,684 · -3.8%
- By 2040
- 238,405 · -12.1%
- By 2050
- 216,129 · -20.3%
- By 2075
- 172,882 · -36.2%
- By 2100
- 135,336 · -50.1%
Race, ethnicity, and origin ACS 2023
- Neighborhood character
- Highly diverse neighborhood (Simpson 0.70)
- Race & ethnicity
- White 41% Hispanic / Latino 26% Black 25% Two or more races 13% Asian 4%
- Hispanic origin (detail)
- Mexican 22% Puerto Rican 2%
- Common ancestry
- Romanian 2% Portuguese 2% Lithuanian 2%
- Foreign-born
- 16% · Canada, South Korea, Philippines
- Languages at home
- 74% English-only · Spanish 18% Other Asian/Pacific 3% Russian/Polish/Slavic 1%
Political lean MEDSL · Winnebago
- 2024 margin
- Toss-up / Even · D 49.5% · R 49.0% · Other 1.5%
- 2008→2024 swing
- -12.2pp toward R · 2008: 12.8pp · 2024: 0.6pp
- All cycles
- 2024: D+0.6 2020: D+2.5 2016: R+1.2 2012: D+5.7 2008: D+12.8
Not yet ingested
- Civics
- —
Market trends
- HPI YoY
- ▼ -63.40%
- Current HPI
- 233.0219
- Rent YoY
- ▲ 9.67%
- Metro
- Rockford, IL
- State GDP YoY
- ▲ 1.59%
- F500 in state
- 60
Industry mix (Fortune 500 HQ in IL)
| Industry | F500 HQs | Revenue |
|---|---|---|
| Insurance | 4 | $201B |
|
||
| Consumer Goods | 4 | $87B |
|
||
| Industrial Machinery | 3 | $64B |
|
||
| Healthcare | 2 | $55B |
|
||
| Retail / Pharmacy | 1 | $148B |
|
||
| Agriculture / Food | 1 | $86B |
|
||
Price history
+96.0% since first listed3 events — show timeline
- 2026-06-08 Listed $49,000 NWIAR
- 1995-04-25 Sold (Public Records) $25,000 Public Records
- 1995-04-25 Sold (Public Records) $25,000 Public Records
Property tax history
+2.6%/yrLatest (2025): $489 · -28.4% YoY. Source: county tax records.
Cash-flow waterfall
monthlySold comps — $/sqft
last 12 mo · ≤1 miLoading sold comps…