 Multi-family
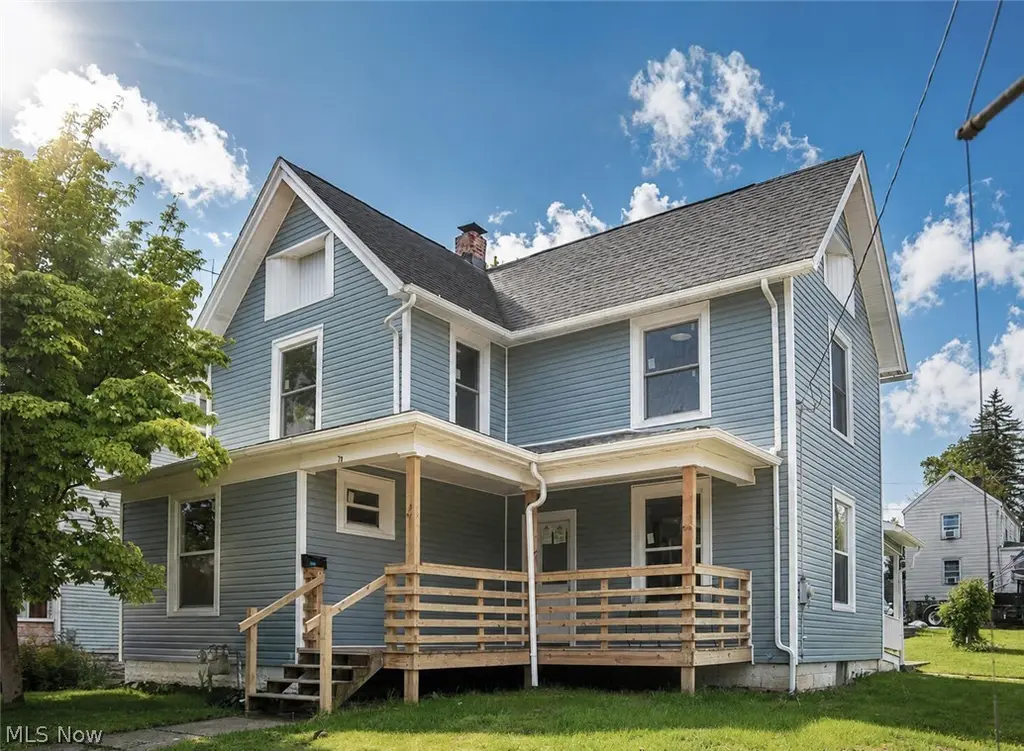
705 9th St SW · Massillon, OH
Flood risk 1/10 · Minimal
- FEMA flood zone
- X (unshaded)
- Chance of flooding over 30 yrs
- 0.0%
- Est. flood insurance / yr
- $473 – $860
Fire risk 1/10 · Minimal
- Est. fire insurance / yr
- $713 – $1,323
Heat risk 3/10 · Minor
- Hot days now (above 97°F)
- 7 days/yr
- Hot days in 30 yrs
- 17 days/yr
Wind risk 1/10 · Minimal
- Chance of severe wind over 30 yrs
- —
Air-quality risk 2/10 · Minimal
- Unhealthy air days now
- 0 days/yr
- Unhealthy air days in 30 yrs
- 1 days/yr
Risk factors via First Street. Map © Google.
Why this score? — see what drove the B grade
The composite is a weighted blend of 9 inputs, each scored 0–100. Each bar is that input's sub-score; the figure is the points it added to the 100-point composite (weight × sub-score).
- Cash flow +30.0/30.0
- 1% rule +10.0/10.0
- DSCR +10.0/10.0
- ARV discount +7.5/15.0
- Schools +4.0/10.0
- Livability +3.7/5.0
- Rent growth +2.5/5.0
- Condition / age +2.5/5.0
- Appreciation +0.0/10.0
$205,000
🖨 Deal sheet 📄 Offer letter ✓ Due diligence
Multi-family units
County records classify this as Multi-Family (2-4 Unit). Listing-text estimate: 1 unit. estimate disagrees with records
Listing remarks MLS
Attention Investors!! This property is zoned a Duplex and current owner has started to convert it to a single family home with 5 bedrooms and 2 full bathrooms. Needs new front porch, electrical wiring completed, flooring and numerous other repairs. Roof was replaced in 2017 and most of the plumbing has been updated. This would be a great winter project!! Property is being sold As-is.
Key facts
- Updated drywall
- New plumbing stacks
- Beautifully restored
Tags
Property features AI
Finance
- Other: Below-grade finished area included; Owner-provided area and year-built sources
- Financial info: Pets allowed
Exterior
- Parking: Concrete driveway; Garage; On-street parking
- Utilities: Public water; Public sewer
- Home design: Two-story frame home; Updated/remodeled condition; Asphalt/fiberglass roof
- Construction: Frame construction; Asphalt/fiberglass roof
- Exterior features: Awnings; Exterior lighting; Rain gutters; Corner city lot (approximately 0.17 acres, 46 x 141)
Interior
- Bedrooms: Five main-level bedrooms
- Bathrooms: Two full bathrooms; One main-level bathroom
- Heating & cooling: Forced-air gas heating; Central air conditioning
- Interior features: Built-in features; Ceiling fans; Laminate countertops; Pantry; Recessed lighting; Storage; Soaking tub; Natural woodwork; Walk-in closets
- Laundry & utility: Laundry closet; Laundry room on the upper level
Neighborhood map
What this means for you Summary
Snapshot
- This is a 3-bed/2.0-bath multifamily listed at $205k.
Deal economics
- At list price, monthly cash flow is $1k ($15k/yr) — positive.
- The deal already cash-flows at list — no discount required.
- Meets the 1% rule at list price ($3k rent vs $205k).
- Cap rate 13.7% vs local median 3.9% in Massillon — top-decile yield for the area; either an underpriced asset or a hidden risk that comps aren't pricing in. Stress-test before assuming the spread holds.
Location & tenants
- Location reads 74/100 on livability (#306 in OH, #4,928 nationally) — a middle-class / working-renter tenant base. Strengths: cost of living A+, housing A+, health & safety A-; Watch: employment C-, amenities F, commute F.
- Massillon City (urban): math 43% / reading 52% proficiency, ranked #487 of 656 in OH (top 74%) — families likely to look elsewhere, expect single-tenant / working-renter base with shorter leases; 60% free/reduced lunch — lower-income household profile, screen leases tightly.
- Market conditions: 102 active listings in the ZIP; 4 comparable units currently listed for rent nearby; rentals at typical pace (median 21d on market — plan ~3-4 weeks tenant-placement turnaround); 528 units permitted in Stark County in 2024 (84 in 5+ unit buildings).
- At $3,364/mo this rent would consume 60% of the median local household income ($67k/yr) (locally 231% of renters already pay >50% of income on rent) — very limited rent-growth headroom before tenants either downsize or default.
Forward outlook
- Local home prices are declining (-3.0%/yr); year-one equity from $1k of loan paydown is wiped out by about $6k of value loss. Plan a longer hold.
- Stark County population projected to shrink 8% by 2050 — rents likely to lag national; underwrite the cash flow, not the appreciation.
- At projected returns (-3.0% appreciation + 3.0% rent growth), your $57k cash investment doubles in ~5 years — after that, you're playing with house money.
Negotiation context
- Only 12 days on market — expect competitive offers; lowballing is unlikely to land.
- 3 sale attempts since 26y ago with the ask held roughly flat each time — persistent listings suggest the price (not the market) is what's stuck; bring a comps-based counter.
- Current owner paid $56k; list at $205k implies a 266% gain — meaningful room to come down on a strong offer.
Risks & watch-outs
- Watch-outs: built in 1901 — expect roof / HVAC / electrical / plumbing capex.
Questions for the listing agent
- Built in 1901 — when were the roof, HVAC, electrical panel, plumbing, and water heater last replaced?
- Is there a deadline driving the sale (1031 exchange, divorce, estate, relocation)? That informs how much negotiation room exists.
- Schools are B-rated — typically a magnet for longer-tenancy family renters. What's the average tenant stay here, and is there a school-zone premium baked into asking?
- What's the average days-on-market for RENTAL listings here right now (not sales)? A rising rental-DOM trend means longer vacancies and softer asking-rent achievability than the comps imply.
- What's the recent tenant-quality profile in this submarket — average credit score on applications, eviction rate, late-payment / NSF rate, and stable-employment percentage? A property-management company in the area should have these aggregated.
- How much new apartment / multifamily construction is in the pipeline within 1–3 miles? Heavy new supply (>2% of stock underway) typically softens rents 12–24 months out; light construction supports rent growth.
Investment metrics
- 1% rule
- 1.64% ✓
- Cap rate
- 13.70%
- Cash-on-cash
- 26.47%
- DSCR
- 2.18
- GRM
- 5.1
CMA / ARV
- ARV (on-the-fly)
- $103,008
- Comps found
- 4
Show comp detail 4 sales within ~0.75 mi
| Address | Dist | Beds/Ba | Sqft | Sold | Price | $/sf | Match |
|---|---|---|---|---|---|---|---|
| 949 Tremont Ave SW | 0.24mi | 2/2.0 (-1) | 1,728 (-3%) | 16mo | $100,000 | $58 | 65 |
| 301 6th St SW | 0.32mi | 4/2.0 (+1) | 1,820 (+2%) | 22mo | $86,000 | $47 | 58 |
| 508 Tremont Ave SW | 0.41mi | 4/4.0 (+1) | 1,672 (-6%) | 2mo | $98,000 | $59 | 56 |
| 505 Neale Ave SW | 0.55mi | 4/2.0 (+1) | 2,005 (+13%) | 6mo | $100,000 | $50 | 43 |
Match score weights: distance 35% · size 25% · config 20% · recency 20%. Top-matched comps best support the ARV.
Projected returns pro-forma
-3.0% appreciation · 3.0% rent growth · sell at horizon
- IRR
- 20.3%
- Equity multiple
- 1.83×
- Total profit
- $47,462
- Equity at exit
- $30,566
- IRR
- 28.5%
- Equity multiple
- 3.53×
- Total profit
- $145,316
- Equity at exit
- $17,725
Cash invested: $57,400 (down + closing). Projections, not guarantees.
Landlord ↔ Tenant lean methodology
- Overall (STATE)
- 73 Landlord-Friendly
- State Ohio
- 73 Landlord-Friendly · R+6
- County
- — inherits STATE
- City
- — inherits STATE
ZIP-level market 44647
- Active inventory
- 102
- Price-to-rent
- 15.2×
Monthly cashflow live
- Estimated rent
- $3,364 medium interval (Pro) →
- Mortgage (P&I)
- −$1,075
- Tax from tax record
- −$231 /mo · $2,771/yr
- Insurance
- −$85
- HOA
- −$0
- Vacancy / Maint / Mgmt
- −$706
- Net cashflow
- $1,266
Break-even live
3-unit breakdown (identical units grouped — click to expand)
| Units | Beds | Baths | Est. rent |
|---|---|---|---|
| 3× units | 3 | 2 | $3,363 |
| #1 | 3 | 2 | $1,121 |
| #2 | 3 | 2 | $1,121 |
| #3 | 3 | 2 | $1,121 |
| Total (3 units) | $3,364 | ||
UW: 25.0% down · 7.5% · 30yr · 1.5% tax · 5.0% vac · 8.0% maint · 8.0% mgmt
Financing live
Cash to close
- Down payment
- $51,250
- Closing costs
- $6,150
- Reserves months
- —
- Total cash needed
- —
Loan-product check · same deal, 3 products live
Conventional
25% down · 7.5% · 30yr
- Down + closing
- —
- Monthly P&I
- —
- Monthly cashflow
- —
- DSCR
- —
- Eligible?
- —
Personal DTI + credit; lowest rate.
DSCR
20% down · 8.5% · 30yr
- Down + closing
- —
- Monthly P&I
- —
- Monthly cashflow
- —
- DSCR
- —
- Eligible?
- —
No personal income docs; deal must DSCR.
Hard money
10% down · 12.0% · 12mo
- Down + closing
- —
- Monthly P&I
- —
- Monthly cashflow
- —
- DSCR
- —
- Eligible?
- —
Short-term bridge; refi at stabilization.
Rent comps 4 comps
| Address | Beds | Baths | Sqft | Rent | $/sqft | DOM | Units | Dist |
|---|---|---|---|---|---|---|---|---|
| 111 Maple Ave SE Massillon, OH | 3.0 | 1.0 | 1300 | $1,050 | $0.81 | 13d | 1 | 0.86mi |
| 709 3rd St SE Massillon, OH | 4.0 | 1.5 | 1233 | $1,300 | $1.05 | 43d | 1 | 0.92mi |
| 450 South Ave SE Massillon, OH | 2.0 | 1.5 | 1270 | $1,236 | $0.97 | 13d | 1 | 1.04mi |
| 1704 13th St SE Massillon, OH | 3.0 | 1.0 | 1248 | $1,300 | $1.04 | 21d | 1 | 1.42mi |
Listing history 12 events
-
2026-06-18price $205,000 Active 12 DOM
-
2026-06-18days on market $206,000 Active 12 DOM
-
2026-06-17pricedays on market $206,000 Active 11 DOM
-
2026-06-16days on market $207,990 Active 10 DOM
-
2026-06-15days on market $207,990 Active 9 DOM
-
2026-06-14days on market $207,990 Active 7 DOM
-
2026-06-13days on market $207,990 Active 6 DOM
-
2026-06-10days on market $207,990 Active 4 DOM
-
2026-06-09days on market $207,990 Active 3 DOM
-
2026-06-08days on market $207,990 Active 2 DOM
-
2026-06-07remarks 687-char remark
-
2026-06-07$207,990 Active 1 DOM
ⓘ Source: listings_history table (triggers on properties + properties_extension) + one-shot
backfill from property_details.listing_events for pre-trigger history.
Tax reassessment forecast OH · Partial reset (capped growth)
- Current annual tax
- $2,771 · $231/mo
- Projected year-2 tax
- $2,984 · $249/mo
- Expected delta
- +$214/yr (+$18/mo · 7.7%)
ⓘ Screening estimate from a state-policy table — verify with the county assessor before closing.
Climate risk First Street
- Flood 1/10 Low FEMA zone X (unshaded) · 0% chance over 30 yrs
- Wildfire 1/10 Low
- Heat 3/10 Moderate 7 d/yr ≥97°F today · 17 d/yr by 30 yrs out
- Wind 1/10 Low
- Air quality 2/10 Low 0 unhealthy d/yr today · 1 by 30 yrs out
Nearby sold comps map
Loading sold comps map…
Walkable amenities ~0.75 mi
Loading nearby amenities…
Taxation est. · year 1
- Rental income
- $40,368
- − Mortgage interest
- −$11,483
- − Property taxes
- −$2,771
- − Insurance
- −$1,025
- − Repairs & maintenance
- −$3,229
- − Management
- −$3,229
- − Depreciation
- −$5,964
- Taxable income
- $12,667
- Est. tax owed @ 24.0%
- −$3,040
- After-tax cash flow
- $12,155/yr
For passive investors: Depreciation is non-cash, so a rental often shows a tax loss while cash-flowing — sheltering income. Rental losses are passive: they offset passive income freely, and up to $25,000/yr can offset ordinary (W-2) income if you actively participate and your MAGI is under $100k (phasing out to $0 by $150k); unused losses carry forward. On sale, claimed depreciation is recaptured at up to 25%, and gains may owe capital-gains tax (a 1031 exchange can defer both). Figures are a year-1 estimate at your 24.0% rate — not tax advice; consult a CPA.
Schools (NCES district)
- District
- Massillon City
- NCES district ID
- 3904435
- Math proficiency
- 43% ▼ -14.00%
- Reading proficiency
- 52% ▼ -11.00%
- Median HH income
- $38,094
- Composite
- 39.54/100
- National rank
- #3941
- State rank
- #487 of 656 in OH
Livability — Massillon
- Score
- 74/100
- State rank
- #306
- US rank
- #4928
Category grades
Schools grade is shown separately in the Schools card above.
Census & demographics
- Census place
- Massillon, OH
- County
- Stark County · 272,865 people
- City population
- 65,858
- Metro
- Canton-Massillon, OH
- Population (ZIP)
- 18,117
- Household income
- $67,140
- Rent vs Own
- Severe rent burden
- 231.0
Population outlook (Stark County) Hauer SSP2
- Today (2025)
- 373,708 people
- By 2030
- 371,245 · -0.7%
- By 2040
- 361,331 · -3.3%
- By 2050
- 345,290 · -7.6%
- By 2075
- 302,669 · -19.0%
- By 2100
- 238,870 · -36.1%
Race, ethnicity, and origin ACS 2023
- Neighborhood character
- Predominantly White (93%)
- Race & ethnicity
- White 93% Two or more races 4% Hispanic / Latino 2% Black 1%
- Common ancestry
- Romanian 3% Lithuanian 2% Slovak 2%
- Foreign-born
- 1% · Canada
- Languages at home
- 97% English-only · Spanish 1% Arabic 1%
Political lean MEDSL · Stark
- 2024 margin
- Strong R (+21.9) · D 38.6% · R 60.5%
- 2008→2024 swing
- -27.4pp toward R · 2008: 5.5pp · 2024: -21.9pp
- All cycles
- 2024: R+21.9 2020: R+18.5 2016: R+17.4 2012: R+0.4 2008: D+5.5
Not yet ingested
- Civics
- —
Market trends
- HPI YoY
- ▼ -163.61%
- Current HPI
- 207.6115
- Rent YoY
- —
- Metro
- Canton-Massillon, OH
- State GDP YoY
- ▲ 1.98%
- F500 in state
- 48
Industry mix (Fortune 500 HQ in OH)
| Industry | F500 HQs | Revenue |
|---|---|---|
| Insurance | 3 | $145B |
|
||
| Industrial Machinery | 3 | $49B |
|
||
| Financial Services | 3 | $24B |
|
||
| Consumer Goods | 2 | $93B |
|
||
| Aerospace / Defense | 2 | $47B |
|
||
| Utilities | 2 | $33B |
|
||
Price history
+316.0% since first listed7 events — show timeline
- 2026-06-06 Listed $207,990 MLSNOW
- 2025-01-17 Sold (MLS) $56,000 MLSNOW
- 2024-12-09 Pending — MLSNOW
- 2024-12-06 Listing Removed — MLSNOW
- 2024-11-30 Listed $65,000 MLSNOW
- 2000-03-28 Sold (Public Records) $50,000 Public Records
- 2000-03-02 Listed $50,000 MLSNOW
Property tax history
+10.1%/yrLatest (2024): $2,771 · +9.5% YoY. Source: county tax records.
Cash-flow waterfall
monthlySold comps — $/sqft
last 12 mo · ≤1 miLoading sold comps…