214 N Willow St · Dana, IN
Flood risk 1/10 · Minimal
- FEMA flood zone
- X (unshaded)
- Chance of flooding over 30 yrs
- 0.0%
- Est. flood insurance / yr
- $507 – $1,088
Fire risk 1/10 · Minimal
- Est. fire insurance / yr
- $717 – $1,331
Heat risk 4/10 · Minor
- Hot days now (above 105°F)
- 7 days/yr
- Hot days in 30 yrs
- 18 days/yr
Wind risk 2/10 · Minimal
- Chance of severe wind over 30 yrs
- 1.0%
Air-quality risk 2/10 · Minimal
- Unhealthy air days now
- 1 days/yr
- Unhealthy air days in 30 yrs
- 1 days/yr
Risk factors via First Street. Map © Google.
Why this score? — see what drove the B grade
The composite is a weighted blend of 9 inputs, each scored 0–100. Each bar is that input's sub-score; the figure is the points it added to the 100-point composite (weight × sub-score).
- Cash flow +30.0/30.0
- 1% rule +10.0/10.0
- DSCR +10.0/10.0
- ARV discount +7.5/15.0
- Appreciation +6.8/10.0
- Schools +3.1/10.0
- Livability +2.8/5.0
- Rent growth +2.5/5.0
- Condition / age +2.2/5.0
$50,000
🖨 Deal sheet (PDF) 📄 Offer letter ✓ Due diligence
Listing remarks
If you& apos; re looking for a little something to call your own in a quiet little town, this would be it! This house has been loved by many families, all of which have added their own personal flare. An enclosed day room was added to the front of the house; an utility area was added on to the back of the house. A nice attached deck was added on at the back. The kitchen has been updated in recent years. The bathroom was the most recent remodel, completely changing the layout from how it once was. It is still a fixer-upper but little by little, it is getting there! Or if you& apos; re a person interested in making a & quot; flip& quot; , this house is an ideal buy. Additional
Key facts
- Attached deck
- Enclosed day room
- Remodeled bathroom
Tags
Neighborhood map
What this means for you Summary
Snapshot
- This is a 2-bed/1.0-bath other listed at $50k. Condition is rated fair.
Deal economics
- At list price, monthly cash flow is $478 ($6k/yr) — positive.
- The deal already cash-flows at list — no discount required.
- Meets the 1% rule at list price ($1k rent vs $50k).
- Recommended offer: $48k (3.0% below list) — sets the bar for market timing.
Location & tenants
- Location reads 55/100 on livability (#626 in IN) — a working-class tenant base; expect higher turnover. Strengths: cost of living A+, housing A-; Watch: crime D, amenities F, commute F.
- South Vermillion Community School Corporation (rural): math 31% / reading 42% proficiency, ranked #182 of 301 in IN (top 60%) — families likely to look elsewhere, expect single-tenant / working-renter base with shorter leases.
- Zoned schools: Ernie Pyle Elementary School (math 47% / reading 47%, grade D-, #325 of 994 statewide, top 36%, 224 students, 67% FRL); South Vermillion Middle School (math 25% / reading 39%, grade F, #190 of 330 statewide, top 59%, 343 students, 61% FRL); South Vermillion High School (math 27% / reading 62%, grade F, #169 of 369 statewide, top 51%, 478 students, 54% FRL) — zoned schools average 61% FRL vs 45% district-wide (16 pts higher); higher-poverty schools than district average — tighter screening recommended.
- Market conditions: 8 active listings in the ZIP; 28 units permitted in Vermillion County in 2024 (0 in 5+ unit buildings).
Forward outlook
- In year one you build about $2k of equity ($346 loan paydown + $2k appreciation (3.7% local appreciation)).
- Vermillion County population projected at -22% by 2050 — secular population decline; favor cash flow + early exit over multi-decade hold.
- At projected returns (3.7% appreciation + 3.0% rent growth), your $14k cash investment doubles in ~2 years — after that, you're playing with house money.
Negotiation context
- It's been on market 41 days — a 3% lower offer ($48k) is reasonable based on typical stale-listing flexibility.
Questions for the listing agent
- It's been on market 41 days. Have you received any prior offers? Is the seller open to a 3% concession, seller financing, or rate buy-down credit?
- Have any recent inspections been done? Can we get a copy of the seller's disclosures and any deferred-maintenance estimates?
- Built in 1963 — when were the roof, HVAC, electrical panel, plumbing, and water heater last replaced?
- Is there a deadline driving the sale (1031 exchange, divorce, estate, relocation)? That informs how much negotiation room exists.
- Schools are F-rated, which usually means shorter tenancies and higher turnover. Who's the typical renter profile here, and what's been the actual vacancy rate?
- Crime grade is D in this area — have there been break-ins, vandalism, or insurance claims at this property in the last 3 years? What carrier currently insures it and at what premium?
- What's the average days-on-market for RENTAL listings here right now (not sales)? A rising rental-DOM trend means longer vacancies and softer asking-rent achievability than the comps imply.
- What's the recent tenant-quality profile in this submarket — average credit score on applications, eviction rate, late-payment / NSF rate, and stable-employment percentage? A property-management company in the area should have these aggregated.
- How much new for-sale + rental construction is in the pipeline within 1–3 miles? Heavy new supply typically softens prices + rents 12–24 months out; constrained supply supports both.
Investment metrics
- 1% rule
- 2.08% ✓
- Cap rate
- 17.76%
- Cash-on-cash
- 40.94%
- DSCR
- 2.82
- GRM
- 4.0
CMA / ARV
No comps found within radius.
Projected returns pro-forma
3.66% appreciation · 3.0% rent growth · sell at horizon
- IRR
- 47.3%
- Equity multiple
- 3.73×
- Total profit
- $38,227
- Equity at exit
- $24,360
- IRR
- 46.4%
- Equity multiple
- 7.53×
- Total profit
- $91,353
- Equity at exit
- $39,073
Cash invested: $14,000 (down + closing). Projections, not guarantees.
Landlord ↔ Tenant lean methodology
- Overall (STATE)
- 90 Strongly Landlord-Friendly
- State Indiana
- 90 Strongly Landlord-Friendly · R+11
- County
- — inherits STATE
- City
- — inherits STATE
ZIP-level market 47847
- Home prices YoY
- 1.7%
- Active inventory
- 8
- Price-to-rent
- 4.0×
Monthly cashflow live
- Estimated rent
- $1,042 medium interval (Pro) →
- Mortgage (P&I)
- −$262
- Tax est. 1.5%
- −$62 /mo · $750/yr
- Insurance
- −$21
- HOA
- −$0
- Vacancy / Maint / Mgmt
- −$219
- Net cashflow
- $478
Break-even live
Sensitivity live
| Price | -10% $512 | -5% $495 | +0% $478 | +5% $460 | +10% $443 |
|---|---|---|---|---|---|
| Rent | -10% $395 | -5% $437 | +0% $478 | +5% $519 | +10% $560 |
| Rate | -1.0pp $503 | -0.5pp $490 | base $478 | +0.5pp $465 | +1.0pp $452 |
UW: 25.0% down · 7.5% · 30yr · 1.5% tax · 5.0% vac · 8.0% maint · 8.0% mgmt
Financing live
Cash to close
- Down payment
- $12,500
- Closing costs
- $1,500
- Reserves months
- —
- Total cash needed
- —
Loan-product check · same deal, 3 products live
Conventional
25% down · 7.5% · 30yr
- Down + closing
- —
- Monthly P&I
- —
- Monthly cashflow
- —
- DSCR
- —
- Eligible?
- —
Personal DTI + credit; lowest rate.
DSCR
20% down · 8.5% · 30yr
- Down + closing
- —
- Monthly P&I
- —
- Monthly cashflow
- —
- DSCR
- —
- Eligible?
- —
No personal income docs; deal must DSCR.
Hard money
10% down · 12.0% · 12mo
- Down + closing
- —
- Monthly P&I
- —
- Monthly cashflow
- —
- DSCR
- —
- Eligible?
- —
Short-term bridge; refi at stabilization.
Listing history 19 events
-
2026-06-22days on market $50,000 Active 41 DOM
-
2026-06-21days on market $50,000 Active 40 DOM
-
2026-06-21days on market $50,000 Active 39 DOM
-
2026-06-18days on market $50,000 Active 37 DOM
-
2026-06-17days on market $50,000 Active 36 DOM
-
2026-06-16days on market $50,000 Active 35 DOM
-
2026-06-15days on market $50,000 Active 34 DOM
-
2026-06-13days on market $50,000 Active 32 DOM
-
2026-06-12days on market $50,000 Active 31 DOM
-
2026-06-09days on market $50,000 Active 28 DOM
-
2026-06-08days on market $50,000 Active 27 DOM
-
2026-06-07days on market $50,000 Active 26 DOM
-
2026-06-07days on market $50,000 Active 25 DOM
-
2026-06-04days on market $50,000 Active 22 DOM
-
2026-06-02days on market $50,000 Active 21 DOM
-
2026-06-01days on market $50,000 Active 20 DOM
-
2026-05-31days on market $50,000 Active 19 DOM
-
2026-05-31days on market $50,000 Active 18 DOM
-
2026-05-12$50,000 Active
ⓘ Source: listings_history table (triggers on properties + properties_extension) + one-shot
backfill from property_details.listing_events for pre-trigger history.
Climate risk First Street
- Flood 1/10 Low FEMA zone X (unshaded) · 0% chance over 30 yrs
- Wildfire 1/10 Low
- Heat 4/10 Moderate 7 d/yr ≥105°F today · 18 d/yr by 30 yrs out
- Wind 2/10 Low 100% chance of damaging wind over 30 yrs
- Air quality 2/10 Low 1 unhealthy d/yr today · 1 by 30 yrs out
Nearby sold comps map
Loading sold comps map…
Walkable amenities ~0.75 mi
Loading nearby amenities…
Taxation est. · year 1
- Rental income
- $12,504
- − Mortgage interest
- −$2,801
- − Property taxes
- −$750
- − Insurance
- −$250
- − Repairs & maintenance
- −$1,000
- − Management
- −$1,000
- − Depreciation
- −$1,455
- Taxable income
- $5,248
- Est. tax owed @ 24.0%
- −$1,260
- After-tax cash flow
- $4,472/yr
For passive investors: Depreciation is non-cash, so a rental often shows a tax loss while cash-flowing — sheltering income. Rental losses are passive: they offset passive income freely, and up to $25,000/yr can offset ordinary (W-2) income if you actively participate and your MAGI is under $100k (phasing out to $0 by $150k); unused losses carry forward. On sale, claimed depreciation is recaptured at up to 25%, and gains may owe capital-gains tax (a 1031 exchange can defer both). Figures are a year-1 estimate at your 24.0% rate — not tax advice; consult a CPA.
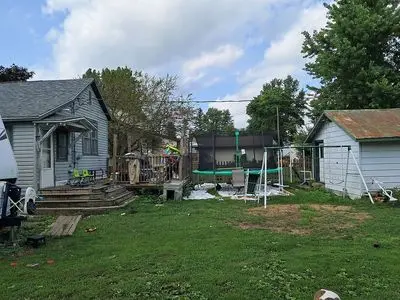
Condition & rehab AI · 2 photos
This home has been updated with a good kitchen and bathroom, but requires moderate repairs to the exterior siding and landscaping to improve its overall condition and value.
Repairs flagged
- Moderate Siding — Weathered appearance
- Minor Landscaping — Overgrown areas and debris
Value-add opportunities
- Resale Paint exterior walls — Fresh paint enhances curb appeal and property value.
- Both Landscaping and debris removal — Improved landscaping and removal of debris would enhance both resale and rental value.
- Resale Replace weathered siding — Fresh siding would significantly improve the home's appearance and value.
Renovation cost estimate screening
| Repair item | Severity | Est. cost |
|---|---|---|
| Siding · Weathered appearance | Moderate | $3,000–15,000 |
| Landscaping · Overgrown areas and debris | Minor | $500–3,000 |
| Total estimated repair cost · 2 items | $3,500–18,000 |
Value-add ROI direction
- Resale Paint exterior walls — Fresh paint enhances curb appeal and property value. ↑
- Both Landscaping and debris removal — Improved landscaping and removal of debris would enhance both resale and rental value. ↑
- Resale Replace weathered siding — Fresh siding would significantly improve the home's appearance and value. ↑
ⓘ Cost ranges are severity-bucket heuristics (US national rule-of-thumb). Get contractor quotes + a written scope before underwriting a rehab budget.
Schools (NCES district)
- District
- South Vermillion Community School Corporation
- NCES district ID
- 1810590
- Math proficiency
- 31% ▼ -6.00%
- Reading proficiency
- 42% ▬ 0.00%
- Median HH income
- $42,809
- Composite
- 30.87/100
- National rank
- #6123
- State rank
- #182 of 301 in IN
Livability — Dana
- Score
- 55/100
- State rank
- #626
- US rank
- #23211
Category grades
Schools grade is shown separately in the Schools card above.
Census & demographics
- Census place
- Dana, IN
- Population (ZIP)
- 869
Population outlook (Vermillion County) Hauer SSP2
- Today (2025)
- 14,605 people
- By 2030
- 13,942 · -4.5%
- By 2040
- 12,592 · -13.8%
- By 2050
- 11,381 · -22.1%
- By 2075
- 9,063 · -37.9%
- By 2100
- 7,098 · -51.4%
Race, ethnicity, and origin ACS 2023
- Neighborhood character
- Predominantly White (96%)
- Race & ethnicity
- White 96% Two or more races 4%
- Common ancestry
- Slovak 3% Lithuanian 3% Romanian 3%
Political lean MEDSL · Vermillion
- 2024 margin
- Solid R (+44.7) · D 26.6% · R 71.3% · Other 2.1%
- 2008→2024 swing
- -58.7pp toward R · 2008: 13.9pp · 2024: -44.7pp
- All cycles
- 2024: R+44.7 2020: R+40.6 2016: R+35.1 2012: R+6.8 2008: D+13.9
Not yet ingested
- Civics
- —
Market trends
- HPI YoY
- ▲ 3.66%
- Current HPI
- 221.4088
- Rent YoY
- —
- Metro
- —
- State GDP YoY
- ▲ 2.90%
- F500 in state
- 18
Industry mix (Fortune 500 HQ in IN)
| Industry | F500 HQs | Revenue |
|---|---|---|
| Industrial Machinery | 2 | $37B |
|
||
| Healthcare | 1 | $177B |
|
||
| Pharmaceuticals | 1 | $45B |
|
||
| Metals / Steel | 1 | $18B |
|
||
| Agriculture | 1 | $17B |
|
||
| Packaging | 1 | $12B |
|
||
Price history
1 event — show timeline
- 2026-05-12 Listed $50,000 FSBO.com
Cash-flow waterfall
monthlySold comps — $/sqft
last 12 mo · ≤1 miLoading sold comps…