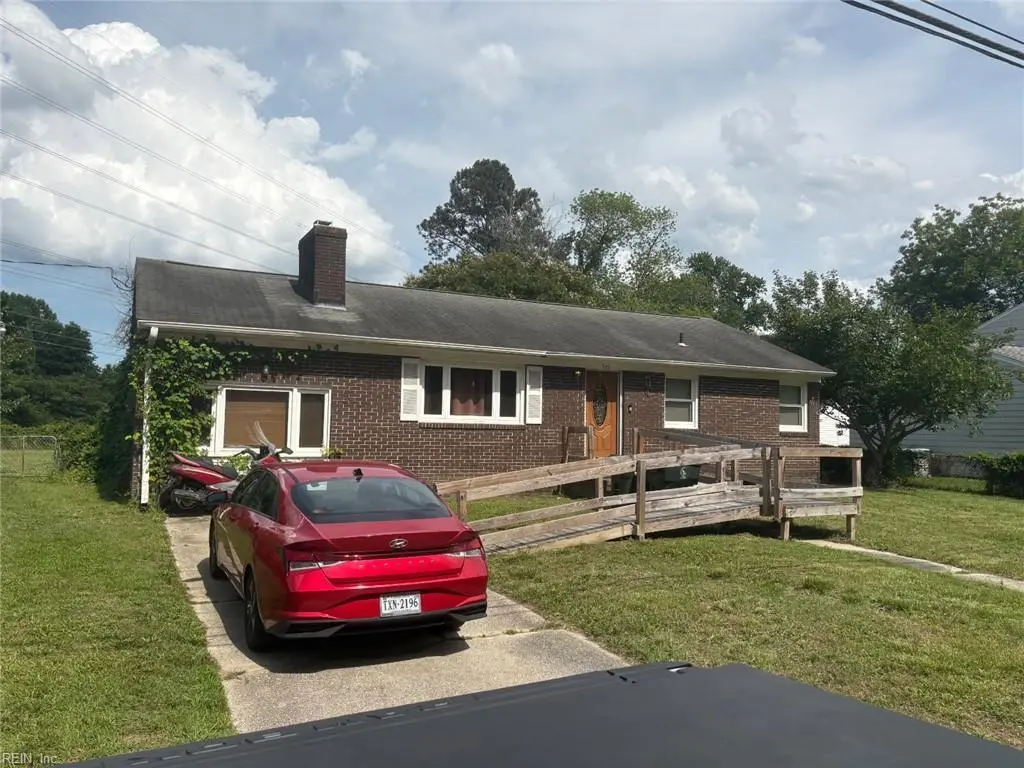
505 Hubbard Ln · Williamsburg, VA
Flood risk 1/10 · Minimal
- FEMA flood zone
- X (unshaded)
- Chance of flooding over 30 yrs
- 0.0%
- Est. flood insurance / yr
- $507 – $1,088
Fire risk 1/10 · Minimal
- Est. fire insurance / yr
- $666 – $1,236
Heat risk 8/10 · Major
- Hot days now (above 107°F)
- 7 days/yr
- Hot days in 30 yrs
- 16 days/yr
Wind risk 8/10 · Major
- Chance of severe wind over 30 yrs
- 80.0%
Air-quality risk 2/10 · Minimal
- Unhealthy air days now
- 1 days/yr
- Unhealthy air days in 30 yrs
- 1 days/yr
Risk factors via First Street. Map © Google.
Why this score? — see what drove the B grade
The composite is a weighted blend of 9 inputs, each scored 0–100. Each bar is that input's sub-score; the figure is the points it added to the 100-point composite (weight × sub-score).
- Cash flow +25.4/30.0
- ARV discount +15.0/15.0
- DSCR +8.4/10.0
- Schools +7.2/10.0
- 1% rule +6.0/10.0
- Livability +4.2/5.0
- Rent growth +3.8/5.0
- Condition / age +2.5/5.0
- Appreciation +0.0/10.0
$230,000
🖨 Deal sheet (PDF) 📄 Offer letter ✓ Due diligence
Listing remarks MLS
SOLID BRICK RANCH WITH CONVERTED GARAGE, FENCED YARD WITH STORAGE SHEDS, HARDWOOD FLOORS, FULL FIREPLACE, CEILING FANS, REPAINTING EXTERIOR.
Key facts
- 0.31 acre lot
- Built 1962
Neighborhood map
What this means for you Summary
Snapshot
- This is a 4-bed/1.5-bath single-family listed at $230k.
Deal economics
- At list price, monthly cash flow is $527 ($6k/yr) — positive.
- The deal already cash-flows at list — no discount required.
- Meets the 1% rule at list price ($3k rent vs $230k).
- Cap rate 9.0% vs local median 3.1% in Williamsburg — top-decile yield for the area; either an underpriced asset or a hidden risk that comps aren't pricing in. Stress-test before assuming the spread holds.
Location & tenants
- Location reads 84/100 on livability (#31 in VA, #734 nationally) — a professional / high-income tenant draw. Strengths: amenities A+, commute A+, health & safety A+; Watch: cost of living D.
- York County Public School District (suburban): math 77% / reading 87% proficiency, ranked #3 of 131 in VA (top 2%) — strong family-tenant draw, lease renewals of 3-5y typical; only 15% free/reduced lunch — higher-income household profile.
- Zoned schools: Magruder Elementary (math 68% / reading 78%, grade A, #259 of 1,108 statewide, top 24%, 663 students, 47% FRL); Grafton High (math 74% / reading 93%, grade A, #30 of 319 statewide, top 10%, 1,212 students, 60% FRL) — zoned schools average 54% FRL vs 15% district-wide (39 pts higher); higher-poverty schools than district average — tighter screening recommended.
- Market conditions: Rents rising fast (+5.2%/yr); 390 active listings in the ZIP; 9 comparable units currently listed for rent nearby; rentals leasing fast (median 13d on market — plan ~1-2 weeks tenant-placement turnaround); solid renter incomes; 187 units permitted in York County in 2024 (0 in 5+ unit buildings).
Forward outlook
- Local home prices are declining (-3.0%/yr); year-one equity from $2k of loan paydown is wiped out by about $7k of value loss. Plan a longer hold.
- York County population projected at +16% by 2050 — long-run rental-demand tailwind backs the buy-and-hold thesis.
- At projected returns (-3.0% appreciation + 5.2% rent growth), your $64k cash investment doubles in ~9 years — after that, you're playing with house money.
Negotiation context
- Only 0 days on market — expect competitive offers; lowballing is unlikely to land.
- 2 sale attempts since 24y ago with the ask held roughly flat each time — persistent listings suggest the price (not the market) is what's stuck; bring a comps-based counter.
- Current owner paid $113k; list at $230k implies a 104% gain — meaningful room to come down on a strong offer.
Risks & watch-outs
- Climate carrying-cost: severe wind risk, 80% chance of damaging wind over 30y; extreme-heat days projected 7→16/yr by 2055 (HVAC capex compounding) — expect insurance premiums to compound above CPI over the hold.
Questions for the listing agent
- Built in 1962 — when were the roof, HVAC, electrical panel, plumbing, and water heater last replaced?
- Is there a deadline driving the sale (1031 exchange, divorce, estate, relocation)? That informs how much negotiation room exists.
- Schools are A-rated — typically a magnet for longer-tenancy family renters. What's the average tenant stay here, and is there a school-zone premium baked into asking?
- What's the average days-on-market for RENTAL listings here right now (not sales)? A rising rental-DOM trend means longer vacancies and softer asking-rent achievability than the comps imply.
- What's the recent tenant-quality profile in this submarket — average credit score on applications, eviction rate, late-payment / NSF rate, and stable-employment percentage? A property-management company in the area should have these aggregated.
- How much new for-sale + rental construction is in the pipeline within 1–3 miles? Heavy new supply typically softens prices + rents 12–24 months out; constrained supply supports both.
Investment metrics
- 1% rule
- 1.10% ✓
- Cap rate
- 9.04%
- Cash-on-cash
- 9.82%
- DSCR
- 1.44
- GRM
- 7.6
CMA / ARV
- ARV (on-the-fly)
- $395,064
- Comps found
- 12
Show comp detail 12 sales within ~0.75 mi
| Address | Dist | Beds/Ba | Sqft | Sold | Price | $/sf | Match |
|---|---|---|---|---|---|---|---|
| 505 Hubbard Ln | 0.00mi | 3/2.0 (-1) | 1,674 (0%) | 0mo | $230,000 | $137 | 93 |
| 105 Glenn Cir | 0.11mi | 4/1.5 | 1,698 (+1%) | 5mo | $379,000 | $223 | 88 |
| 604 Musket Dr | 0.26mi | 3/2.5 (-1) | 1,606 (-4%) | 0mo | $387,000 | $241 | 72 |
| 113 Hickory Hills Dr | 0.42mi | 3/2.5 (-1) | 1,664 (-1%) | 5mo | $374,900 | $225 | 66 |
| 102 Springfield Dr | 0.69mi | 4/2.5 | 1,675 (+0%) | 2mo | $364,900 | $218 | 62 |
| 117 W Semple Rd | 0.44mi | 3/2.0 (-1) | 1,601 (-4%) | 5mo | $268,000 | $167 | 61 |
| 108 Burgundy Rd | 0.55mi | 3/2.5 (-1) | 1,720 (+3%) | 3mo | $348,000 | $202 | 58 |
| 105 Rusty Ct | 0.44mi | 3/2.5 (-1) | 1,544 (-8%) | 3mo | $365,000 | $236 | 55 |
| 102 Bordeaux Ct | 0.51mi | 3/2.5 (-1) | 1,500 (-10%) | 2mo | $367,000 | $245 | 48 |
| 598 Burnham Rd | 0.58mi | 3/2.5 (-1) | 1,826 (+9%) | 4mo | $475,000 | $260 | 45 |
| 104 Rusty Ct | 0.46mi | 3/2.5 (-1) | 1,455 (-13%) | 6mo | $348,000 | $239 | 43 |
| 108 Chardonnay Rd | 0.60mi | 3/2.5 (-1) | 1,467 (-12%) | 3mo | $365,000 | $249 | 40 |
Match score weights: distance 35% · size 25% · config 20% · recency 20%. Top-matched comps best support the ARV.
Projected returns pro-forma
-3.0% appreciation · 5.21% rent growth · sell at horizon
- IRR
- 0.8%
- Equity multiple
- 1.03×
- Total profit
- $2,017
- Equity at exit
- $34,294
- IRR
- 12.4%
- Equity multiple
- 2.08×
- Total profit
- $69,597
- Equity at exit
- $19,886
Cash invested: $64,400 (down + closing). Projections, not guarantees.
Landlord ↔ Tenant lean methodology
- Overall (STATE)
- 55 Moderately Landlord-Leaning
- State Virginia
- 55 Moderately Landlord-Leaning · D+2
- County
- — inherits STATE
- City
- — inherits STATE
ZIP-level market 23185
- Rents YoY
- 5.2%
- Active inventory
- 390
- Price-to-rent
- 7.6×
Monthly cashflow live
- Estimated rent
- $2,538 high interval (Pro) →
- Mortgage (P&I)
- −$1,206
- Tax from tax record
- −$176 /mo · $2,113/yr
- Insurance
- −$96
- HOA
- −$0
- Vacancy / Maint / Mgmt
- −$533
- Net cashflow
- $527
Break-even live
Sensitivity live
| Price | -10% $657 | -5% $592 | +0% $527 | +5% $462 | +10% $397 |
|---|---|---|---|---|---|
| Rent | -10% $326 | -5% $427 | +0% $527 | +5% $627 | +10% $727 |
| Rate | -1.0pp $643 | -0.5pp $585 | base $527 | +0.5pp $467 | +1.0pp $407 |
UW: 25.0% down · 7.5% · 30yr · 1.5% tax · 5.0% vac · 8.0% maint · 8.0% mgmt
Financing live
Cash to close
- Down payment
- $57,500
- Closing costs
- $6,900
- Reserves months
- —
- Total cash needed
- —
Loan-product check · same deal, 3 products live
Conventional
25% down · 7.5% · 30yr
- Down + closing
- —
- Monthly P&I
- —
- Monthly cashflow
- —
- DSCR
- —
- Eligible?
- —
Personal DTI + credit; lowest rate.
DSCR
20% down · 8.5% · 30yr
- Down + closing
- —
- Monthly P&I
- —
- Monthly cashflow
- —
- DSCR
- —
- Eligible?
- —
No personal income docs; deal must DSCR.
Hard money
10% down · 12.0% · 12mo
- Down + closing
- —
- Monthly P&I
- —
- Monthly cashflow
- —
- DSCR
- —
- Eligible?
- —
Short-term bridge; refi at stabilization.
Rent comps 9 comps
| Address | Beds | Baths | Sqft | Rent | $/sqft | DOM | Units | Dist |
|---|---|---|---|---|---|---|---|---|
| 211 Hubbard Ln Williamsburg, VA | 3.0 | 1.0 | 1267 | $1,800 | $1.42 | 17d | 1 | 0.39mi |
| 304 Brittania Dr Williamsburg, VA | 3.0 | 2.5 | 1545 | $2,650 | $1.72 | 13d | 1 | 0.46mi |
| 104 Merlot Dr Williamsburg, VA | 3.0 | 3.0 | 1467 | $2,350 | $1.60 | 44d | 1 | 0.51mi |
| 112 Semple Rd Unit NA Williamsburg, VA | 3.0 | 2.0 | 1120 | $2,100 | $1.88 | 2d | 1 | 0.54mi |
| 105 Chardonnay Rd Williamsburg, VA | 3.0 | 2.5 | 1720 | $2,895 | $1.68 | 44d | 1 | 0.57mi |
| 612 Queens Creek Rd Williamsburg, VA | 3.0 | 2.5 | 2108 | $2,495 | $1.18 | 2d | 1 | 0.76mi |
| 1183 Penniman Rd Williamsburg, VA | 3.0 | 2.0 | 1098 | $2,075 | $1.89 | 2d | 1 | 0.88mi |
| 200 Mal Mae Ct Williamsburg, VA | 1.0–3.0 | 1.0–1.5 | 985 | $1,700 | $1.73 | 2d | 7 | 0.96mi |
| 301 Starkey Pl Williamsburg, VA | 4.0 | 2.5 | 2168 | $2,995 | $1.38 | 44d | 1 | 1.47mi |
Listing history 2 events
-
2026-06-02remarks 699-char remark
-
2026-06-02$230,000 Under Contract
ⓘ Source: listings_history table (triggers on properties + properties_extension) + one-shot
backfill from property_details.listing_events for pre-trigger history.
Tax reassessment forecast VA · Resets to sale price
- Current annual tax
- $2,113 · $176/mo
- Projected year-2 tax
- $2,113 · $176/mo
- Expected delta
- $0/yr ($0/mo · 0.0%)
ⓘ Screening estimate from a state-policy table — verify with the county assessor before closing.
Climate risk First Street
- Flood 1/10 Low FEMA zone X (unshaded) · 0% chance over 30 yrs
- Wildfire 1/10 Low
- Heat 8/10 Severe 7 d/yr ≥107°F today · 16 d/yr by 30 yrs out
- Wind 8/10 Severe 80% chance of damaging wind over 30 yrs
- Air quality 2/10 Low 1 unhealthy d/yr today · 1 by 30 yrs out
Nearby sold comps map
Loading sold comps map…
Walkable amenities ~0.75 mi
Loading nearby amenities…
Taxation est. · year 1
- Rental income
- $30,453
- − Mortgage interest
- −$12,884
- − Property taxes
- −$2,113
- − Insurance
- −$1,150
- − Repairs & maintenance
- −$2,436
- − Management
- −$2,436
- − Depreciation
- −$6,691
- Taxable income
- $2,743
- Est. tax owed @ 24.0%
- −$658
- After-tax cash flow
- $5,663/yr
For passive investors: Depreciation is non-cash, so a rental often shows a tax loss while cash-flowing — sheltering income. Rental losses are passive: they offset passive income freely, and up to $25,000/yr can offset ordinary (W-2) income if you actively participate and your MAGI is under $100k (phasing out to $0 by $150k); unused losses carry forward. On sale, claimed depreciation is recaptured at up to 25%, and gains may owe capital-gains tax (a 1031 exchange can defer both). Figures are a year-1 estimate at your 24.0% rate — not tax advice; consult a CPA.
Schools (NCES district)
- District
- York County Public School District
- NCES district ID
- 5104150
- Math proficiency
- 77% ▼ -15.00%
- Reading proficiency
- 87% ▼ -1.00%
- Median HH income
- $81,985
- Composite
- 72.34/100
- National rank
- #202
- State rank
- #3 of 131 in VA
Livability — Williamsburg
- Score
- 84/100
- State rank
- #31
- US rank
- #734
Category grades
Schools grade is shown separately in the Schools card above.
Census & demographics
- County
- Williamsburg City · 55,270 people
- City population
- 101,073
- Metro
- Virginia Beach-Norfolk-Newport News, VA-NC
- Population (ZIP)
- 55,270
- Household income
- $105,431
- Rent vs Own
- Severe rent burden
- 1770.0
Population outlook (York County) Hauer SSP2
- Today (2025)
- 75,000 people
- By 2030
- 78,122 · +4.2%
- By 2040
- 83,329 · +11.1%
- By 2050
- 87,381 · +16.5%
- By 2075
- 99,308 · +32.4%
- By 2100
- 101,751 · +35.7%
Race, ethnicity, and origin ACS 2023
- Neighborhood character
- Predominantly White (71%)
- Race & ethnicity
- White 71% Black 14% Two or more races 9% Hispanic / Latino 8% Asian 4%
- Hispanic origin (detail)
- Mexican 2% Puerto Rican 3%
- Common ancestry
- Slovak 3% Lithuanian 3% Romanian 3%
- Foreign-born
- 8% · Canada, China, Vietnam
- Languages at home
- 89% English-only · Spanish 5% Other Indo-European 1% Chinese 1%
Political lean MEDSL · York
- 2024 margin
- Lean R (+6.1) · D 46.3% · R 52.4% · Other 1.3%
- 2008→2024 swing
- +11.9pp toward D · 2008: -18.1pp · 2024: -6.1pp
- All cycles
- 2024: R+6.1 2020: R+6.6 2016: R+17.1 2012: R+20.7 2008: R+18.1
Not yet ingested
- Civics
- —
Market trends
- HPI YoY
- ▼ -345.15%
- Current HPI
- 240.1637
- Rent YoY
- ▲ 5.21%
- Metro
- Virginia Beach-Norfolk-Newport News, VA-NC
- State GDP YoY
- ▲ 2.40%
- F500 in state
- 50
Industry mix (Fortune 500 HQ in VA)
| Industry | F500 HQs | Revenue |
|---|---|---|
| Aerospace / Defense | 4 | $236B |
|
||
| Technology / Defense | 3 | $32B |
|
||
| Financial Services | 2 | $176B |
|
||
| Utilities | 2 | $27B |
|
||
| Insurance | 2 | $25B |
|
||
| Technology | 2 | $15B |
|
||
Price history
+194.9% since first listed6 events — show timeline
- 2026-06-02 Listing Removed — REINMLS
- 2026-06-01 Listed $230,000 REINMLS
- 2003-02-24 Sold (Public Records) $112,900 Public Records
- 2003-02-21 Sold (MLS) $112,900 WMLS
- 2002-12-18 Listed $112,900 WMLS
- 1997-06-20 Sold (Public Records) $78,000 Public Records
Property tax history
+5.5%/yrLatest (2025): $2,113 · +19.4% YoY. Source: county tax records.
Cash-flow waterfall
monthlySold comps — $/sqft
last 12 mo · ≤1 miLoading sold comps…