229 N 2nd St · Fairfax, OK
Flood risk 1/10 · Minimal
- FEMA flood zone
- X (unshaded)
- Chance of flooding over 30 yrs
- 0.0%
- Est. flood insurance / yr
- $507 – $1,088
Fire risk 8/10 · Major
- Est. fire insurance / yr
- $2,463 – $4,575
Heat risk 6/10 · Moderate
- Hot days now (above 109°F)
- 7 days/yr
- Hot days in 30 yrs
- 19 days/yr
Wind risk 2/10 · Minimal
- Chance of severe wind over 30 yrs
- 2.0%
Air-quality risk 2/10 · Minimal
- Unhealthy air days now
- 1 days/yr
- Unhealthy air days in 30 yrs
- 1 days/yr
Risk factors via First Street. Map © Google.
Why this score? — see what drove the B+ grade
The composite is a weighted blend of 9 inputs, each scored 0–100. Each bar is that input's sub-score; the figure is the points it added to the 100-point composite (weight × sub-score).
- Cash flow +30.0/30.0
- 1% rule +10.0/10.0
- DSCR +10.0/10.0
- Appreciation +10.0/10.0
- ARV discount +7.5/15.0
- Livability +3.0/5.0
- Rent growth +2.5/5.0
- Condition / age +2.5/5.0
- Schools +1.6/10.0
$55,000
🖨 Deal sheet (PDF) 📄 Offer letter ✓ Due diligence
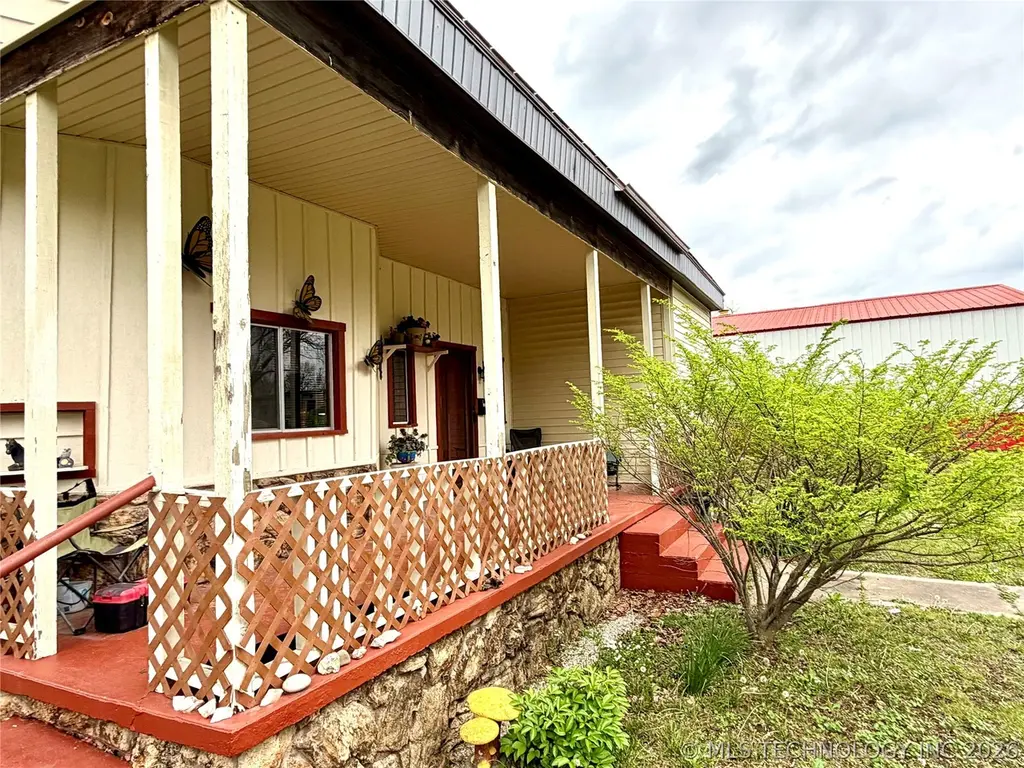
Listing remarks
Three bedroom one bathroom home, plus a huge shop. Ready for your upgrades and updates. Clean and cozy smoke free and pet free home. Enjoy quiet mornings at the screened in back porch or watch the birds at the big covered front porch. Perfectly located just around the corner from main street with the local bank, city hall, public library, and the grocery store are all close by. Oversized detached garage/workshop has storage shelves, electric, and room for three cars or more. Double gate at the alley allows easy access to additional parking for an RV or boat. Washer, dryer, refrigerator, and most of the furniture will remain with an acceptable offer. Scroll down to find the listing agent inf
Key facts
- 0.28 acre lot
- 3 garage spots
- Built 1940
Tags
Property features AI
Finance
- HOA & community: Gutters noted as a community/feature
Exterior
- Parking: Detached garage with 3 parking spaces; Garage includes shelving and workshop area; RV access/parking; Boat parking available
- Security: Smoke detectors; No safety shelter
- Utilities: Public water; Public sewer; Electricity available; Cable available; Phone service available
- Home design: Single-story home; Faces east; Crawlspace foundation
- Construction: Stone and wood frame construction; Asphalt/fiberglass roof
- Exterior features: Covered, enclosed porch; Rain gutters; Partial chain link fencing; Workshop structure on property; Less than 5 miles to Arkansas River
Interior
- Kitchen: Country-style kitchen; Microwave; Oven; Range; Refrigerator
- Bedrooms: Three first-floor bedrooms (no attached baths)
- Flooring: Carpet; Laminate
- Bathrooms: One full bathroom (hall/full bath, first floor)
- Heating & cooling: Window cooling units; Electric baseboard heating
- Interior features: Aluminum window frames with storm windows; Laminate counters; Cable TV available; Ceiling fans; Electric oven connection
- Laundry & utility: Washer; Dryer; Electric dryer hookup; Electric water heater
Neighborhood map
What this means for you Summary
Snapshot
- This is a 2-bed/1.0-bath single-family listed at $55k.
Deal economics
- At list price, monthly cash flow is $442 ($5k/yr) — positive.
- The deal already cash-flows at list — no discount required.
- Meets the 1% rule at list price ($972 rent vs $55k).
- Recommended offer: $53k (3.0% below list) — sets the bar for market timing.
Location & tenants
- Location reads 60/100 on livability (#366 in OK) — a middle-class / working-renter tenant base. Strengths: cost of living A+, housing A+; Watch: schools F, amenities F, commute F.
- Woodland (rural): math 15% / reading 23% proficiency, ranked #192 of 270 in OK (top 71%) — low school quality limits family demand, transient renter base, plan for 1-2y turnover; 67% free/reduced lunch — lower-income household profile, screen leases tightly.
- Market conditions: 7 active listings in the ZIP; 89 units permitted in Osage County in 2024 (0 in 5+ unit buildings).
Forward outlook
- In year one you build about $6k of equity ($380 loan paydown + $6k appreciation (10.0% local appreciation)).
- Osage County population projected to shrink 6% by 2050 — rents likely to lag national; underwrite the cash flow, not the appreciation.
- At projected returns (10.0% appreciation + 3.0% rent growth), your $15k cash investment doubles in ~2 years — after that, you're playing with house money.
- By year 6, paydown + projected appreciation supports a ~$35k cash-out refi (75% LTV) — recoverable capital for the next deal without selling this one.
Negotiation context
- It's been on market 49 days — a 3% lower offer ($53k) is reasonable based on typical stale-listing flexibility.
Risks & watch-outs
- Watch-outs: built in 1940 — expect roof / HVAC / electrical / plumbing capex.
- Climate carrying-cost: severe wildfire risk; extreme-heat days projected 7→19/yr by 2055 (HVAC capex compounding) — expect insurance premiums to compound above CPI over the hold.
Questions for the listing agent
- It's been on market 49 days. Have you received any prior offers? Is the seller open to a 3% concession, seller financing, or rate buy-down credit?
- Built in 1940 — when were the roof, HVAC, electrical panel, plumbing, and water heater last replaced?
- Is there a deadline driving the sale (1031 exchange, divorce, estate, relocation)? That informs how much negotiation room exists.
- Schools are F-rated, which usually means shorter tenancies and higher turnover. Who's the typical renter profile here, and what's been the actual vacancy rate?
- What's the average days-on-market for RENTAL listings here right now (not sales)? A rising rental-DOM trend means longer vacancies and softer asking-rent achievability than the comps imply.
- What's the recent tenant-quality profile in this submarket — average credit score on applications, eviction rate, late-payment / NSF rate, and stable-employment percentage? A property-management company in the area should have these aggregated.
- How much new for-sale + rental construction is in the pipeline within 1–3 miles? Heavy new supply typically softens prices + rents 12–24 months out; constrained supply supports both.
Investment metrics
- 1% rule
- 1.77% ✓
- Cap rate
- 15.95%
- Cash-on-cash
- 34.48%
- DSCR
- 2.53
- GRM
- 4.7
CMA / ARV
No comps found within radius.
Projected returns pro-forma
10.0% appreciation · 3.0% rent growth · sell at horizon
- IRR
- 50.7%
- Equity multiple
- 4.77×
- Total profit
- $58,118
- Equity at exit
- $49,548
- IRR
- 44.3%
- Equity multiple
- 10.67×
- Total profit
- $148,947
- Equity at exit
- $106,853
Cash invested: $15,400 (down + closing). Projections, not guarantees.
Landlord ↔ Tenant lean methodology
- Overall (STATE)
- 83 Strongly Landlord-Friendly
- State Oklahoma
- 83 Strongly Landlord-Friendly · R+20
- County
- — inherits STATE
- City
- — inherits STATE
ZIP-level market 74637
- Home prices YoY
- 11.6%
- Active inventory
- 7
- Price-to-rent
- 4.7×
Monthly cashflow live
- Estimated rent
- $972 medium interval (Pro) →
- Mortgage (P&I)
- −$288
- Tax from tax record
- −$14 /mo · $165/yr
- Insurance
- −$23
- HOA
- −$0
- Vacancy / Maint / Mgmt
- −$204
- Net cashflow
- $442
Break-even live
Sensitivity live
| Price | -10% $474 | -5% $458 | +0% $442 | +5% $427 | +10% $411 |
|---|---|---|---|---|---|
| Rent | -10% $366 | -5% $404 | +0% $442 | +5% $481 | +10% $519 |
| Rate | -1.0pp $470 | -0.5pp $456 | base $442 | +0.5pp $428 | +1.0pp $414 |
UW: 25.0% down · 7.5% · 30yr · 1.5% tax · 5.0% vac · 8.0% maint · 8.0% mgmt
Financing live
Cash to close
- Down payment
- $13,750
- Closing costs
- $1,650
- Reserves months
- —
- Total cash needed
- —
Loan-product check · same deal, 3 products live
Conventional
25% down · 7.5% · 30yr
- Down + closing
- —
- Monthly P&I
- —
- Monthly cashflow
- —
- DSCR
- —
- Eligible?
- —
Personal DTI + credit; lowest rate.
DSCR
20% down · 8.5% · 30yr
- Down + closing
- —
- Monthly P&I
- —
- Monthly cashflow
- —
- DSCR
- —
- Eligible?
- —
No personal income docs; deal must DSCR.
Hard money
10% down · 12.0% · 12mo
- Down + closing
- —
- Monthly P&I
- —
- Monthly cashflow
- —
- DSCR
- —
- Eligible?
- —
Short-term bridge; refi at stabilization.
Listing history 3 events
-
2026-05-22status Pending
-
2026-04-28price $55,000
-
2026-04-03$65,000 Active
ⓘ Source: listings_history table (triggers on properties + properties_extension) + one-shot
backfill from property_details.listing_events for pre-trigger history.
Tax reassessment forecast OK · Resets to sale price
- Current annual tax
- $165 · $14/mo
- Projected year-2 tax
- $495 · $41/mo
- Expected delta
- +$330/yr (+$27/mo · 200.0%)
ⓘ Screening estimate from a state-policy table — verify with the county assessor before closing.
Climate risk First Street
- Flood 1/10 Low FEMA zone X (unshaded) · 0% chance over 30 yrs
- Wildfire 8/10 Severe
- Heat 6/10 Major 7 d/yr ≥109°F today · 19 d/yr by 30 yrs out
- Wind 2/10 Low 2% chance of damaging wind over 30 yrs
- Air quality 2/10 Low 1 unhealthy d/yr today · 1 by 30 yrs out
Nearby sold comps map
Loading sold comps map…
Walkable amenities ~0.75 mi
Loading nearby amenities…
Taxation est. · year 1
- Rental income
- $11,660
- − Mortgage interest
- −$3,081
- − Property taxes
- −$165
- − Insurance
- −$275
- − Repairs & maintenance
- −$933
- − Management
- −$933
- − Depreciation
- −$1,600
- Taxable income
- $4,673
- Est. tax owed @ 24.0%
- −$1,122
- After-tax cash flow
- $4,188/yr
For passive investors: Depreciation is non-cash, so a rental often shows a tax loss while cash-flowing — sheltering income. Rental losses are passive: they offset passive income freely, and up to $25,000/yr can offset ordinary (W-2) income if you actively participate and your MAGI is under $100k (phasing out to $0 by $150k); unused losses carry forward. On sale, claimed depreciation is recaptured at up to 25%, and gains may owe capital-gains tax (a 1031 exchange can defer both). Figures are a year-1 estimate at your 24.0% rate — not tax advice; consult a CPA.
Schools (NCES district)
- District
- Woodland
- NCES district ID
- 4030048
- Math proficiency
- 15% ▬ 0.00%
- Reading proficiency
- 23% ▼ -1.00%
- Median HH income
- $34,036
- Composite
- 15.53/100
- National rank
- #9300
- State rank
- #192 of 270 in OK
Livability — Fairfax
- Score
- 60/100
- State rank
- #366
- US rank
- #19529
Category grades
Schools grade is shown separately in the Schools card above.
Census & demographics
- Census place
- Fairfax, OK
- Population (ZIP)
- 1,501
Population outlook (Osage County) Hauer SSP2
- Today (2025)
- 48,950 people
- By 2030
- 48,936 · +-0.0%
- By 2040
- 47,826 · -2.3%
- By 2050
- 45,781 · -6.5%
- By 2075
- 41,140 · -16.0%
- By 2100
- 32,796 · -33.0%
Race, ethnicity, and origin ACS 2023
- Neighborhood character
- Diverse neighborhood (Simpson 0.59)
- Race & ethnicity
- White 64% Native American 19% Two or more races 12% Black 3% Hispanic / Latino 3%
- Common ancestry
- Italian 4% Slovak 2% Iranian 2%
- Foreign-born
- 1% · Canada
- Languages at home
- 96% English-only · Spanish 1%
Political lean MEDSL · Osage
- 2024 margin
- Solid R (+41.4) · D 28.4% · R 69.8% · Other 1.7%
- 2008→2024 swing
- -17.7pp toward R · 2008: -23.7pp · 2024: -41.4pp
- All cycles
- 2024: R+41.4 2020: R+39.5 2016: R+36.8 2012: R+25.2 2008: R+23.7
Not yet ingested
- Civics
- —
Market trends
- HPI YoY
- ▲ 29.61%
- Current HPI
- 285.9263
- Rent YoY
- —
- Metro
- —
- State GDP YoY
- ▲ 1.55%
- F500 in state
- 6
Industry mix (Fortune 500 HQ in OK)
| Industry | F500 HQs | Revenue |
|---|---|---|
| Energy | 3 | $48B |
|
||
Price history
-15.4% since first listed3 events — show timeline
- 2026-05-22 Pending — MLS Technology, Inc.
- 2026-04-28 Price Changed $55,000 MLS Technology, Inc.
- 2026-04-03 Listed $65,000 MLS Technology, Inc.
Property tax history
+0.7%/yrLatest (2025): $165 · +15.4% YoY. Source: county tax records.
Cash-flow waterfall
monthlySold comps — $/sqft
last 12 mo · ≤1 miLoading sold comps…