 Duplex
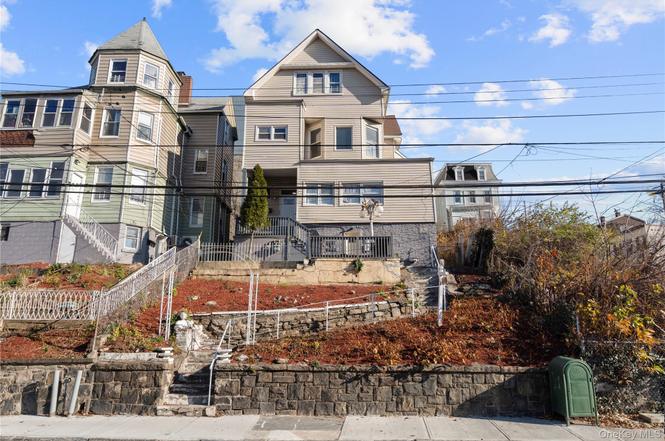
142 Buena Vista Ave · Yonkers, NY
Flood risk 1/10 · Minimal
- FEMA flood zone
- X (unshaded)
- Chance of flooding over 30 yrs
- 0.0%
- Est. flood insurance / yr
- $473 – $860
Fire risk 2/10 · Minimal
- Est. fire insurance / yr
- $691 – $1,283
Heat risk 6/10 · Moderate
- Hot days now (above 99°F)
- 7 days/yr
- Hot days in 30 yrs
- 15 days/yr
Wind risk 6/10 · Moderate
- Chance of severe wind over 30 yrs
- 27.0%
Air-quality risk 3/10 · Minor
- Unhealthy air days now
- 3 days/yr
- Unhealthy air days in 30 yrs
- 4 days/yr
Risk factors via First Street. Map © Google.
Why this score? — see what drove the F grade
The composite is a weighted blend of 9 inputs, each scored 0–100. Each bar is that input's sub-score; the figure is the points it added to the 100-point composite (weight × sub-score).
- Cash flow +6.4/30.0
- ARV discount +4.1/15.0
- Schools +4.1/10.0
- Rent growth +3.6/5.0
- Livability +3.4/5.0
- Condition / age +2.5/5.0
- 1% rule +1.5/10.0
- DSCR +0.7/10.0
- Appreciation +0.0/10.0
$900,000
🖨 Deal sheet (PDF) 📄 Offer letter ✓ Due diligence
Multi-family units
County records classify this as Multi-Family (2-4 Unit). Listing-text estimate: 2 units. confirmed
Listing remarks MLS
Very large two family home with views of the Hudson. First floor unit has fireplace (not in use) in living room and bedroom with updated kitchen. Semi finished in-law apt. in basement. Plumbing already installed for washer/dryer. Great investment potential! Below market rents, so huge upside for ROI. Additional Information: Amenities:Storage,
Key facts
- Two family home
- Waterfront location
- 3,485 sq ft lot
Tags
Neighborhood map
What this means for you Summary
Snapshot
- This is a 2 × 2-bed/?-bath units multifamily listed at $900k.
Deal economics
- At list price, monthly cash flow is $-2k ($-19k/yr) — negative. Per door: $-789/mo.
- To cash-flow at today's rent, offer at most $672k (25.4% below list).
- To meet the 1% rule (rent ≥ 1% of price), the offer needs to be $588k (34.7% below list).
- Recommended offer: $588k (34.7% below list) — sets the bar for 1% rule.
- Cap rate 4.2% vs local median 5.4% in Yonkers — below-typical yield; the buyer is paying a premium for something (appreciation thesis, condition, location) that the cap rate doesn't capture.
Location & tenants
- Location reads 68/100 on livability (#528 in NY) — a middle-class / working-renter tenant base. Strengths: employment A, commute B; Watch: amenities F, cost of living F.
- Yonkers City School District (suburban): math 41% / reading 54% proficiency, ranked #413 of 590 in NY (top 70%) — families likely to look elsewhere, expect single-tenant / working-renter base with shorter leases; 64% free/reduced lunch — lower-income household profile, screen leases tightly.
- Market conditions: Rents rising fast (+4.4%/yr); 185 active listings in the ZIP; 4 comparable units currently listed for rent nearby; rentals lingering (median 46d on market — plan ~5-8 weeks vacancy on turnover, expect pricing pressure); 50% of comp listings sitting > 30 days — soft ceiling on asking rent; 954 units permitted in Westchester County in 2024 (649 in 5+ unit buildings).
- At $5,875/mo this rent would consume 109% of the median local household income ($65k/yr) (locally 6045% of renters already pay >50% of income on rent) — very limited rent-growth headroom before tenants either downsize or default.
Forward outlook
- Local home prices are declining (-3.0%/yr); year-one equity from $6k of loan paydown is wiped out by about $27k of value loss. Plan a longer hold.
- Westchester County population projected at +10% by 2050 — modest demand growth; plan on rents tracking national, not racing it.
Negotiation context
- It's been on market 20 days — a 2% lower offer ($886k) is reasonable based on typical stale-listing flexibility.
- 6 sale attempts since 31y ago; this cycle's ask is 26766% above the opening price — seller raised mid-cycle; expect resistance to lowballs.
- Current owner paid $400k; list at $900k implies a 125% gain — meaningful room to come down on a strong offer.
Risks & watch-outs
- Watch-outs: built in 1900 — expect roof / HVAC / electrical / plumbing capex.
- Climate carrying-cost: major wind risk, 27% chance of damaging wind over 30y; extreme-heat days projected 7→15/yr by 2055 (HVAC capex compounding) — expect insurance premiums to compound above CPI over the hold.
Questions for the listing agent
- What do current leases actually rent for vs. the listed asking? Can we see a recent rent roll and the last 12 months of T-12 income?
- Can we see the unit-by-unit rent roll, current vacancy, and any below-market leases? What's the average tenancy length?
- What capital expenditures (roof, boiler, parking lot, exteriors) have been made in the last 5 years, and what's planned in the next 2?
- Built in 1900 — when were the roof, HVAC, electrical panel, plumbing, and water heater last replaced?
- Is there a deadline driving the sale (1031 exchange, divorce, estate, relocation)? That informs how much negotiation room exists.
- The area grade is low — what's the realistic commute time and amenity access for the typical tenant pool here? Any planned neighborhood developments (good or bad) we should know about?
- What's the average days-on-market for RENTAL listings here right now (not sales)? A rising rental-DOM trend means longer vacancies and softer asking-rent achievability than the comps imply.
- What's the recent tenant-quality profile in this submarket — average credit score on applications, eviction rate, late-payment / NSF rate, and stable-employment percentage? A property-management company in the area should have these aggregated.
- How much new apartment / multifamily construction is in the pipeline within 1–3 miles? Heavy new supply (>2% of stock underway) typically softens rents 12–24 months out; light construction supports rent growth.
Investment metrics
- 1% rule
- 0.65% ✗
- Cap rate
- 4.19%
- Cash-on-cash
- -7.52%
- DSCR
- 0.67
- GRM
- 12.8
CMA / ARV
- ARV (on-the-fly)
- $836,400
- Comps found
- 4
Show comp detail 4 sales within ~0.75 mi
| Address | Dist | Beds/Ba | Sqft | Sold | Price | $/sf | Match |
|---|---|---|---|---|---|---|---|
| 166 Park Hill Ave Yonkers | 0.66mi | 5/3.0 | 2,300 (-6%) | 3mo | $855,000 | $372 | 52 |
| 11 Lafayette Pl | 0.69mi | 6/— (+1) | 2,600 (+6%) | 3mo | $730,000 | $281 | 51 |
| 144 Waverly St | 0.51mi | 6/3.0 (+1) | 2,200 (-11%) | 8mo | $749,000 | $340 | 43 |
| 84 Livingston Ave | 0.70mi | 6/4.0 (+1) | 2,303 (-6%) | 16mo | $740,000 | $321 | 30 |
Match score weights: distance 35% · size 25% · config 20% · recency 20%. Top-matched comps best support the ARV.
Projected returns pro-forma
-3.0% appreciation · 4.39% rent growth · sell at horizon
- IRR
- -27.9%
- Equity multiple
- 0.06×
- Total profit
- $-237,952
- Equity at exit
- $134,193
- IRR
- -22.0%
- Equity multiple
- -0.19×
- Total profit
- $-301,131
- Equity at exit
- $77,816
Cash invested: $252,000 (down + closing). Projections, not guarantees.
Landlord ↔ Tenant lean methodology
- Overall (CITY)
- 5 Strongly Tenant-Friendly
- State New York
- 15 Strongly Tenant-Friendly · D+10
- County
- — inherits STATE
- City Yonkers
- 5 Strongly Tenant-Friendly · D+20
ZIP-level market 10701
- Rents YoY
- 4.4%
- Active inventory
- 185
- Price-to-rent
- 25.5×
Monthly cashflow live
- Estimated rent
- $5,875 high interval (Pro) →
- Mortgage (P&I)
- −$4,720
- Tax est. 1.5%
- −$1,125 /mo · $13,500/yr
- Insurance
- −$375
- HOA
- −$0
- Vacancy / Maint / Mgmt
- −$1,234
- Net cashflow
- $-1,578
Break-even live
Sensitivity live
| Price | -10% $-956 | -5% $-1,267 | +0% $-1,578 | +5% $-1,889 | +10% $-2,200 |
|---|---|---|---|---|---|
| Rent | -10% $-2,043 | -5% $-1,811 | +0% $-1,578 | +5% $-1,346 | +10% $-1,114 |
| Rate | -1.0pp $-1,125 | -0.5pp $-1,350 | base $-1,578 | +0.5pp $-1,812 | +1.0pp $-2,049 |
2-unit breakdown (identical units grouped — click to expand)
| Units | Beds | Baths | Est. rent |
|---|---|---|---|
| 2× units | 2 | — | $5,876 |
| #1 | 2 | — | $2,938 |
| #2 | 2 | — | $2,938 |
| Total (2 units) | $5,875 | ||
UW: 25.0% down · 7.5% · 30yr · 1.5% tax · 5.0% vac · 8.0% maint · 8.0% mgmt
Financing live
Cash to close
- Down payment
- $225,000
- Closing costs
- $27,000
- Reserves months
- —
- Total cash needed
- —
Loan-product check · same deal, 3 products live
Conventional
25% down · 7.5% · 30yr
- Down + closing
- —
- Monthly P&I
- —
- Monthly cashflow
- —
- DSCR
- —
- Eligible?
- —
Personal DTI + credit; lowest rate.
DSCR
20% down · 8.5% · 30yr
- Down + closing
- —
- Monthly P&I
- —
- Monthly cashflow
- —
- DSCR
- —
- Eligible?
- —
No personal income docs; deal must DSCR.
Hard money
10% down · 12.0% · 12mo
- Down + closing
- —
- Monthly P&I
- —
- Monthly cashflow
- —
- DSCR
- —
- Eligible?
- —
Short-term bridge; refi at stabilization.
Rent comps 4 comps
| Address | Beds | Baths | Sqft | Rent | $/sqft | DOM | Units | Dist |
|---|---|---|---|---|---|---|---|---|
| 93 Elliott Ave Apt 2 Yonkers, NY | 4.0 | 1.0 | 3108 | $3,500 | $1.13 | 45d | 1 | 0.73mi |
| 11 Lawrence St Unit 1L Yonkers, NY | 4.0 | 1.0 | 2000 | $3,400 | $1.70 | 20d | 1 | 1.02mi |
| 210 Rumsey Rd Yonkers, NY | 4.0 | 3.0 | 2440 | $6,500 | $2.66 | 0d | 1 | 1.05mi |
| 62 Gibson Pl Yonkers, NY | 4.0 | 4.0 | 2100 | $4,700 | $2.24 | 45d | 1 | 1.48mi |
Listing history 18 events
-
2026-04-10$3,350
-
2026-04-01status Pending
-
2026-03-12$900,000 Active
-
2020-01-07soldstatus $400,000
-
2019-11-08soldstatus $400,000 Sold 350-char remark
Show marketing remark (350 chars)
Very large two family home with views of the Hudson. First floor unit has fireplace (not in use) in living room and bedroom with updated kitchen. Semi finished in-law apt. in basement. Plumbing already installed for washer/dryer. Great investment potential! Below market rents, so huge upside for ROI. Additional Information: Amenities:Storage,
-
2019-09-10status Pending 350-char remark
Show marketing remark (350 chars)
Very large two family home with views of the Hudson. First floor unit has fireplace (not in use) in living room and bedroom with updated kitchen. Semi finished in-law apt. in basement. Plumbing already installed for washer/dryer. Great investment potential! Below market rents, so huge upside for ROI. Additional Information: Amenities:Storage,
-
2019-08-23$420,000 Active 350-char remark
Show marketing remark (350 chars)
Very large two family home with views of the Hudson. First floor unit has fireplace (not in use) in living room and bedroom with updated kitchen. Semi finished in-law apt. in basement. Plumbing already installed for washer/dryer. Great investment potential! Below market rents, so huge upside for ROI. Additional Information: Amenities:Storage,
-
2016-06-24historical Withdrawn
-
2016-06-24historical
-
2016-03-30price
-
2015-08-18Active
-
2015-08-18$415,000
-
2005-12-13soldstatus $538,000
-
1996-08-23soldstatus $140,000
-
1996-08-21price $159,911
-
1996-08-21soldstatus $140,000
-
1995-10-24$140,000
-
1987-07-21soldstatus $120,000
ⓘ Source: listings_history table (triggers on properties + properties_extension) + one-shot
backfill from property_details.listing_events for pre-trigger history.
Climate risk First Street
- Flood 1/10 Low FEMA zone X (unshaded) · 0% chance over 30 yrs
- Wildfire 2/10 Low
- Heat 6/10 Major 7 d/yr ≥99°F today · 15 d/yr by 30 yrs out
- Wind 6/10 Major 27% chance of damaging wind over 30 yrs
- Air quality 3/10 Moderate 3 unhealthy d/yr today · 4 by 30 yrs out
Nearby sold comps map
Loading sold comps map…
Walkable amenities ~0.75 mi
Loading nearby amenities…
Taxation est. · year 1
- Rental income
- $70,500
- − Mortgage interest
- −$50,414
- − Property taxes
- −$13,500
- − Insurance
- −$4,500
- − Repairs & maintenance
- −$5,640
- − Management
- −$5,640
- − Depreciation
- −$26,182
- Taxable loss
- −$35,376
- Est. tax savings @ 24.0%
- +$8,490
- After-tax cash flow
- $-10,451/yr
For passive investors: Depreciation is non-cash, so a rental often shows a tax loss while cash-flowing — sheltering income. Rental losses are passive: they offset passive income freely, and up to $25,000/yr can offset ordinary (W-2) income if you actively participate and your MAGI is under $100k (phasing out to $0 by $150k); unused losses carry forward. On sale, claimed depreciation is recaptured at up to 25%, and gains may owe capital-gains tax (a 1031 exchange can defer both). Figures are a year-1 estimate at your 24.0% rate — not tax advice; consult a CPA.
Schools (NCES district)
- District
- Yonkers City School District
- NCES district ID
- 3631920
- Math proficiency
- 41% ▼ -1.00%
- Reading proficiency
- 54% ▲ 14.00%
- Median HH income
- $58,042
- Composite
- 41.43/100
- National rank
- #3471
- State rank
- #413 of 590 in NY
Livability — Yonkers
- Score
- 68/100
- State rank
- #528
- US rank
- #9394
Category grades
Schools grade is shown separately in the Schools card above.
Census & demographics
- Census place
- Yonkers, NY
- County
- Westchester County · 709,332 people
- City population
- 212,407
- Metro
- New York-Newark-Jersey City, NY-NJ-PA
- Population (ZIP)
- 70,676
- Household income
- $64,776
- Rent vs Own
- Severe rent burden
- 6045.0
Population outlook (Westchester County) Hauer SSP2
- Today (2025)
- 1,028,035 people
- By 2030
- 1,051,636 · +2.3%
- By 2040
- 1,098,520 · +6.9%
- By 2050
- 1,136,044 · +10.5%
- By 2075
- 1,196,925 · +16.4%
- By 2100
- 1,175,147 · +14.3%
Race, ethnicity, and origin ACS 2023
- Neighborhood character
- Diverse neighborhood (Simpson 0.65)
- Race & ethnicity
- Hispanic / Latino 52% White 21% Black 21% Two or more races 18% Asian 3% Native American 1%
- Hispanic origin (detail)
- Mexican 11% Puerto Rican 9% Dominican 19%
- Common ancestry
- Romanian 1% Russian 1% Subsaharan African 1%
- Foreign-born
- 35% · Canada, Jamaica, South Korea
- Languages at home
- 45% English-only · Spanish 42% Other Indo-European 3% Arabic 2%
Political lean MEDSL · Westchester
- 2024 margin
- Strong D (+26.3) · D 63.1% · R 36.9%
- 2008→2024 swing
- -1.3pp toward R · 2008: 27.6pp · 2024: 26.3pp
- All cycles
- 2024: D+26.3 2020: D+36.3 2016: D+32.8 2012: D+22.2 2008: D+27.6
Not yet ingested
- Civics
- —
Market trends
- HPI YoY
- ▼ -373.14%
- Current HPI
- 332.0999
- Rent YoY
- ▲ 4.39%
- Metro
- New York-Newark-Jersey City, NY-NJ-PA
- State GDP YoY
- ▲ 2.60%
- F500 in state
- 92
Industry mix (Fortune 500 HQ in NY)
| Industry | F500 HQs | Revenue |
|---|---|---|
| Financial Services | 10 | $950B |
|
||
| Consumer Goods | 9 | $162B |
|
||
| Insurance | 4 | $225B |
|
||
| Telecommunications | 2 | $144B |
|
||
| Pharmaceuticals | 2 | $112B |
|
||
| Media / Entertainment | 2 | $69B |
|
||
Price history
-97.2% since first listed18 events — show timeline
- 2026-04-10 Listed for Rent $3,350 SHOWMOJO
- 2026-04-01 Pending — OneKey® MLS as Distributed by MLS Grid
- 2026-03-12 Listed $900,000 OneKey® MLS as Distributed by MLS Grid
- 2020-01-07 Sold (Public Records) $400,000 Public Records
- 2019-11-08 Sold (MLS) $400,000 OneKey® MLS as Distributed by MLS Grid
- 2019-09-10 Pending — OneKey® MLS as Distributed by MLS Grid
- 2019-08-23 Listed $420,000 OneKey® MLS as Distributed by MLS Grid
- 2016-06-24 Delisted — HGMLS
- 2016-06-24 Listing Removed — OneKey® MLS as Distributed by MLS Grid
- 2016-03-30 Price Changed — HGMLS
- 2015-08-18 Listed — HGMLS
- 2015-08-18 Listed $415,000 OneKey® MLS as Distributed by MLS Grid
- 2005-12-13 Sold (Public Records) $538,000 Public Records
- 1996-08-23 Sold (Public Records) $140,000 Public Records
- 1996-08-21 Sold (MLS) $140,000 HGMLS
- 1996-08-21 Price Changed $159,911 HGMLS
- 1995-10-24 Listed $140,000 HGMLS
- 1987-07-21 Sold (Public Records) $120,000 Public Records
Property tax history
-24.9%/yrLatest (2025): $1,710 · +0.6% YoY. Source: county tax records.
Cash-flow waterfall
monthlySold comps — $/sqft
last 12 mo · ≤1 miLoading sold comps…