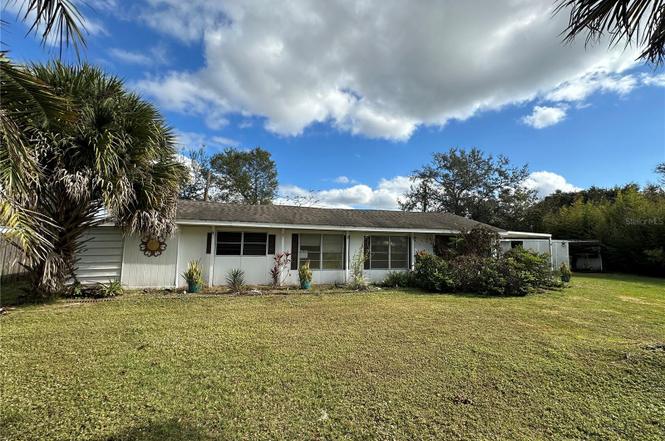
1985 Aladdin Ct · St. Cloud, FL
Flood risk 1/10 · Minimal
- FEMA flood zone
- X (unshaded)
- Chance of flooding over 30 yrs
- 0.0%
- Est. flood insurance / yr
- $507 – $1,088
Fire risk 5/10 · Moderate
- Est. fire insurance / yr
- $947 – $1,759
Heat risk 9/10 · Severe
- Hot days now (above 108°F)
- 7 days/yr
- Hot days in 30 yrs
- 23 days/yr
Wind risk 9/10 · Severe
- Chance of severe wind over 30 yrs
- 99.0%
Air-quality risk 2/10 · Minimal
- Unhealthy air days now
- 1 days/yr
- Unhealthy air days in 30 yrs
- 1 days/yr
Risk factors via First Street. Map © Google.
Why this score? — see what drove the C+ grade
The composite is a weighted blend of 9 inputs, each scored 0–100. Each bar is that input's sub-score; the figure is the points it added to the 100-point composite (weight × sub-score).
- Cash flow +28.0/30.0
- DSCR +9.9/10.0
- ARV discount +7.5/15.0
- 1% rule +7.3/10.0
- Schools +3.6/10.0
- Rent growth +3.3/5.0
- Livability +2.5/5.0
- Condition / age +2.5/5.0
- Appreciation +0.0/10.0
$145,000
🖨 Deal sheet 📄 Offer letter ✓ Due diligence
Listing remarks
NO HOA • NO LOT FEES • Endless Potential in Sunny Florida! Discover an affordable slice of Florida paradise in desirable St. Cloud! This charming manufactured home offers exceptional value with no HOA restrictions and no lot fees, giving you the freedom to enjoy your property your way. Inside, you'll find a comfortable one-bedroom layout plus a versatile bonus room that can easily function as a second bedroom, home office, or hobby space. Relax year-round in the enclosed porch or enjoy the additional Florida room, providing plenty of extra living space for entertaining guests or soaking in the sunshine. Step outside to find a spacious storage shed perfect for tools, outdoor gear,
Key facts
- 0.3 acre lot
- Parking
- Built 1966
Property features AI
Finance
- Other: Lot about 0.3 acre (dimensions ~108 x 121); Public records list living area and building area; Property zoned ORMH; Contains one well and one septic
- Financial info: No lease restrictions
- HOA & community: No association
Exterior
- Parking: Carport (1 space)
- Utilities: Well water; Septic tank; Broadband/High-speed internet available; Cable available; Electricity available; Phone service available; Water available
- Home design: Single-wide mobile home; One story; Faces west; Fixer condition
- Construction: Metal frame with metal siding; Metal roof; Crawlspace foundation; Built as a mobile home (single wide)
- Exterior features: Private mailbox; Asphalt road access
Interior
- Kitchen: Cooktop; Microwave; Refrigerator
- Bedrooms: 1 bedroom
- Flooring: Carpet; Linoleum
- Bathrooms: 1 full bathroom
- Heating & cooling: Central heating; Central air conditioning
- Interior features: No interior features listed
- Laundry & utility: Outdoor laundry area
Neighborhood map
What this means for you Summary
Snapshot
- This is a 1-bed/1.0-bath manufactured listed at $145k.
Deal economics
- At list price, monthly cash flow is $452 ($5k/yr) — positive.
- The deal already cash-flows at list — no discount required.
- Meets the 1% rule at list price ($2k rent vs $145k).
- Recommended offer: $128k (12.0% below list) — sets the bar for market timing.
- Cap rate 10.0% vs local median 4.0% in St. Cloud — top-decile yield for the area; either an underpriced asset or a hidden risk that comps aren't pricing in. Stress-test before assuming the spread holds.
Location & tenants
- Location reads: area grade C — affects rentability + tenant quality, not the cash-flow math above.
- Osceola (suburban): math 39% / reading 45% proficiency, ranked #60 of 73 in FL (top 82%) — families likely to look elsewhere, expect single-tenant / working-renter base with shorter leases; 60% free/reduced lunch — lower-income household profile, screen leases tightly.
- Zoned schools: Hickory Tree Elementary School (math 64% / reading 59%, grade B, #634 of 2,144 statewide, top 30%, 795 students, 48% FRL); Harmony High School (math 40% / reading 46%, grade F, #255 of 667 statewide, top 39%, 2,822 students, 42% FRL) — zoned schools average 45% FRL vs 60% district-wide (15 pts lower); this property's tenant base skews higher-income than the district average.
- Market conditions: Rents rising (+3.0%/yr); 1378 active listings in the ZIP; 2 comparable units currently listed for rent nearby; solid renter incomes; 8,813 units permitted in Osceola County in 2024 (3,072 in 5+ unit buildings).
Forward outlook
- Local home prices are declining (-3.0%/yr); year-one equity from $1k of loan paydown is wiped out by about $4k of value loss. Plan a longer hold.
- Osceola County population projected at +73% by 2050 — long-run rental-demand tailwind backs the buy-and-hold thesis.
- At projected returns (-3.0% appreciation + 3.0% rent growth), your $41k cash investment doubles in ~9 years — after that, you're playing with house money.
Negotiation context
- It's been on market 230 days — a 12% lower offer ($128k) is reasonable based on typical stale-listing flexibility.
- Current owner paid $12k; list at $145k implies a 1060% gain — meaningful room to come down on a strong offer.
Risks & watch-outs
- Climate carrying-cost: severe wind risk, 99% chance of damaging wind over 30y; moderate wildfire risk; extreme-heat days projected 7→23/yr by 2055 (HVAC capex compounding) — expect insurance premiums to compound above CPI over the hold.
Questions for the listing agent
- It's been on market 230 days. Have you received any prior offers? Is the seller open to a 12% concession, seller financing, or rate buy-down credit?
- Built in 1966 — when were the roof, HVAC, electrical panel, plumbing, and water heater last replaced?
- Why hasn't it sold? Are there any deal-killer items the seller is aware of (foundation, flood, title, zoning, code violations)?
- Is there a deadline driving the sale (1031 exchange, divorce, estate, relocation)? That informs how much negotiation room exists.
- What's the average days-on-market for RENTAL listings here right now (not sales)? A rising rental-DOM trend means longer vacancies and softer asking-rent achievability than the comps imply.
- What's the recent tenant-quality profile in this submarket — average credit score on applications, eviction rate, late-payment / NSF rate, and stable-employment percentage? A property-management company in the area should have these aggregated.
- How much new for-sale + rental construction is in the pipeline within 1–3 miles? Heavy new supply typically softens prices + rents 12–24 months out; constrained supply supports both.
Investment metrics
- 1% rule
- 1.23% ✓
- Cap rate
- 10.03%
- Cash-on-cash
- 13.35%
- DSCR
- 1.59
- GRM
- 6.8
CMA / ARV
No comps found within radius.
Projected returns pro-forma
-3.0% appreciation · 3.02% rent growth · sell at horizon
- IRR
- 3.4%
- Equity multiple
- 1.13×
- Total profit
- $5,318
- Equity at exit
- $21,620
- IRR
- 12.9%
- Equity multiple
- 2.03×
- Total profit
- $41,841
- Equity at exit
- $12,537
Cash invested: $40,600 (down + closing). Projections, not guarantees.
Landlord ↔ Tenant lean methodology
- Overall (STATE)
- 87 Strongly Landlord-Friendly
- State Florida
- 87 Strongly Landlord-Friendly · R+3
- County
- — inherits STATE
- City
- — inherits STATE
ZIP-level market 34771
- Home prices YoY
- -30.0%
- Rents YoY
- 3.0%
- Active inventory
- 1378
- Price-to-rent
- 6.8×
Monthly cashflow live
- Estimated rent
- $1,789 medium interval (Pro) →
- Mortgage (P&I)
- −$760
- Tax from tax record
- −$141 /mo · $1,691/yr
- Insurance
- −$60
- HOA
- −$0
- Vacancy / Maint / Mgmt
- −$376
- Net cashflow
- $452
Break-even live
UW: 25.0% down · 7.5% · 30yr · 1.5% tax · 5.0% vac · 8.0% maint · 8.0% mgmt
Financing live
Cash to close
- Down payment
- $36,250
- Closing costs
- $4,350
- Reserves months
- —
- Total cash needed
- —
Loan-product check · same deal, 3 products live
Conventional
25% down · 7.5% · 30yr
- Down + closing
- —
- Monthly P&I
- —
- Monthly cashflow
- —
- DSCR
- —
- Eligible?
- —
Personal DTI + credit; lowest rate.
DSCR
20% down · 8.5% · 30yr
- Down + closing
- —
- Monthly P&I
- —
- Monthly cashflow
- —
- DSCR
- —
- Eligible?
- —
No personal income docs; deal must DSCR.
Hard money
10% down · 12.0% · 12mo
- Down + closing
- —
- Monthly P&I
- —
- Monthly cashflow
- —
- DSCR
- —
- Eligible?
- —
Short-term bridge; refi at stabilization.
Rent comps 2 comps
| Address | Beds | Baths | Sqft | Rent | $/sqft | DOM | Units | Dist |
|---|---|---|---|---|---|---|---|---|
| 5476 Angel Way Saint Cloud, FL | 1.0–3.0 | 1.0–2.0 | 984 | $1,642 | $1.67 | 2d | 34 | 0.41mi |
| 5930 Alligator Lake Shr W Unit A2 St Cloud, FL | 1.0 | 1.0 | 700 | $1,300 | $1.86 | 17d | 1 | 0.99mi |
Listing history 20 events
-
2026-06-18days on market $145,000 Active 230 DOM
-
2026-06-17days on market $145,000 Active 229 DOM
-
2026-06-16days on market $145,000 Active 228 DOM
-
2026-06-15price $145,000 Active 227 DOM
-
2026-06-15days on market $150,000 Active 227 DOM
-
2026-06-13days on market $150,000 Active 225 DOM
-
2026-06-13days on market $150,000 Active 224 DOM
-
2026-06-10remarks 689-char remark
-
2026-06-10days on market $150,000 Active 221 DOM
-
2026-06-08days on market $150,000 Active 220 DOM
-
2026-06-07days on market $150,000 Active 219 DOM
-
2026-06-04days on market $150,000 Active 216 DOM
-
2026-06-03days on market $150,000 Active 215 DOM
-
2026-06-02days on market $150,000 Active 214 DOM
-
2026-06-02days on market $150,000 Active 213 DOM
-
2026-05-31days on market $150,000 Active 212 DOM
-
2026-04-07price $150,000
-
2026-01-27price $160,000
-
2025-10-31$165,000 Active
-
1979-08-01soldstatus $12,500
ⓘ Source: listings_history table (triggers on properties + properties_extension) + one-shot
backfill from property_details.listing_events for pre-trigger history.
Tax reassessment forecast FL · Resets to sale price
- Current annual tax
- $1,691 · $141/mo
- Projected year-2 tax
- $1,691 · $141/mo
- Expected delta
- $0/yr ($0/mo · 0.0%)
ⓘ Screening estimate from a state-policy table — verify with the county assessor before closing.
Climate risk First Street
- Flood 1/10 Low FEMA zone X (unshaded) · 0% chance over 30 yrs
- Wildfire 5/10 Major
- Heat 9/10 Extreme 7 d/yr ≥108°F today · 23 d/yr by 30 yrs out
- Wind 9/10 Extreme 99% chance of damaging wind over 30 yrs
- Air quality 2/10 Low 1 unhealthy d/yr today · 1 by 30 yrs out
Nearby sold comps map
Loading sold comps map…
Walkable amenities ~0.75 mi
Loading nearby amenities…
Taxation est. · year 1
- Rental income
- $21,471
- − Mortgage interest
- −$8,122
- − Property taxes
- −$1,691
- − Insurance
- −$725
- − Repairs & maintenance
- −$1,718
- − Management
- −$1,718
- − Depreciation
- −$4,218
- Taxable income
- $3,280
- Est. tax owed @ 24.0%
- −$787
- After-tax cash flow
- $4,635/yr
For passive investors: Depreciation is non-cash, so a rental often shows a tax loss while cash-flowing — sheltering income. Rental losses are passive: they offset passive income freely, and up to $25,000/yr can offset ordinary (W-2) income if you actively participate and your MAGI is under $100k (phasing out to $0 by $150k); unused losses carry forward. On sale, claimed depreciation is recaptured at up to 25%, and gains may owe capital-gains tax (a 1031 exchange can defer both). Figures are a year-1 estimate at your 24.0% rate — not tax advice; consult a CPA.
Schools (NCES district)
- District
- Osceola
- NCES district ID
- 1201470
- Math proficiency
- 39% ▼ -9.00%
- Reading proficiency
- 45% ▼ -4.00%
- Median HH income
- $45,528
- Composite
- 35.7/100
- National rank
- #4865
- State rank
- #60 of 73 in FL
Livability — St. Cloud
No livability data for this city. (Only ~50 U.S. cities are tracked.)
Census & demographics
- County
- Osceola County · 410,217 people
- City population
- 29,247
- Metro
- Orlando-Kissimmee-Sanford, FL
- Population (ZIP)
- 35,257
- Household income
- $97,415
- Rent vs Own
- Severe rent burden
- 338.0
Population outlook (Osceola County) Hauer SSP2
- Today (2025)
- 447,624 people
- By 2030
- 511,823 · +14.3%
- By 2040
- 642,986 · +43.6%
- By 2050
- 774,552 · +73.0%
- By 2075
- 1,078,144 · +140.9%
- By 2100
- 1,269,660 · +183.6%
Race, ethnicity, and origin ACS 2023
- Neighborhood character
- Diverse neighborhood (Simpson 0.62)
- Race & ethnicity
- White 45% Hispanic / Latino 41% Two or more races 20% Black 9% Asian 2%
- Hispanic origin (detail)
- Mexican 3% Puerto Rican 26% Cuban 2% Dominican 4%
- Common ancestry
- Slovak 2% Romanian 2% Lithuanian 1%
- Foreign-born
- 14% · Canada, Jamaica
- Languages at home
- 64% English-only · Spanish 33% Other Indo-European 3%
Political lean MEDSL · Osceola
- 2024 margin
- Toss-up / Even · D 48.7% · R 50.2% · Other 1.1%
- 2008→2024 swing
- -21.2pp toward R · 2008: 19.7pp · 2024: -1.4pp
- All cycles
- 2024: R+1.4 2020: D+13.8 2016: D+25.0 2012: D+24.5 2008: D+19.7
Not yet ingested
- Civics
- —
Market trends
- HPI YoY
- ▼ -124.44%
- Current HPI
- 290.3095
- Rent YoY
- ▲ 3.02%
- Metro
- Orlando-Kissimmee-Sanford, FL
- State GDP YoY
- ▲ 3.28%
- F500 in state
- 36
Industry mix (Fortune 500 HQ in FL)
| Industry | F500 HQs | Revenue |
|---|---|---|
| Industrial Technology | 2 | $29B |
|
||
| Insurance | 2 | $17B |
|
||
| Retail | 1 | $60B |
|
||
| Technology Distribution | 1 | $58B |
|
||
| Homebuilding | 1 | $35B |
|
||
| Technology Manufacturing | 1 | $35B |
|
||
Price history
+1100.0% since first listed4 events — show timeline
- 2026-04-07 Price Changed $150,000 Stellar MLS as Distributed by MLS Grid
- 2026-01-27 Price Changed $160,000 Stellar MLS as Distributed by MLS Grid
- 2025-10-31 Listed $165,000 Stellar MLS as Distributed by MLS Grid
- 1979-08-01 Sold (Public Records) $12,500 Public Records
Property tax history
+6.4%/yrLatest (2025): $1,691 · +8.6% YoY. Source: county tax records.
Cash-flow waterfall
monthlySold comps — $/sqft
last 12 mo · ≤1 miLoading sold comps…