7405 Beahl Blvd · Louisville/Jefferson County metro government (balance), KY
Flood risk 6/10 · Moderate
- FEMA flood zone
- X (shaded)
- Chance of flooding over 30 yrs
- 0.73%
- Est. flood insurance / yr
- $507 – $1,088
Fire risk 1/10 · Minimal
- Est. fire insurance / yr
- $839 – $1,559
Heat risk 5/10 · Moderate
- Hot days now (above 104°F)
- 7 days/yr
- Hot days in 30 yrs
- 20 days/yr
Wind risk 2/10 · Minimal
- Chance of severe wind over 30 yrs
- 2.0%
Air-quality risk 3/10 · Minor
- Unhealthy air days now
- 2 days/yr
- Unhealthy air days in 30 yrs
- 3 days/yr
Risk factors via First Street. Map © Google.
Why this score? — see what drove the B- grade
The composite is a weighted blend of 9 inputs, each scored 0–100. Each bar is that input's sub-score; the figure is the points it added to the 100-point composite (weight × sub-score).
- Cash flow +26.7/30.0
- ARV discount +15.0/15.0
- DSCR +9.2/10.0
- 1% rule +6.6/10.0
- Rent growth +2.6/5.0
- Livability +2.5/5.0
- Condition / age +2.5/5.0
- Schools +2.3/10.0
- Appreciation +0.0/10.0
$165,500
🖨 Deal sheet (PDF) 📄 Offer letter ✓ Due diligence
Listing remarks
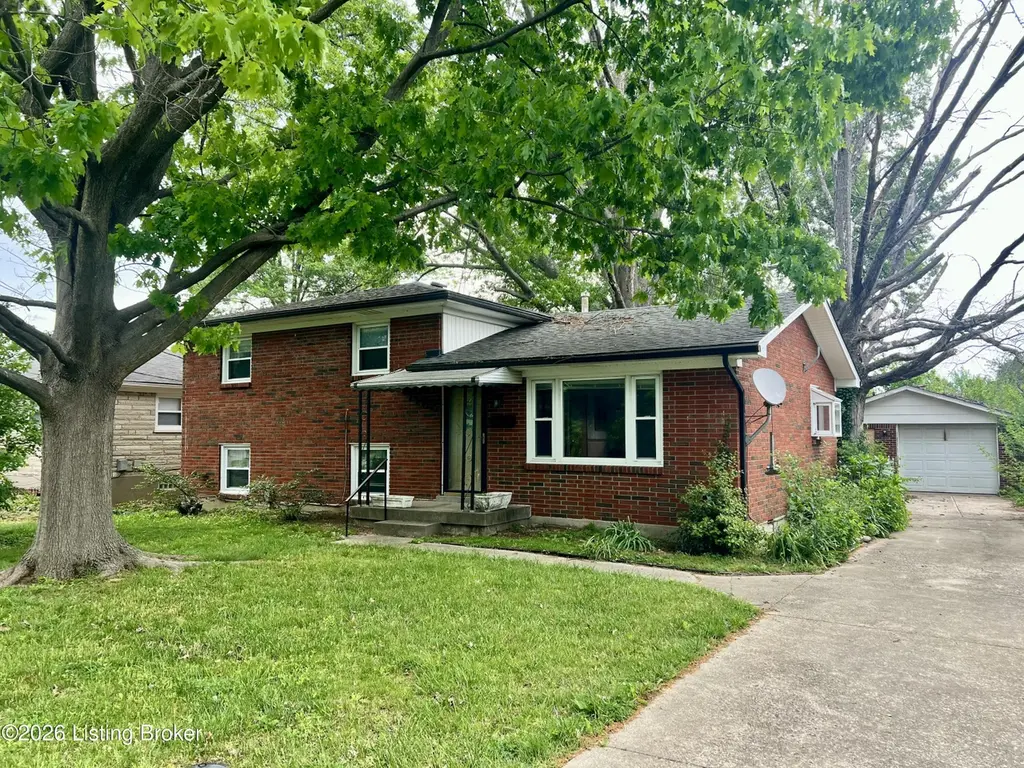
Great investment opportunity! This handyman special offers significant value-add potential for the right buyer. The property has been vacant for several years and will require repairs and updates, making it ideal for investors, rehabbers, or buyers looking to customize a home to their liking. Sold as-is. Please note: property will not qualify for FHA financing. Bring your vision and unlock the possibilities!
Key facts
- 8,939 sq ft lot
- 2 garage spots
- Built 1964
Property features AI
Finance
- Other: Located in the Greenwood Terrace subdivision
- HOA & community: No association fee
Exterior
- Parking: Detached garage with 2 garage spaces; Driveway parking; Front and rear entries
- Utilities: Natural gas fuel; Standard utility connections
- Home design: Single family ranch-style home; One story; Built in 1964
- Construction: Wood frame construction; Shingle roof; Poured concrete foundation
- Exterior features: Chain link fencing; Sidewalk along the lot
Interior
- Kitchen: Kitchen located on the first floor
- Bedrooms: Four bedrooms total; Primary bedroom on the first floor; Three bedrooms on the second floor
- Bathrooms: One full bathroom on the second floor; One half bathroom in the basement
- Heating & cooling: Natural gas heating; Central air conditioning; One cooling/HVAC unit
- Interior features: Eight total rooms; Five closets; Partially finished basement with outside entry and partial walkout
- Laundry & utility: Laundry room in the basement; One HVAC unit
Neighborhood map
What this means for you Summary
Snapshot
- This is a 4-bed/1.5-bath single-family listed at $166k.
Deal economics
- At list price, monthly cash flow is $449 ($5k/yr) — positive.
- The deal already cash-flows at list — no discount required.
- Meets the 1% rule at list price ($2k rent vs $166k).
- Cap rate 9.5% vs local median 4.0% in Louisville/Jefferson County metro government (balance) — top-decile yield for the area; either an underpriced asset or a hidden risk that comps aren't pricing in. Stress-test before assuming the spread holds.
Location & tenants
- Location reads: area grade B — affects rentability + tenant quality, not the cash-flow math above.
- Jefferson County (urban): math 19% / reading 35% proficiency, ranked #121 of 165 in KY (top 73%) — low school quality limits family demand, transient renter base, plan for 1-2y turnover.
- Zoned schools: Greenwood Elementary (math 8% / reading 17%, grade F, #630 of 676 statewide, top 95%, 457 students, 72% FRL); Conway Middle (math 4% / reading 20%, grade F, #215 of 217 statewide, top 99%, 730 students, 72% FRL); Pleasure Ridge Park High (math 16% / reading 20%, grade F, #220 of 254 statewide, top 87%, 1,517 students, 63% FRL).
- Zoned-school proficiency averages 14% at this address vs 27% district-wide (-13 pts) — the specific schools serving this property underperform the Jefferson County average; the district grade overstates school quality for this exact location.
- Market conditions: Rents flat; 126 active listings in the ZIP; 11 comparable units currently listed for rent nearby; rentals at typical pace (median 18d on market — plan ~3-4 weeks tenant-placement turnaround); 2,836 units permitted in Jefferson County in 2024 (1,558 in 5+ unit buildings).
- This rent runs 34% of the median local income ($68k/yr) — at the standard rent-burdened threshold; future hikes will face affordability resistance.
Forward outlook
- Local home prices are declining (-3.0%/yr); year-one equity from $1k of loan paydown is wiped out by about $5k of value loss. Plan a longer hold.
- Jefferson County population projected at +13% by 2050 — modest demand growth; plan on rents tracking national, not racing it.
Negotiation context
- Only 2 days on market — expect competitive offers; lowballing is unlikely to land.
- 2 sale attempts since 3y ago with the ask held roughly flat each time — persistent listings suggest the price (not the market) is what's stuck; bring a comps-based counter.
Risks & watch-outs
- Climate carrying-cost: major flood risk; extreme-heat days projected 7→20/yr by 2055 (HVAC capex compounding) — expect insurance premiums to compound above CPI over the hold.
Questions for the listing agent
- Built in 1964 — when were the roof, HVAC, electrical panel, plumbing, and water heater last replaced?
- Is there a deadline driving the sale (1031 exchange, divorce, estate, relocation)? That informs how much negotiation room exists.
- What's the average days-on-market for RENTAL listings here right now (not sales)? A rising rental-DOM trend means longer vacancies and softer asking-rent achievability than the comps imply.
- What's the recent tenant-quality profile in this submarket — average credit score on applications, eviction rate, late-payment / NSF rate, and stable-employment percentage? A property-management company in the area should have these aggregated.
- How much new for-sale + rental construction is in the pipeline within 1–3 miles? Heavy new supply typically softens prices + rents 12–24 months out; constrained supply supports both.
Investment metrics
- 1% rule
- 1.16% ✓
- Cap rate
- 9.55%
- Cash-on-cash
- 11.62%
- DSCR
- 1.52
- GRM
- 7.2
CMA / ARV
- ARV (on-the-fly)
- $249,575
- Comps found
- 12
Show comp detail 12 sales within ~0.75 mi
| Address | Dist | Beds/Ba | Sqft | Sold | Price | $/sf | Match |
|---|---|---|---|---|---|---|---|
| 6503 Connie Dr | 0.41mi | 3/2.0 (-1) | 1,700 (+2%) | 3mo | $202,000 | $119 | 69 |
| 7419 Beahl Blvd | 0.09mi | 3/1.0 (-1) | 1,788 (+7%) | 11mo | $227,000 | $127 | 69 |
| 7001 Memory Ln | 0.32mi | 3/2.5 (-1) | 1,721 (+3%) | 8mo | $306,500 | $178 | 65 |
| 6510 Tearose Dr | 0.41mi | 3/1.5 (-1) | 1,625 (-3%) | 8mo | $235,000 | $145 | 64 |
| 7005 Feyhurst Dr | 0.56mi | 3/2.5 (-1) | 1,683 (+0%) | 6mo | $290,000 | $172 | 60 |
| 5904 Greenwood Rd | 0.32mi | 3/2.0 (-1) | 1,500 (-10%) | 4mo | $220,000 | $147 | 57 |
| 6905 Feyhurst Dr | 0.50mi | 3/2.0 (-1) | 1,603 (-4%) | 11mo | $335,000 | $209 | 53 |
| 7502 Norwich Blvd | 0.48mi | 3/1.5 (-1) | 1,500 (-10%) | 3mo | $218,000 | $145 | 53 |
| 5901 Soverign Ct | 0.50mi | 3/2.0 (-1) | 1,425 (-15%) | 2mo | $299,900 | $210 | 43 |
| 8009 Columbine Dr | 0.74mi | 3/1.0 (-1) | 1,600 (-4%) | 10mo | $247,000 | $154 | 42 |
| 7109 Uranus Dr | 0.68mi | 3/2.0 (-1) | 1,475 (-12%) | 7mo | $220,000 | $149 | 36 |
| 7307 Feyhurst Dr | 0.57mi | 3/2.0 (-1) | 1,900 (+13%) | 10mo | $245,000 | $129 | 35 |
Match score weights: distance 35% · size 25% · config 20% · recency 20%. Top-matched comps best support the ARV.
Projected returns pro-forma
-3.0% appreciation · 0.5% rent growth · sell at horizon
- IRR
- -1.8%
- Equity multiple
- 0.94×
- Total profit
- $-2,987
- Equity at exit
- $24,677
- IRR
- 5.2%
- Equity multiple
- 1.34×
- Total profit
- $15,691
- Equity at exit
- $14,309
Cash invested: $46,340 (down + closing). Projections, not guarantees.
Landlord ↔ Tenant lean methodology
- Overall (STATE)
- 83 Strongly Landlord-Friendly
- State Kentucky
- 83 Strongly Landlord-Friendly · R+16
- County
- — inherits STATE
- City
- — inherits STATE
ZIP-level market 40258
- Rents YoY
- 0.5%
- Active inventory
- 126
- Price-to-rent
- 7.2×
Monthly cashflow live
- Estimated rent
- $1,925 high interval (Pro) →
- Mortgage (P&I)
- −$868
- Tax from tax record
- −$135 /mo · $1,621/yr
- Insurance
- −$69
- HOA
- −$0
- Vacancy / Maint / Mgmt
- −$404
- Net cashflow
- $449
Break-even live
Sensitivity live
| Price | -10% $542 | -5% $495 | +0% $449 | +5% $402 | +10% $355 |
|---|---|---|---|---|---|
| Rent | -10% $297 | -5% $373 | +0% $449 | +5% $525 | +10% $601 |
| Rate | -1.0pp $532 | -0.5pp $491 | base $449 | +0.5pp $406 | +1.0pp $362 |
UW: 25.0% down · 7.5% · 30yr · 1.5% tax · 5.0% vac · 8.0% maint · 8.0% mgmt
Financing live
Cash to close
- Down payment
- $41,375
- Closing costs
- $4,965
- Reserves months
- —
- Total cash needed
- —
Loan-product check · same deal, 3 products live
Conventional
25% down · 7.5% · 30yr
- Down + closing
- —
- Monthly P&I
- —
- Monthly cashflow
- —
- DSCR
- —
- Eligible?
- —
Personal DTI + credit; lowest rate.
DSCR
20% down · 8.5% · 30yr
- Down + closing
- —
- Monthly P&I
- —
- Monthly cashflow
- —
- DSCR
- —
- Eligible?
- —
No personal income docs; deal must DSCR.
Hard money
10% down · 12.0% · 12mo
- Down + closing
- —
- Monthly P&I
- —
- Monthly cashflow
- —
- DSCR
- —
- Eligible?
- —
Short-term bridge; refi at stabilization.
Rent comps 11 comps
| Address | Beds | Baths | Sqft | Rent | $/sqft | DOM | Units | Dist |
|---|---|---|---|---|---|---|---|---|
| 6100 Goalby Dr Louisville, KY | 3.0 | 2.5 | 1582 | $1,850 | $1.17 | 18d | 1 | 0.48mi |
| 6004 Noah Dr Louisville, KY | 3.0 | 1.0 | 1130 | $1,650 | $1.46 | 19d | 1 | 0.89mi |
| 7820 Hepatica Dr Louisville, KY | 3.0 | 2.5 | 1763 | $2,070 | $1.17 | 16d | 1 | 0.90mi |
| 7812 Westbrook Rd Louisville, KY | 3.0 | 2.0 | 1370 | $1,965 | $1.43 | 21d | 1 | 0.94mi |
| 6407 Hunters Creek Blvd Louisville, KY | 3.0 | 2.0 | 1534 | $1,915 | $1.25 | 25d | 1 | 1.11mi |
| 7703 Texlyn Ct Louisville, KY | 3.0 | 2.0 | 1210 | $1,675 | $1.38 | 12d | 1 | 1.12mi |
| 7710 Texlyn Ct Louisville, KY | 3.0 | 2.0 | 1325 | $1,695 | $1.28 | 23d | 1 | 1.14mi |
| 6917 Colrain Cir Louisville, KY | 3.0 | 2.0 | 1214 | $1,699 | $1.40 | 18d | 1 | 1.27mi |
| 6311 Hackel Dr Louisville, KY | 3.0 | 1.5 | 1248 | $1,735 | $1.39 | 3d | 1 | 1.28mi |
| 7809 Axtell Ave Louisville, KY | 3.0 | 1.0 | 1118 | $1,585 | $1.42 | 18d | 1 | 1.32mi |
| 4904 Paramount Dr Louisville, KY | 3.0 | 2.5 | 2205 | $2,145 | $0.97 | 25d | 1 | 1.38mi |
Listing history 4 events
-
2026-05-01status Pending
-
2026-04-30$165,500 Active
-
2023-06-13historical
-
2023-05-30$210,000 Active
ⓘ Source: listings_history table (triggers on properties + properties_extension) + one-shot
backfill from property_details.listing_events for pre-trigger history.
Tax reassessment forecast KY · Resets to sale price
- Current annual tax
- $1,621 · $135/mo
- Projected year-2 tax
- $1,621 · $135/mo
- Expected delta
- $0/yr ($0/mo · 0.0%)
ⓘ Screening estimate from a state-policy table — verify with the county assessor before closing.
Climate risk First Street
- Flood 6/10 Major FEMA zone X (shaded) · 73% chance over 30 yrs
- Wildfire 1/10 Low
- Heat 5/10 Major 7 d/yr ≥104°F today · 20 d/yr by 30 yrs out
- Wind 2/10 Low 2% chance of damaging wind over 30 yrs
- Air quality 3/10 Moderate 2 unhealthy d/yr today · 3 by 30 yrs out
Nearby sold comps map
Loading sold comps map…
Walkable amenities ~0.75 mi
Loading nearby amenities…
Taxation est. · year 1
- Rental income
- $23,096
- − Mortgage interest
- −$9,271
- − Property taxes
- −$1,621
- − Insurance
- −$828
- − Repairs & maintenance
- −$1,848
- − Management
- −$1,848
- − Depreciation
- −$4,815
- Taxable income
- $2,867
- Est. tax owed @ 24.0%
- −$688
- After-tax cash flow
- $4,695/yr
For passive investors: Depreciation is non-cash, so a rental often shows a tax loss while cash-flowing — sheltering income. Rental losses are passive: they offset passive income freely, and up to $25,000/yr can offset ordinary (W-2) income if you actively participate and your MAGI is under $100k (phasing out to $0 by $150k); unused losses carry forward. On sale, claimed depreciation is recaptured at up to 25%, and gains may owe capital-gains tax (a 1031 exchange can defer both). Figures are a year-1 estimate at your 24.0% rate — not tax advice; consult a CPA.
Schools (NCES district)
- District
- Jefferson County
- NCES district ID
- 2102990
- Math proficiency
- 19% ▼ -17.00%
- Reading proficiency
- 35% ▼ -11.00%
- Median HH income
- $47,885
- Composite
- 23.45/100
- National rank
- #7884
- State rank
- #121 of 165 in KY
Livability — Louisville/Jefferson County metro government (balance)
No livability data for this city. (Only ~50 U.S. cities are tracked.)
Census & demographics
- Census place
- Louisville/Jefferson County metro government (balance), KY
- County
- Jefferson County · 790,184 people
- City population
- 419,741
- Metro
- Louisville/Jefferson County, KY-IN
- Population (ZIP)
- 26,841
- Household income
- $68,162
- Rent vs Own
- Severe rent burden
- 839.0
Population outlook (Jefferson County) Hauer SSP2
- Today (2025)
- 823,112 people
- By 2030
- 849,343 · +3.2%
- By 2040
- 895,696 · +8.8%
- By 2050
- 933,630 · +13.4%
- By 2075
- 1,028,262 · +24.9%
- By 2100
- 1,072,675 · +30.3%
Race, ethnicity, and origin ACS 2023
- Neighborhood character
- Predominantly White (67%)
- Race & ethnicity
- White 67% Black 22% Two or more races 8% Hispanic / Latino 5%
- Hispanic origin (detail)
- Mexican 3% Cuban 1%
- Common ancestry
- Iranian 2% Italian 2% Slovak 2%
- Foreign-born
- 5% · Canada
- Languages at home
- 94% English-only · Spanish 4%
Political lean MEDSL · Jefferson
- 2024 margin
- D (+16.6) · D 57.4% · R 40.9% · Other 1.7%
- 2008→2024 swing
- +4.5pp toward D · 2008: 12.0pp · 2024: 16.6pp
- All cycles
- 2024: D+16.6 2020: D+20.1 2016: D+13.3 2012: D+11.1 2008: D+12.0
Not yet ingested
- Civics
- —
Market trends
- HPI YoY
- ▼ -296.36%
- Current HPI
- 244.6667
- Rent YoY
- ▲ 0.50%
- Metro
- Louisville/Jefferson County, KY-IN
- State GDP YoY
- ▲ 1.81%
- F500 in state
- 4
Industry mix (Fortune 500 HQ in KY)
| Industry | F500 HQs | Revenue |
|---|---|---|
| Healthcare | 1 | $118B |
|
||
| Food / Beverage | 1 | $7B |
|
||
Price history
-21.2% since first listed4 events — show timeline
- 2026-05-01 Pending — Metro Search MLS
- 2026-04-30 Listed $165,500 Metro Search MLS
- 2023-06-13 Listing Removed — Metro Search MLS
- 2023-05-30 Listed $210,000 Metro Search MLS
Property tax history
+7.6%/yrLatest (2025): $1,621 · -2.1% YoY. Source: county tax records.
Cash-flow waterfall
monthlySold comps — $/sqft
last 12 mo · ≤1 miLoading sold comps…