214 Forest Hill Rd · Hodgenville, KY
Flood risk 1/10 · Minimal
- FEMA flood zone
- X (unshaded)
- Chance of flooding over 30 yrs
- 0.0%
- Est. flood insurance / yr
- $473 – $860
Fire risk 4/10 · Minor
- Est. fire insurance / yr
- $839 – $1,559
Heat risk 4/10 · Minor
- Hot days now (above 104°F)
- 7 days/yr
- Hot days in 30 yrs
- 20 days/yr
Wind risk 2/10 · Minimal
- Chance of severe wind over 30 yrs
- 3.0%
Air-quality risk 2/10 · Minimal
- Unhealthy air days now
- 0 days/yr
- Unhealthy air days in 30 yrs
- 1 days/yr
Risk factors via First Street. Map © Google.
Why this score? — see what drove the D grade
The composite is a weighted blend of 9 inputs, each scored 0–100. Each bar is that input's sub-score; the figure is the points it added to the 100-point composite (weight × sub-score).
- Cash flow +15.0/30.0
- ARV discount +7.5/15.0
- 1% rule +5.0/10.0
- DSCR +5.0/10.0
- Livability +3.2/5.0
- Schools +2.8/10.0
- Rent growth +2.5/5.0
- Condition / age +2.5/5.0
- Appreciation +0.0/10.0
$1
🖨 Deal sheet 📄 Offer letter ✓ Due diligence
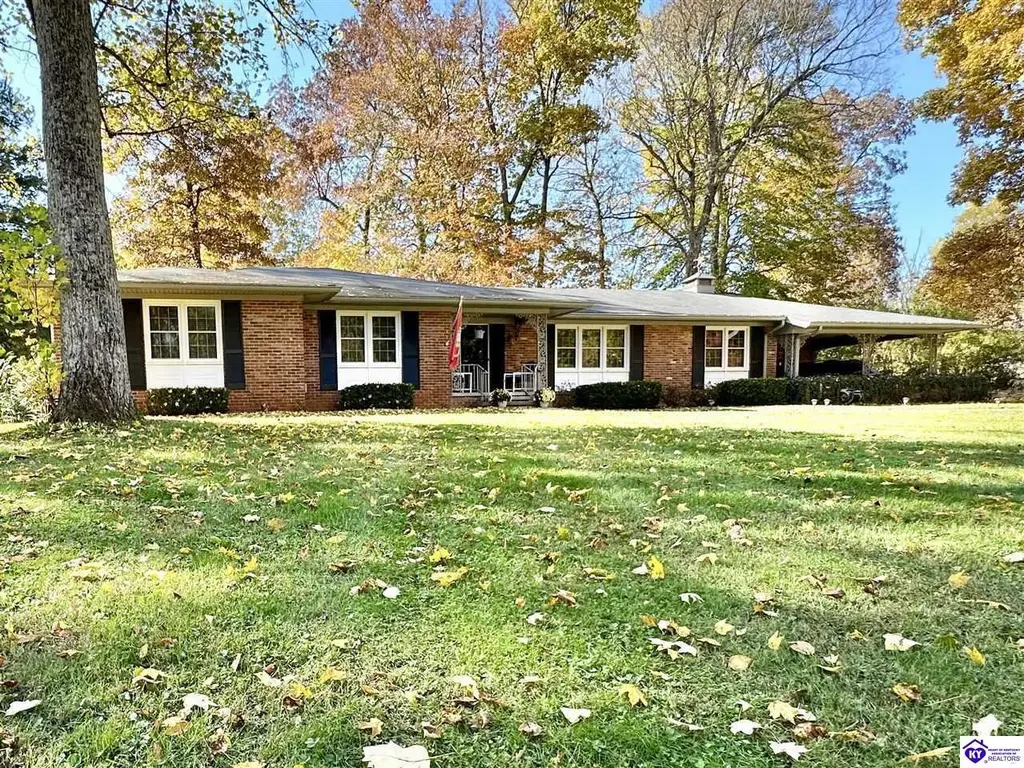
Listing remarks
Stunning, spacious ALL Brick ranch home located in a prestigious neighborhood, nestled on over 1/2-acre PARK-LIKE setting. Home Features: Open foyer welcomes you into a large living- room/dining area with large newly updated picture windows. Kitchen includes granite countertops with tile backsplash, built in Double Ovens and a stove top island with counter height seating. Family room features beamed ceilings, fireplace and sliding barn doors for added privacy. 4 large bedrooms and 2-1/2 baths. A newly remodeled master bath has double solid surface vanity and walk in tile shower. All bedrooms offer abundant closets for any and all storage needs. Other rooms include a separate home office, an
Key facts
- Beamed ceilings
- Stove top island
- Brick ranch home
Tags
Property features AI
Exterior
- Parking: Attached 1-car garage
- Security: Smoke detectors
- Utilities: Public water; Septic tank
- Home design: Residential property; Auction property
- Construction: Brick construction; Shingle roof; Below-grade finished area
- Exterior features: Patio; Porch
Interior
- Kitchen: Cooktop; Double oven; Dishwasher; Refrigerator
- Flooring: Carpet; Hardwood; Tile
- Bathrooms: 2 full bathrooms; 1 half bathroom; 2 main-level bathrooms; Accessible full bath
- Heating & cooling: Natural gas heating; Central air conditioning
- Interior features: Eat-in kitchen; Gas-log fireplace; Partially finished full basement
- Laundry & utility: Laundry room; Electric water heater
Neighborhood map
What this means for you Summary
Snapshot
- This is a 4-bed/2.0-bath other listed at $1.
Deal economics
- At list price, monthly cash flow is $1k ($18k/yr) — positive.
- The deal already cash-flows at list — no discount required.
- Meets the 1% rule at list price ($2k rent vs $1).
- Cap rate 1796960.4% vs local median 4.1% in Hodgenville — top-decile yield for the area; either an underpriced asset or a hidden risk that comps aren't pricing in. Stress-test before assuming the spread holds.
Location & tenants
- Location reads 65/100 on livability (#259 in KY) — a middle-class / working-renter tenant base. Strengths: cost of living A+, housing A+, health & safety A+; Watch: amenities F, commute F, employment D-.
- Larue County (rural): math 26% / reading 40% proficiency, ranked #82 of 165 in KY (top 50%) — families likely to look elsewhere, expect single-tenant / working-renter base with shorter leases.
- Zoned schools: Larue County High School (math 32% / reading 42%, grade F, #58 of 254 statewide, top 27%, 744 students, 46% FRL).
- Market conditions: 79 active listings in the ZIP; 65 units permitted in Larue County in 2024 (0 in 5+ unit buildings).
Forward outlook
- Local home prices are declining (-3.0%/yr); year-one equity from $0 of loan paydown is wiped out by about $0 of value loss. Plan a longer hold.
- Larue County population projected to shrink 5% by 2050 — rents likely to lag national; underwrite the cash flow, not the appreciation.
- At projected returns (-3.0% appreciation + 3.0% rent growth), your $0 cash investment doubles in ~1 year — after that, you're playing with house money.
Negotiation context
- Only 3 days on market — expect competitive offers; lowballing is unlikely to land.
- 4 sale attempts since 8y ago with the ask held roughly flat each time — persistent listings suggest the price (not the market) is what's stuck; bring a comps-based counter.
Questions for the listing agent
- Built in 1965 — when were the roof, HVAC, electrical panel, plumbing, and water heater last replaced?
- Is there a deadline driving the sale (1031 exchange, divorce, estate, relocation)? That informs how much negotiation room exists.
- Schools are D-rated, which usually means shorter tenancies and higher turnover. Who's the typical renter profile here, and what's been the actual vacancy rate?
- The area grade is low — what's the realistic commute time and amenity access for the typical tenant pool here? Any planned neighborhood developments (good or bad) we should know about?
- What's the average days-on-market for RENTAL listings here right now (not sales)? A rising rental-DOM trend means longer vacancies and softer asking-rent achievability than the comps imply.
- What's the recent tenant-quality profile in this submarket — average credit score on applications, eviction rate, late-payment / NSF rate, and stable-employment percentage? A property-management company in the area should have these aggregated.
- How much new for-sale + rental construction is in the pipeline within 1–3 miles? Heavy new supply typically softens prices + rents 12–24 months out; constrained supply supports both.
Investment metrics
- 1% rule
- 189553.00% ✓
- Cap rate
- 1796960.44%
- Cash-on-cash
- 6417693.38%
- DSCR
- 285552.24
- GRM
- 0.0
CMA / ARV
No comps found within radius.
Projected returns pro-forma
-3.0% appreciation · 3.0% rent growth · sell at horizon
- IRR
- —
- Equity multiple
- 340724.48×
- Total profit
- $95,403
- Equity at exit
- $0
- IRR
- —
- Equity multiple
- 735717.12×
- Total profit
- $206,001
- Equity at exit
- $0
Cash invested: $0 (down + closing). Projections, not guarantees.
Landlord ↔ Tenant lean methodology
- Overall (STATE)
- 83 Strongly Landlord-Friendly
- State Kentucky
- 83 Strongly Landlord-Friendly · R+16
- County
- — inherits STATE
- City
- — inherits STATE
ZIP-level market 42748
- Home prices YoY
- -28.9%
- Active inventory
- 79
Monthly cashflow live
- Estimated rent
- $1,896 medium interval (Pro) →
- Mortgage (P&I)
- −$0
- Tax est. 1.5%
- −$0 /mo · $0/yr
- Insurance
- −$0
- HOA
- −$0
- Vacancy / Maint / Mgmt
- −$398
- Net cashflow
- $1,497
Break-even live
UW: 25.0% down · 7.5% · 30yr · 1.5% tax · 5.0% vac · 8.0% maint · 8.0% mgmt
Financing live
Cash to close
- Down payment
- $0
- Closing costs
- $0
- Reserves months
- —
- Total cash needed
- —
Loan-product check · same deal, 3 products live
Conventional
25% down · 7.5% · 30yr
- Down + closing
- —
- Monthly P&I
- —
- Monthly cashflow
- —
- DSCR
- —
- Eligible?
- —
Personal DTI + credit; lowest rate.
DSCR
20% down · 8.5% · 30yr
- Down + closing
- —
- Monthly P&I
- —
- Monthly cashflow
- —
- DSCR
- —
- Eligible?
- —
No personal income docs; deal must DSCR.
Hard money
10% down · 12.0% · 12mo
- Down + closing
- —
- Monthly P&I
- —
- Monthly cashflow
- —
- DSCR
- —
- Eligible?
- —
Short-term bridge; refi at stabilization.
Listing history 15 events
-
2026-05-11status Pending
-
2026-05-08$1 Active
-
2026-03-30historical
-
2026-01-02price $364,900
-
2026-01-02price $364,900
-
2025-11-06$369,900 Active
-
2025-11-06$369,900 Active
-
2025-09-24price $399,900
-
2025-09-17price $409,500
-
2025-09-09price $410,000
-
2020-08-17soldstatus $264,000
-
2018-07-03soldstatus $233,000
-
2018-07-03soldstatus $233,000
-
2018-05-16$242,000
-
2000-09-01soldstatus $129,550
ⓘ Source: listings_history table (triggers on properties + properties_extension) + one-shot
backfill from property_details.listing_events for pre-trigger history.
Climate risk First Street
- Flood 1/10 Low FEMA zone X (unshaded) · 0% chance over 30 yrs
- Wildfire 4/10 Moderate
- Heat 4/10 Moderate 7 d/yr ≥104°F today · 20 d/yr by 30 yrs out
- Wind 2/10 Low 3% chance of damaging wind over 30 yrs
- Air quality 2/10 Low 0 unhealthy d/yr today · 1 by 30 yrs out
Nearby sold comps map
Loading sold comps map…
Walkable amenities ~0.75 mi
Loading nearby amenities…
Taxation est. · year 1
- Rental income
- $22,746
- − Mortgage interest
- −$0
- − Property taxes
- −$0
- − Insurance
- −$0
- − Repairs & maintenance
- −$1,820
- − Management
- −$1,820
- − Depreciation
- −$0
- Taxable income
- $19,107
- Est. tax owed @ 24.0%
- −$4,586
- After-tax cash flow
- $13,384/yr
For passive investors: Depreciation is non-cash, so a rental often shows a tax loss while cash-flowing — sheltering income. Rental losses are passive: they offset passive income freely, and up to $25,000/yr can offset ordinary (W-2) income if you actively participate and your MAGI is under $100k (phasing out to $0 by $150k); unused losses carry forward. On sale, claimed depreciation is recaptured at up to 25%, and gains may owe capital-gains tax (a 1031 exchange can defer both). Figures are a year-1 estimate at your 24.0% rate — not tax advice; consult a CPA.
Schools (NCES district)
- District
- Larue County
- NCES district ID
- 2103180
- Math proficiency
- 26% ▼ -20.00%
- Reading proficiency
- 40% ▼ -19.00%
- Median HH income
- $39,784
- Composite
- 27.66/100
- National rank
- #6918
- State rank
- #82 of 165 in KY
Livability — Hodgenville
- Score
- 65/100
- State rank
- #259
- US rank
- #12858
Category grades
Schools grade is shown separately in the Schools card above.
Census & demographics
- Population (ZIP)
- 9,189
Population outlook (Larue County) Hauer SSP2
- Today (2025)
- 14,441 people
- By 2030
- 14,453 · +0.1%
- By 2040
- 14,258 · -1.3%
- By 2050
- 13,687 · -5.2%
- By 2075
- 12,271 · -15.0%
- By 2100
- 10,639 · -26.3%
Race, ethnicity, and origin ACS 2023
- Neighborhood character
- Predominantly White (92%)
- Race & ethnicity
- White 92% Two or more races 5% Hispanic / Latino 4% Black 1%
- Common ancestry
- Lithuanian 4% Serbian 3% Slovak 1%
- Foreign-born
- 2% · Canada
- Languages at home
- 97% English-only · Spanish 3%
Political lean MEDSL · Larue
- 2024 margin
- Solid R (+60.4) · D 19.1% · R 79.5% · Other 1.3%
- 2008→2024 swing
- -24.1pp toward R · 2008: -36.3pp · 2024: -60.4pp
- All cycles
- 2024: R+60.4 2020: R+57.3 2016: R+55.4 2012: R+37.8 2008: R+36.3
Not yet ingested
- Civics
- —
Market trends
- HPI YoY
- ▼ -98.53%
- Current HPI
- 241.8077
- Rent YoY
- —
- Metro
- —
- State GDP YoY
- ▲ 1.81%
- F500 in state
- 4
Industry mix (Fortune 500 HQ in KY)
| Industry | F500 HQs | Revenue |
|---|---|---|
| Healthcare | 1 | $118B |
|
||
| Food / Beverage | 1 | $7B |
|
||
Price history
+181.7% since first listed15 events — show timeline
- 2026-05-11 Pending — HKARMLS
- 2026-05-08 Listed $1 HKARMLS
- 2026-03-30 Listing Removed — Metro Search MLS
- 2026-01-02 Price Changed $364,900 HKARMLS
- 2026-01-02 Price Changed $364,900 Metro Search MLS
- 2025-11-06 Listed $369,900 Metro Search MLS
- 2025-11-06 Listed $369,900 HKARMLS
- 2025-09-24 Price Changed $399,900 HKARMLS
- 2025-09-17 Price Changed $409,500 HKARMLS
- 2025-09-09 Price Changed $410,000 HKARMLS
- 2020-08-17 Sold (Public Records) $264,000 Public Records
- 2018-07-03 Sold (Public Records) $233,000 Public Records
- 2018-07-03 Sold (MLS) $233,000 HKARMLS
- 2018-05-16 Listed $242,000 HKARMLS
- 2000-09-01 Sold (Public Records) $129,550 Public Records
Property tax history
+32.8%/yrLatest (2022): $2,230 · +1603.4% YoY. Source: county tax records.
Cash-flow waterfall
monthlySold comps — $/sqft
last 12 mo · ≤1 miLoading sold comps…