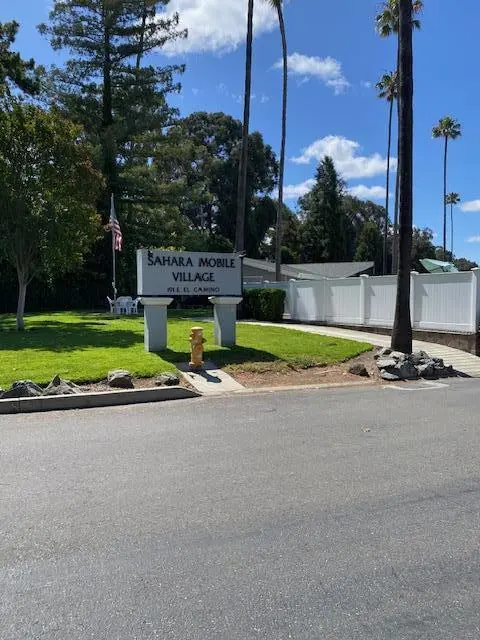
191 E El Camino Real #248 · Mountain View, CA
Flood risk No data
- FEMA flood zone
- —
- Chance of flooding over 30 yrs
- —
- Est. flood insurance / yr
- —
Fire risk No data
- Est. fire insurance / yr
- —
Heat risk No data
- Hot days now (above threshold)
- —
- Hot days in 30 yrs
- —
Wind risk No data
- Chance of severe wind over 30 yrs
- —
Air-quality risk No data
- Unhealthy air days now
- —
- Unhealthy air days in 30 yrs
- —
Risk factors via First Street. Map © Google.
Why this score? — see what drove the A- grade
The composite is a weighted blend of 9 inputs, each scored 0–100. Each bar is that input's sub-score; the figure is the points it added to the 100-point composite (weight × sub-score).
- Cash flow +30.0/30.0
- 1% rule +10.0/10.0
- DSCR +10.0/10.0
- Schools +8.0/10.0
- ARV discount +5.9/15.0
- Appreciation +5.1/10.0
- Livability +4.2/5.0
- Rent growth +4.1/5.0
- Condition / age +3.8/5.0
$188,000
🖨 Deal sheet 📄 Offer letter ✓ Due diligence
Listing remarks MLS
Fantastic location within Sahara Village Mobile Park. This one bedroom one bath home offers open floor plan with full size washer and dryer in property. Engineered hardwood floors, newer white kitchen with solid quartz counter tops. Yard has been lovingly cared for throughout the years and offers a paver patio with newer Shed for storage. Walk to downtown Mountain View and enjoy the convenient location to the Valley. Great School district. Roof replaced within the last 10 years. Home is being painted and cleaned. Ready to see Wednesday June 17
Key facts
- Open floor plan
- Newer white kitchen
- Paver patio
Tags
Property features AI
Finance
- HOA & community: Clubhouse; Community pool; Common utility room
Exterior
- Parking: Carport (1 space); Assigned space #248; Space rent applies
- Utilities: Public water; Public sewer; Public utilities
- Home design: Single-story; Living area approximately 672 (source: assessor)
- Construction: Composition roofing
- Exterior features: Composition roof; Leased land (park home site); Board approval required for restrictions
Interior
- Kitchen: Garbage disposal; Hood over range; Microwave; Gas range/oven; Pantry cabinet; Refrigerator
- Bedrooms: One ground-floor bedroom
- Flooring: Carpet; Hardwood; Laminate
- Bathrooms: One full bathroom with shower and tub
- Heating & cooling: Central forced-air heating; Ceiling fan; Other cooling (see remarks)
- Interior features: Kitchen and family room combined; Eat-in kitchen; Garbage disposal; Hood over range; Microwave; Gas range/oven; Pantry cabinet; Refrigerator; Laundry hookups only; Carpet, hardwood, and laminate flooring; Ceiling fan; Additional cooling noted in remarks; Central forced-air heating; Stone bathroom finishes; Shower and tub
- Laundry & utility: Washer/dryer hookups only
Neighborhood map
What this means for you Summary
Snapshot
- This is a 1-bed/1.0-bath manufactured listed at $188k. Condition is rated good.
Deal economics
- At list price, monthly cash flow is $1k ($16k/yr) — positive.
- The deal already cash-flows at list — no discount required.
- Meets the 1% rule at list price ($3k rent vs $188k).
- Cap rate 15.0% vs local median 1.4% in Mountain View — top-decile yield for the area; either an underpriced asset or a hidden risk that comps aren't pricing in. Stress-test before assuming the spread holds.
Location & tenants
- Location reads 84/100 on livability (#14 in CA, #671 nationally) — a professional / high-income tenant draw. Strengths: amenities A+, commute A+, employment A+; Watch: crime D+, cost of living F.
- Mountain View-Los Altos Union High (urban): math 77% / reading 86% proficiency, ranked #11 of 517 in CA (top 2%) — strong family-tenant draw, lease renewals of 3-5y typical.
- Zoned schools: Mountain View High (math 83% / reading 89%, grade A, #25 of 1,170 statewide, top 2%, 2,220 students, 13% FRL).
- Market conditions: Rents rising fast (+6.2%/yr); 59 active listings in the ZIP; 14 comparable units currently listed for rent nearby; rentals leasing fast (median 2d on market — plan ~1-2 weeks tenant-placement turnaround); high-income renter base; 3,838 units permitted in Santa Clara County in 2024 (1,886 in 5+ unit buildings).
Forward outlook
- In year one you build about $2k of equity ($1k loan paydown + $288 appreciation (0.1% local appreciation)).
- Santa Clara County population projected at +24% by 2050 — long-run rental-demand tailwind backs the buy-and-hold thesis.
- At projected returns (0.1% appreciation + 6.2% rent growth), your $53k cash investment doubles in ~3 years — after that, you're playing with house money.
Negotiation context
- Only 6 days on market — expect competitive offers; lowballing is unlikely to land.
- 2 sale attempts with the ask held roughly flat each time — persistent listings suggest the price (not the market) is what's stuck; bring a comps-based counter.
Questions for the listing agent
- Is there a deadline driving the sale (1031 exchange, divorce, estate, relocation)? That informs how much negotiation room exists.
- Schools are A-rated — typically a magnet for longer-tenancy family renters. What's the average tenant stay here, and is there a school-zone premium baked into asking?
- Crime grade is D in this area — have there been break-ins, vandalism, or insurance claims at this property in the last 3 years? What carrier currently insures it and at what premium?
- What's the average days-on-market for RENTAL listings here right now (not sales)? A rising rental-DOM trend means longer vacancies and softer asking-rent achievability than the comps imply.
- What's the recent tenant-quality profile in this submarket — average credit score on applications, eviction rate, late-payment / NSF rate, and stable-employment percentage? A property-management company in the area should have these aggregated.
- How much new for-sale + rental construction is in the pipeline within 1–3 miles? Heavy new supply typically softens prices + rents 12–24 months out; constrained supply supports both.
Investment metrics
- 1% rule
- 1.79% ✓
- Cap rate
- 14.97%
- Cash-on-cash
- 31.00%
- DSCR
- 2.38
- GRM
- 4.7
CMA / ARV
- ARV (on-the-fly)
- $181,440
- Comps found
- 1
Show comp detail 1 sale within ~0.75 mi
| Address | Dist | Beds/Ba | Sqft | Sold | Price | $/sf | Match |
|---|---|---|---|---|---|---|---|
| 191 E El Camino Real #304 | 0.71mi | 2/1.0 (+1) | 705 (+5%) | 9mo | $190,000 | $270 | 46 |
Match score weights: distance 35% · size 25% · config 20% · recency 20%. Top-matched comps best support the ARV.
Projected returns pro-forma
0.15% appreciation · 6.25% rent growth · sell at horizon
- IRR
- 34.9%
- Equity multiple
- 2.78×
- Total profit
- $93,881
- Equity at exit
- $56,035
- IRR
- 39.8%
- Equity multiple
- 6.12×
- Total profit
- $269,543
- Equity at exit
- $68,521
Cash invested: $52,640 (down + closing). Projections, not guarantees.
Landlord ↔ Tenant lean methodology
- Overall (CITY)
- 0 Strongly Tenant-Friendly
- State California
- 18 Strongly Tenant-Friendly · D+13
- County
- — inherits STATE
- City Mountain View
- 0 Strongly Tenant-Friendly · D+34
ZIP-level market 94040
- Home prices YoY
- 0.0%
- Rents YoY
- 6.2%
- Active inventory
- 59
- Price-to-rent
- 4.7×
Monthly cashflow live
- Estimated rent
- $3,366 high interval (Pro) →
- Mortgage (P&I)
- −$986
- Tax est. 1.5%
- −$235 /mo · $2,820/yr
- Insurance
- −$78
- HOA
- −$0
- Vacancy / Maint / Mgmt
- −$707
- Net cashflow
- $1,360
Break-even live
UW: 25.0% down · 7.5% · 30yr · 1.5% tax · 5.0% vac · 8.0% maint · 8.0% mgmt
Financing live
Cash to close
- Down payment
- $47,000
- Closing costs
- $5,640
- Reserves months
- —
- Total cash needed
- —
Loan-product check · same deal, 3 products live
Conventional
25% down · 7.5% · 30yr
- Down + closing
- —
- Monthly P&I
- —
- Monthly cashflow
- —
- DSCR
- —
- Eligible?
- —
Personal DTI + credit; lowest rate.
DSCR
20% down · 8.5% · 30yr
- Down + closing
- —
- Monthly P&I
- —
- Monthly cashflow
- —
- DSCR
- —
- Eligible?
- —
No personal income docs; deal must DSCR.
Hard money
10% down · 12.0% · 12mo
- Down + closing
- —
- Monthly P&I
- —
- Monthly cashflow
- —
- DSCR
- —
- Eligible?
- —
Short-term bridge; refi at stabilization.
Rent comps 14 comps
| Address | Beds | Baths | Sqft | Rent | $/sqft | DOM | Units | Dist |
|---|---|---|---|---|---|---|---|---|
| 225 Pamela Dr Mountain View, CA | 2.0 | 1.0–2.0 | 733 | $4,048 | $5.52 | 1d | 1 | 0.74mi |
| 707 Continental Cir Mountain View, CA | 1.0–2.0 | 1.0–2.0 | 810 | $3,236 | $4.00 | 1d | 25 | 0.81mi |
| 877 Heatherstone Way Mountain View, CA | 1.0–2.0 | 1.0–2.0 | 825 | $3,549 | $4.30 | 1d | 6 | 0.83mi |
| 370 Camille Ct Mountain View, CA | 1.0 | 1.0 | 401 | $2,495 | $6.22 | 19d | 1 | 0.93mi |
| 600 Rainbow Dr Mountain View, CA | 1.0–2.0 | 1.0–2.0 | 880 | $3,805 | $4.32 | 1d | 4 | 1.05mi |
| 870 E El Camino Real Mountain View, CA | 1.0–2.0 | 1.0–2.0 | 784 | $3,235 | $4.13 | 1d | 4 | 1.18mi |
| 880 Park Dr Unit 7 Mountain View, CA | 1.0 | 1.0 | 450 | $2,200 | $4.89 | 10d | 1 | 1.25mi |
| 801 Church St #127 Mountain View, CA | 1.0–2.0 | 1.0–2.0 | 825 | $4,760 | $5.77 | 10d | 2 | 1.38mi |
| 914 Mountain View Ave Mountain View, CA | 1.0 | 1.0 | 625 | $3,495 | $5.59 | 1d | 1 | 1.40mi |
| 775 S Shoreline Blvd Unit 05 Mountain View, CA | — | 1.0 | 480 | $2,750 | $5.73 | 1d | 1 | 1.42mi |
| 851 Church St Mountain View, CA | 1.0–2.0 | 1.0–2.0 | 832 | $3,808 | $4.57 | 1d | 21 | 1.42mi |
| 235 S Bernardo Ave Sunnyvale, CA | 1.0–2.0 | 1.0–2.0 | 782 | $3,176 | $4.06 | 1d | 8 | 1.47mi |
| 187 Acalanes Dr Sunnyvale, CA | 1.0 | 1.0 | 750 | $2,350 | $3.13 | 1d | 1 | 1.48mi |
| 151 Calderon Ave Mountain View, CA | 2.0 | 1.0 | 589 | $3,690 | $6.26 | 1d | 1 | 1.48mi |
Listing history 6 events
-
2026-06-18days on market $188,000 Active 6 DOM
-
2026-06-17days on market $188,000 Active 5 DOM
-
2026-06-16days on market $188,000 Active 4 DOM
-
2026-06-15days on market $188,000 Active 3 DOM
-
2026-06-13remarks 549-char remark
-
2026-06-13$188,000 Active 1 DOM
ⓘ Source: listings_history table (triggers on properties + properties_extension) + one-shot
backfill from property_details.listing_events for pre-trigger history.
Nearby sold comps map
Loading sold comps map…
Walkable amenities ~0.75 mi
Loading nearby amenities…
Taxation est. · year 1
- Rental income
- $40,390
- − Mortgage interest
- −$10,531
- − Property taxes
- −$2,820
- − Insurance
- −$940
- − Repairs & maintenance
- −$3,231
- − Management
- −$3,231
- − Depreciation
- −$5,469
- Taxable income
- $14,168
- Est. tax owed @ 24.0%
- −$3,400
- After-tax cash flow
- $12,917/yr
For passive investors: Depreciation is non-cash, so a rental often shows a tax loss while cash-flowing — sheltering income. Rental losses are passive: they offset passive income freely, and up to $25,000/yr can offset ordinary (W-2) income if you actively participate and your MAGI is under $100k (phasing out to $0 by $150k); unused losses carry forward. On sale, claimed depreciation is recaptured at up to 25%, and gains may owe capital-gains tax (a 1031 exchange can defer both). Figures are a year-1 estimate at your 24.0% rate — not tax advice; consult a CPA.
Condition & rehab AI · 5 photos
This mobile home in Sahara Village Mobile Park is in good condition with recent updates, ready for a new owner or renter.
Value-add opportunities
- Both Paint the exterior — Fresh paint enhances curb appeal and value
- Both Clean the windows — Clean windows improve natural light and aesthetics
Renovation cost estimate screening
Value-add ROI direction
- Both Paint the exterior — Fresh paint enhances curb appeal and value ↑
- Both Clean the windows — Clean windows improve natural light and aesthetics ↑
ⓘ Cost ranges are severity-bucket heuristics (US national rule-of-thumb). Get contractor quotes + a written scope before underwriting a rehab budget.
Schools (NCES district)
- District
- Mountain View-Los Altos Union High
- NCES district ID
- 0626310
- Math proficiency
- 77% ▲ 9.00%
- Reading proficiency
- 86% ▲ 4.00%
- Median HH income
- $161,233
- Composite
- 79.5/100
- National rank
- #59
- State rank
- #11 of 517 in CA
Livability — Mountain View
- Score
- 84/100
- State rank
- #14
- US rank
- #671
Category grades
Schools grade is shown separately in the Schools card above.
Census & demographics
- Census place
- Mountain View, CA
- County
- Santa Clara County · 1,806,974 people
- City population
- 84,858
- Metro
- San Jose-Sunnyvale-Santa Clara, CA
- Population (ZIP)
- 35,632
- Household income
- $187,781
- Rent vs Own
- Severe rent burden
- 1963.0
Population outlook (Santa Clara County) Hauer SSP2
- Today (2025)
- 2,179,074 people
- By 2030
- 2,301,297 · +5.6%
- By 2040
- 2,528,195 · +16.0%
- By 2050
- 2,712,135 · +24.5%
- By 2075
- 2,998,701 · +37.6%
- By 2100
- 2,931,429 · +34.5%
Race, ethnicity, and origin ACS 2023
- Neighborhood character
- Diverse neighborhood (Simpson 0.67)
- Race & ethnicity
- White 41% Asian 38% Hispanic / Latino 14% Two or more races 10% Black 1%
- Hispanic origin (detail)
- Mexican 10%
- Common ancestry
- Scotch-Irish 3% Romanian 2% Italian 2%
- Foreign-born
- 44% · China, Canada, South Korea
- Languages at home
- 50% English-only · Chinese 15% Spanish 12% Other Indo-European 8%
Political lean MEDSL · Santa Clara
- 2024 margin
- Solid D (+40.0) · D 68.1% · R 28.1% · Other 3.8%
- 2008→2024 swing
- -0.9pp no change · 2008: 40.9pp · 2024: 40.0pp
- All cycles
- 2024: D+40.0 2020: D+47.4 2016: D+52.5 2012: D+42.1 2008: D+40.9
Not yet ingested
- Civics
- —
Market trends
- HPI YoY
- ▲ 0.15%
- Current HPI
- 414.7279
- Rent YoY
- ▲ 6.25%
- Metro
- San Jose-Sunnyvale-Santa Clara, CA
- State GDP YoY
- ▲ 3.21%
- F500 in state
- 116
Industry mix (Fortune 500 HQ in CA)
| Industry | F500 HQs | Revenue |
|---|---|---|
| Technology | 27 | $1,492B |
|
||
| Financial Services | 3 | $174B |
|
||
| Retail | 3 | $44B |
|
||
| Insurance | 3 | $26B |
|
||
| Media / Entertainment | 2 | $115B |
|
||
| Pharmaceuticals / Biotech | 2 | $62B |
|
||
Price history
+0.0% since first listed2 events — show timeline
- 2026-06-12 Listed $188,000 MLSListings
- 2026-06-12 Listed $188,000 bridgeMLS, Bay East AOR, or Contra Costa AOR
Cash-flow waterfall
monthlySold comps — $/sqft
last 12 mo · ≤1 miLoading sold comps…