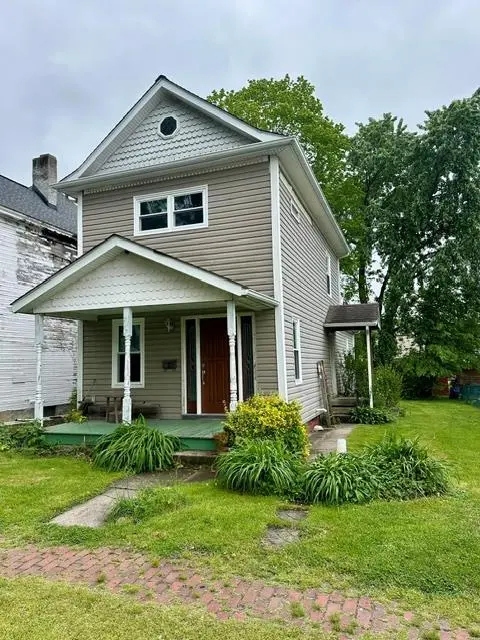
1107 Seventh St · Moundsville, WV
Flood risk 6/10 · Moderate
- FEMA flood zone
- X (unshaded)
- Chance of flooding over 30 yrs
- 0.69%
- Est. flood insurance / yr
- $473 – $860
Fire risk 1/10 · Minimal
- Est. fire insurance / yr
- $787 – $1,461
Heat risk 4/10 · Minor
- Hot days now (above 99°F)
- 8 days/yr
- Hot days in 30 yrs
- 21 days/yr
Wind risk 1/10 · Minimal
- Chance of severe wind over 30 yrs
- 0.0%
Air-quality risk 2/10 · Minimal
- Unhealthy air days now
- 1 days/yr
- Unhealthy air days in 30 yrs
- 3 days/yr
Risk factors via First Street. Map © Google.
Why this score? — see what drove the B+ grade
The composite is a weighted blend of 9 inputs, each scored 0–100. Each bar is that input's sub-score; the figure is the points it added to the 100-point composite (weight × sub-score).
- Cash flow +30.0/30.0
- ARV discount +15.0/15.0
- DSCR +10.0/10.0
- 1% rule +9.5/10.0
- Livability +3.3/5.0
- Schools +2.7/10.0
- Rent growth +2.5/5.0
- Condition / age +2.5/5.0
- Appreciation +0.0/10.0
$65,000
🖨 Deal sheet 📄 Offer letter ✓ Due diligence
Listing remarks
This charming 1-bedroom, 1.5-bath home offers great potential for customization and personal touches. While it requires some work, it features updated windows, siding, and partial flooring, providing a solid foundation for your renovation project. The spacious layout includes a comfortable living area and a versatile space that can be tailored to your needs. Ideal for investors or first-time homeowners, this property presents an excellent opportunity to create a cozy, personalized residence in a desirable location.
Key facts
- Versatile space
- Updated siding
- Updated windows
Tags
Property features AI
Finance
- Other: Property located in a residential zoning area
- Financial info: Tax amount not included per instructions
- HOA & community: HOA information not provided
Exterior
- Parking: Parking details not provided
- Security: No specific security features listed
- Utilities: Public water; Public sewer; Cable available
- Home design: Single-family residence (traditional); 2 stories
- Construction: Vinyl siding; Shingle roof; Built year not provided; Foundation details not provided
- Exterior features: Porch; Level lot
Interior
- Kitchen: Range; Gas water heater
- Bedrooms: Total of 6 rooms (bedroom count not specified)
- Flooring: Hardwood floors
- Bathrooms: 1 full bathroom; 1 half bathroom
- Heating & cooling: Forced-air heating (natural gas); Window air conditioning units
- Interior features: Walk-in closet(s); Full basement
- Laundry & utility: Washer/dryer location not specified
Neighborhood map
What this means for you Summary
Snapshot
- This is a 2-bed/1.5-bath single-family listed at $65k.
Deal economics
- At list price, monthly cash flow is $353 ($4k/yr) — positive.
- The deal already cash-flows at list — no discount required.
- Meets the 1% rule at list price ($943 rent vs $65k).
- Recommended offer: $63k (3.0% below list) — sets the bar for market timing.
- Cap rate 12.8% vs local median 4.7% in Moundsville — top-decile yield for the area; either an underpriced asset or a hidden risk that comps aren't pricing in. Stress-test before assuming the spread holds.
Location & tenants
- Location reads 66/100 on livability (#105 in WV) — a middle-class / working-renter tenant base. Strengths: cost of living A+, housing A-, health & safety A-; Watch: schools D+, amenities F, commute F.
- Marshall County Schools (suburban): math 28% / reading 36% proficiency, ranked #21 of 55 in WV (top 38%) — families likely to look elsewhere, expect single-tenant / working-renter base with shorter leases.
- Market conditions: 78 active listings in the ZIP; 6 units permitted in Marshall County in 2024 (0 in 5+ unit buildings).
Forward outlook
- Local home prices are declining (-3.0%/yr); year-one equity from $449 of loan paydown is wiped out by about $2k of value loss. Plan a longer hold.
- Marshall County population projected at -19% by 2050 — secular population decline; favor cash flow + early exit over multi-decade hold.
- At projected returns (-3.0% appreciation + 3.0% rent growth), your $18k cash investment doubles in ~6 years — after that, you're playing with house money.
Negotiation context
- It's been on market 44 days — a 3% lower offer ($63k) is reasonable based on typical stale-listing flexibility.
Risks & watch-outs
- Watch-outs: built in 1900 — expect roof / HVAC / electrical / plumbing capex.
- Climate carrying-cost: major flood risk — expect insurance premiums to compound above CPI over the hold.
Questions for the listing agent
- It's been on market 44 days. Have you received any prior offers? Is the seller open to a 3% concession, seller financing, or rate buy-down credit?
- Built in 1900 — when were the roof, HVAC, electrical panel, plumbing, and water heater last replaced?
- Is there a deadline driving the sale (1031 exchange, divorce, estate, relocation)? That informs how much negotiation room exists.
- Schools are D-rated, which usually means shorter tenancies and higher turnover. Who's the typical renter profile here, and what's been the actual vacancy rate?
- What's the average days-on-market for RENTAL listings here right now (not sales)? A rising rental-DOM trend means longer vacancies and softer asking-rent achievability than the comps imply.
- What's the recent tenant-quality profile in this submarket — average credit score on applications, eviction rate, late-payment / NSF rate, and stable-employment percentage? A property-management company in the area should have these aggregated.
- How much new for-sale + rental construction is in the pipeline within 1–3 miles? Heavy new supply typically softens prices + rents 12–24 months out; constrained supply supports both.
Investment metrics
- 1% rule
- 1.45% ✓
- Cap rate
- 12.81%
- Cash-on-cash
- 23.28%
- DSCR
- 2.04
- GRM
- 5.7
CMA / ARV
- ARV (on-the-fly)
- $105,336
- Comps found
- 12
Show comp detail 12 sales within ~0.75 mi
| Address | Dist | Beds/Ba | Sqft | Sold | Price | $/sf | Match |
|---|---|---|---|---|---|---|---|
| 1404 9th St | 0.19mi | 2/1.5 | 1,260 (+0%) | 1mo | $128,500 | $102 | 90 |
| 1106 8th St | 0.03mi | 3/2.0 (+1) | 1,156 (-8%) | 8mo | $75,000 | $65 | 72 |
| 207 Tomlinson Ave | 0.42mi | 3/1.0 (+1) | 1,232 (-2%) | 7mo | $70,000 | $57 | 65 |
| 606 12th St | 0.43mi | 3/2.0 (+1) | 1,320 (+5%) | 0mo | $120,000 | $91 | 64 |
| 1502 8th St | 0.25mi | 3/1.0 (+1) | 1,385 (+10%) | 2mo | $101,000 | $73 | 62 |
| 524 9th St | 0.27mi | 3/1.0 (+1) | 1,374 (+10%) | 3mo | $41,500 | $30 | 62 |
| 1004 Morton Ave | 0.25mi | 3/1.0 (+1) | 1,373 (+10%) | 6mo | $36,000 | $26 | 60 |
| 1012 Mcconnell Dr | 0.22mi | 3/2.0 (+1) | 1,080 (-14%) | 1mo | $150,000 | $139 | 59 |
| 1025 Morton Ave | 0.31mi | 3/1.5 (+1) | 1,355 (+8%) | 10mo | $148,000 | $109 | 58 |
| 2018 Jackson St | 0.69mi | 3/1.0 (+1) | 1,296 (+3%) | 1mo | $193,000 | $149 | 55 |
| 117 Ash Ave | 0.48mi | 3/1.5 (+1) | 1,392 (+11%) | 3mo | $106,000 | $76 | 52 |
| 2009 Center St | 0.75mi | 2/1.0 | 1,172 (-6%) | 6mo | $99,000 | $84 | 48 |
Match score weights: distance 35% · size 25% · config 20% · recency 20%. Top-matched comps best support the ARV.
Projected returns pro-forma
-3.0% appreciation · 3.0% rent growth · sell at horizon
- IRR
- 16.3%
- Equity multiple
- 1.66×
- Total profit
- $11,938
- Equity at exit
- $9,692
- IRR
- 24.9%
- Equity multiple
- 3.16×
- Total profit
- $39,273
- Equity at exit
- $5,620
Cash invested: $18,200 (down + closing). Projections, not guarantees.
Landlord ↔ Tenant lean methodology
- Overall (STATE)
- 83 Strongly Landlord-Friendly
- State West Virginia
- 83 Strongly Landlord-Friendly · R+22
- County
- — inherits STATE
- City
- — inherits STATE
ZIP-level market 26041
- Home prices YoY
- -24.8%
- Active inventory
- 78
- Price-to-rent
- 5.7×
Monthly cashflow live
- Estimated rent
- $943 medium interval (Pro) →
- Mortgage (P&I)
- −$341
- Tax from tax record
- −$24 /mo · $290/yr
- Insurance
- −$27
- HOA
- −$0
- Vacancy / Maint / Mgmt
- −$198
- Net cashflow
- $353
Break-even live
UW: 25.0% down · 7.5% · 30yr · 1.5% tax · 5.0% vac · 8.0% maint · 8.0% mgmt
Financing live
Cash to close
- Down payment
- $16,250
- Closing costs
- $1,950
- Reserves months
- —
- Total cash needed
- —
Loan-product check · same deal, 3 products live
Conventional
25% down · 7.5% · 30yr
- Down + closing
- —
- Monthly P&I
- —
- Monthly cashflow
- —
- DSCR
- —
- Eligible?
- —
Personal DTI + credit; lowest rate.
DSCR
20% down · 8.5% · 30yr
- Down + closing
- —
- Monthly P&I
- —
- Monthly cashflow
- —
- DSCR
- —
- Eligible?
- —
No personal income docs; deal must DSCR.
Hard money
10% down · 12.0% · 12mo
- Down + closing
- —
- Monthly P&I
- —
- Monthly cashflow
- —
- DSCR
- —
- Eligible?
- —
Short-term bridge; refi at stabilization.
Listing history 15 events
-
2026-06-19pricedays on market $65,000 Active 44 DOM
-
2026-06-18days on market $70,000 Active 43 DOM
-
2026-06-17days on market $70,000 Active 42 DOM
-
2026-06-16days on market $70,000 Active 41 DOM
-
2026-06-15days on market $70,000 Active 40 DOM
-
2026-06-14days on market $70,000 Active 38 DOM
-
2026-06-12days on market $70,000 Active 37 DOM
-
2026-06-09days on market $70,000 Active 34 DOM
-
2026-06-08days on market $70,000 Active 33 DOM
-
2026-06-07days on market $70,000 Active 32 DOM
-
2026-06-02days on market $70,000 Active 27 DOM
-
2026-06-01days on market $70,000 Active 26 DOM
-
2026-05-31days on market $70,000 Active 25 DOM
-
2026-05-30days on market $70,000 Active 24 DOM
-
2026-05-06$70,000 Active
ⓘ Source: listings_history table (triggers on properties + properties_extension) + one-shot
backfill from property_details.listing_events for pre-trigger history.
Tax reassessment forecast WV · Resets to sale price
- Current annual tax
- $290 · $24/mo
- Projected year-2 tax
- $384 · $32/mo
- Expected delta
- +$93/yr (+$8/mo · 32.1%)
ⓘ Screening estimate from a state-policy table — verify with the county assessor before closing.
Climate risk First Street
- Flood 6/10 Major FEMA zone X (unshaded) · 69% chance over 30 yrs
- Wildfire 1/10 Low
- Heat 4/10 Moderate 8 d/yr ≥99°F today · 21 d/yr by 30 yrs out
- Wind 1/10 Low 0% chance of damaging wind over 30 yrs
- Air quality 2/10 Low 1 unhealthy d/yr today · 3 by 30 yrs out
Nearby sold comps map
Loading sold comps map…
Walkable amenities ~0.75 mi
Loading nearby amenities…
Taxation est. · year 1
- Rental income
- $11,321
- − Mortgage interest
- −$3,641
- − Property taxes
- −$290
- − Insurance
- −$325
- − Repairs & maintenance
- −$906
- − Management
- −$906
- − Depreciation
- −$1,891
- Taxable income
- $3,362
- Est. tax owed @ 24.0%
- −$807
- After-tax cash flow
- $3,431/yr
For passive investors: Depreciation is non-cash, so a rental often shows a tax loss while cash-flowing — sheltering income. Rental losses are passive: they offset passive income freely, and up to $25,000/yr can offset ordinary (W-2) income if you actively participate and your MAGI is under $100k (phasing out to $0 by $150k); unused losses carry forward. On sale, claimed depreciation is recaptured at up to 25%, and gains may owe capital-gains tax (a 1031 exchange can defer both). Figures are a year-1 estimate at your 24.0% rate — not tax advice; consult a CPA.
Schools (NCES district)
- District
- Marshall County Schools
- NCES district ID
- 5400750
- Math proficiency
- 28% ▼ -6.00%
- Reading proficiency
- 36% ▼ -4.00%
- Median HH income
- $40,289
- Composite
- 26.91/100
- National rank
- #7086
- State rank
- #21 of 55 in WV
Livability — Moundsville
- Score
- 66/100
- State rank
- #105
- US rank
- #11553
Category grades
Schools grade is shown separately in the Schools card above.
Census & demographics
- Census place
- Moundsville, WV
- County
- Marshall · 16,750 people
- Metro
- Wheeling, WV-OH
- Population (ZIP)
- 15,706
- Household income
- $55,545
- Rent vs Own
- Severe rent burden
- 7.4
Population outlook (Marshall County) Hauer SSP2
- Today (2025)
- 30,387 people
- By 2030
- 29,242 · -3.8%
- By 2040
- 26,806 · -11.8%
- By 2050
- 24,627 · -19.0%
- By 2075
- 19,846 · -34.7%
- By 2100
- 15,169 · -50.1%
Race, ethnicity, and origin ACS 2023
- Neighborhood character
- Predominantly White (94%)
- Race & ethnicity
- White 94% Two or more races 3% Hispanic / Latino 1%
- Common ancestry
- Romanian 4% Iranian 2% Italian 1%
- Foreign-born
- 1% · Canada
- Languages at home
- 98% English-only · Spanish 1% German/W. Germanic 1%
Political lean MEDSL · Marshall
- 2024 margin
- Solid R (+50.0) · D 24.1% · R 74.1% · Other 1.8%
- 2008→2024 swing
- -37.5pp toward R · 2008: -12.6pp · 2024: -50.0pp
- All cycles
- 2024: R+50.0 2020: R+49.6 2016: R+51.0 2012: R+28.6 2008: R+12.6
Not yet ingested
- Civics
- —
Market trends
- HPI YoY
- ▼ -50.71%
- Current HPI
- 153.9522
- Rent YoY
- —
- Metro
- —
- State GDP YoY
- —
- F500 in state
- 0
Price history
1 event — show timeline
- 2026-05-06 Listed $70,000 WBOR
Property tax history
-4.7%/yrLatest (2025): $290 · +2.5% YoY. Source: county tax records.
Cash-flow waterfall
monthlySold comps — $/sqft
last 12 mo · ≤1 miLoading sold comps…