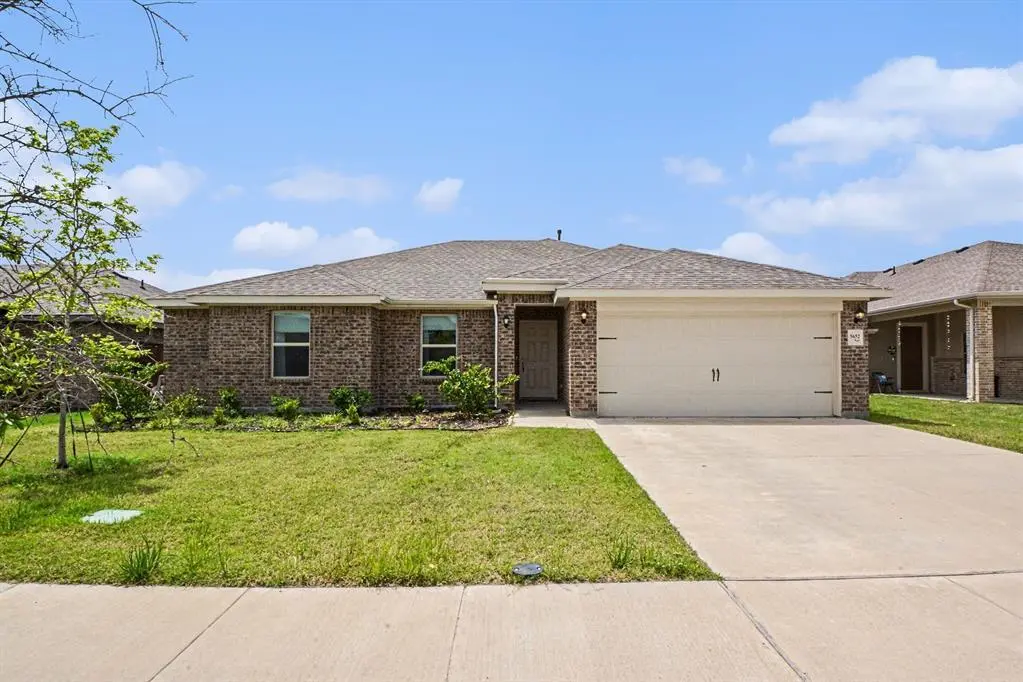
5652 Huffines Blvd · Royse City, TX
Flood risk No data
- FEMA flood zone
- —
- Chance of flooding over 30 yrs
- —
- Est. flood insurance / yr
- —
Fire risk No data
- Est. fire insurance / yr
- —
Heat risk No data
- Hot days now (above threshold)
- —
- Hot days in 30 yrs
- —
Wind risk No data
- Chance of severe wind over 30 yrs
- —
Air-quality risk No data
- Unhealthy air days now
- —
- Unhealthy air days in 30 yrs
- —
Risk factors via First Street. Map © Google.
Why this score? — see what drove the D grade
The composite is a weighted blend of 9 inputs, each scored 0–100. Each bar is that input's sub-score; the figure is the points it added to the 100-point composite (weight × sub-score).
- ARV discount +11.4/15.0
- Cash flow +10.1/30.0
- Condition / age +4.0/5.0
- 1% rule +3.9/10.0
- Schools +3.8/10.0
- Livability +3.8/5.0
- DSCR +2.9/10.0
- Rent growth +2.2/5.0
- Appreciation +0.0/10.0
$305,000
🖨 Deal sheet (PDF) 📄 Offer letter ✓ Due diligence
Listing remarks
This beautifully maintained, right-sized home offers 4 bedrooms with a functional open-concept layout designed for modern living. The spacious Owner’s Suite is thoughtfully separated from the secondary bedrooms for added privacy. Secondary bedrooms are located on the opposite side of the home, creating an ideal split-bedroom arrangement. The well-appointed kitchen is perfect for entertaining and everyday living, complete with granite countertops, a large island, walk-in pantry, abundant cabinetry, and generous counter space. Additional upgrades include wood-look tile flooring and a convenient mud bench at the garage entry. Added value for buyers: Enjoy lower monthly electricity bill w
Key facts
- Owner’s suite
- Large island
- Granite countertops
Tags
Property features AI
Finance
- Other: Subdivision: Waterscape Ph 3a; Located in Rockwall County
- HOA & community: Mandatory HOA with full use of facilities; HOA administered by First Service Residential; Annual association fee (amount provided separately)
Exterior
- Parking: Covered parking for 2 vehicles; Attached 2-car garage; Driveway; Garage door opener
- Utilities: City water; Electricity available; Master gas meter; Master water meter; All-weather road access; Located in a municipal utility district
- Home design: Single-family residence; One story; Residential property; Preowned (built 2023); Smart home features enabled
- Construction: Built in 2023
- Exterior features: Covered rear porch
Interior
- Kitchen: Granite countertops; Kitchen island; Walk-in pantry; Water line to refrigerator; Dishwasher; Disposal; Gas oven; Gas range; Microwave
- Bedrooms: 4 bedrooms (all on main level); Primary bedroom with dual sinks and walk-in closet
- Bathrooms: 2 full bathrooms; Primary bathroom with Corian-style countertops, dual sinks, linen closet, and separate shower
- Heating & cooling: Central heating; Central air; Ceiling fan(s)
- Interior features: Open floorplan; Cable TV available; Walk-in closet(s)
- Laundry & utility: Washer/dryer hook-ups (utility details not specified)
Neighborhood map
What this means for you Summary
Snapshot
- This is a 4-bed/2.0-bath single-family listed at $305k. Condition is rated good.
Deal economics
- At list price, monthly cash flow is $-179 ($-2k/yr) — negative.
- To cash-flow at today's rent, offer at most $273k (10.4% below list).
- To meet the 1% rule (rent ≥ 1% of price), the offer needs to be $272k (10.9% below list).
- Recommended offer: $272k (10.9% below list) — sets the bar for 1% rule.
- Cap rate 5.6% vs local median 4.2% in Royse City — top-decile yield for the area; either an underpriced asset or a hidden risk that comps aren't pricing in. Stress-test before assuming the spread holds.
Location & tenants
- Location reads 75/100 on livability (#158 in TX, #4,292 nationally) — a middle-class / working-renter tenant base. Strengths: crime A+, employment A+, housing A+; Watch: amenities F, commute F.
- Royse City ISD (rural): math 42% / reading 42% proficiency, ranked #266 of 826 in TX (top 32%) — families likely to look elsewhere, expect single-tenant / working-renter base with shorter leases.
- Zoned schools: Anita Scott El (math 53% / reading 40%, grade D-, #1,080 of 4,322 statewide, top 25%, 712 students, 47% FRL); Ouida Baley Middle (math 32% / reading 35%, grade F, #911 of 1,662 statewide, top 56%, 934 students, 43% FRL); Royse City H S (math 38% / reading 55%, grade D-, #621 of 1,632 statewide, top 38%, 2,526 students, 37% FRL).
- Market conditions: Rents soft (-1.1%/yr); 1301 active listings in the ZIP; 2 comparable units currently listed for rent nearby; high-income renter base; 1,810 units permitted in Rockwall County in 2024 (0 in 5+ unit buildings).
Forward outlook
- Local home prices are declining (-3.0%/yr); year-one equity from $2k of loan paydown is wiped out by about $9k of value loss. Plan a longer hold.
- Rockwall County population projected at +56% by 2050 — long-run rental-demand tailwind backs the buy-and-hold thesis.
Negotiation context
- It's been on market 54 days — a 3% lower offer ($296k) is reasonable based on typical stale-listing flexibility.
- 4 sale attempts since 3y ago with the ask held roughly flat each time — persistent listings suggest the price (not the market) is what's stuck; bring a comps-based counter.
Questions for the listing agent
- What do current leases actually rent for vs. the listed asking? Can we see a recent rent roll and the last 12 months of T-12 income?
- It's been on market 54 days. Have you received any prior offers? Is the seller open to a 11% concession, seller financing, or rate buy-down credit?
- What does the HOA fee cover, when was the last increase, and are there any pending special assessments or reserve-fund shortfalls?
- Is there a deadline driving the sale (1031 exchange, divorce, estate, relocation)? That informs how much negotiation room exists.
- The area grade is low — what's the realistic commute time and amenity access for the typical tenant pool here? Any planned neighborhood developments (good or bad) we should know about?
- What's the average days-on-market for RENTAL listings here right now (not sales)? A rising rental-DOM trend means longer vacancies and softer asking-rent achievability than the comps imply.
- What's the recent tenant-quality profile in this submarket — average credit score on applications, eviction rate, late-payment / NSF rate, and stable-employment percentage? A property-management company in the area should have these aggregated.
- How much new for-sale + rental construction is in the pipeline within 1–3 miles? Heavy new supply typically softens prices + rents 12–24 months out; constrained supply supports both.
Investment metrics
- 1% rule
- 0.89% ✗
- Cap rate
- 5.59%
- Cash-on-cash
- -2.52%
- DSCR
- 0.89
- GRM
- 9.4
CMA / ARV
- ARV (median comp)
- $333,629
- List price
- $305,000
- Delta
- -8.58%
- Verdict
- FAIR
- Comps
- 20 within 1.0 mi
Show comp detail 12 sales within ~0.75 mi
| Address | Dist | Beds/Ba | Sqft | Sold | Price | $/sf | Match |
|---|---|---|---|---|---|---|---|
| 2001 Bayfront Dr | 0.25mi | 3/2.0 (-1) | 1,605 (-6%) | 1mo | $309,990 | $193 | 72 |
| 2017 Bayfront Dr | 0.25mi | 3/2.0 (-1) | 1,605 (-6%) | 3mo | $299,990 | $187 | 70 |
| 5512 Huffines Blvd | 0.26mi | 4/2.0 | 1,889 (+10%) | 1mo | $305,000 | $161 | 70 |
| 3166 Duck Heights Ave | 0.38mi | 4/2.0 | 1,845 (+8%) | 1mo | $339,990 | $184 | 68 |
| 3131 Duck Heights Ave | 0.39mi | 4/2.0 | 1,845 (+8%) | 1mo | $339,990 | $184 | 68 |
| 3147 Duck Heights Ave | 0.40mi | 4/2.0 | 1,845 (+8%) | 5mo | $338,990 | $184 | 64 |
| 3043 Duck Heights Ave | 0.41mi | 3/2.0 (-1) | 1,840 (+7%) | 2mo | $399,500 | $217 | 62 |
| 2029 Bayfront Dr | 0.25mi | 3/2.0 (-1) | 1,480 (-14%) | 6mo | $283,680 | $192 | 56 |
| 2021 Bayfront Dr | 0.25mi | 3/2.0 (-1) | 1,458 (-15%) | 7mo | $297,990 | $204 | 52 |
| 3034 Estuary Dr | 0.62mi | 3/2.0 (-1) | 1,845 (+8%) | 2mo | $299,999 | $163 | 52 |
| 2178 Slow Stream Dr | 0.50mi | 3/2.0 (-1) | 1,882 (+10%) | 6mo | $317,000 | $168 | 50 |
| 2154 Slow Stream Dr | 0.56mi | 3/2.0 (-1) | 1,845 (+8%) | 8mo | $279,000 | $151 | 49 |
Match score weights: distance 35% · size 25% · config 20% · recency 20%. Top-matched comps best support the ARV.
Projected returns pro-forma
-3.0% appreciation · 0.0% rent growth · sell at horizon
- IRR
- -24.2%
- Equity multiple
- 0.20×
- Total profit
- $-68,628
- Equity at exit
- $45,476
- IRR
- -33.3%
- Equity multiple
- -0.22×
- Total profit
- $-104,520
- Equity at exit
- $26,371
Cash invested: $85,400 (down + closing). Projections, not guarantees.
Landlord ↔ Tenant lean methodology
- Overall (STATE)
- 87 Strongly Landlord-Friendly
- State Texas
- 87 Strongly Landlord-Friendly · R+5
- County
- — inherits STATE
- City
- — inherits STATE
ZIP-level market 75189
- Home prices YoY
- -25.0%
- Rents YoY
- -1.1%
- Active inventory
- 1301
- Price-to-rent
- 9.4×
Monthly cashflow live
- Estimated rent
- $2,716 medium interval (Pro) →
- Mortgage (P&I)
- −$1,599
- Tax from tax record
- −$549 /mo · $6,584/yr
- Insurance
- −$127
- HOA
- −$50
- Vacancy / Maint / Mgmt
- −$570
- Net cashflow
- $-179
Break-even live
Sensitivity live
| Price | -10% $-7 | -5% $-93 | +0% $-179 | +5% $-266 | +10% $-352 |
|---|---|---|---|---|---|
| Rent | -10% $-394 | -5% $-287 | +0% $-179 | +5% $-72 | +10% $35 |
| Rate | -1.0pp $-26 | -0.5pp $-102 | base $-179 | +0.5pp $-258 | +1.0pp $-339 |
UW: 25.0% down · 7.5% · 30yr · 1.5% tax · 5.0% vac · 8.0% maint · 8.0% mgmt
Financing live
Cash to close
- Down payment
- $76,250
- Closing costs
- $9,150
- Reserves months
- —
- Total cash needed
- —
Loan-product check · same deal, 3 products live
Conventional
25% down · 7.5% · 30yr
- Down + closing
- —
- Monthly P&I
- —
- Monthly cashflow
- —
- DSCR
- —
- Eligible?
- —
Personal DTI + credit; lowest rate.
DSCR
20% down · 8.5% · 30yr
- Down + closing
- —
- Monthly P&I
- —
- Monthly cashflow
- —
- DSCR
- —
- Eligible?
- —
No personal income docs; deal must DSCR.
Hard money
10% down · 12.0% · 12mo
- Down + closing
- —
- Monthly P&I
- —
- Monthly cashflow
- —
- DSCR
- —
- Eligible?
- —
Short-term bridge; refi at stabilization.
Rent comps 2 comps
| Address | Beds | Baths | Sqft | Rent | $/sqft | DOM | Units | Dist |
|---|---|---|---|---|---|---|---|---|
| 3762 S FM 548 Royse City, TX | 3.0 | 2.0 | 1568 | $1,899 | $1.21 | 7d | 1 | 1.15mi |
| 107 Dustin Dr Fate, TX | 3.0 | 2.0 | 1659 | $2,600 | $1.57 | 23d | 1 | 1.46mi |
HOA detail
- Monthly dues
- $50 · $600/yr
- Likely covers
- electric
Listing history 24 events
-
2026-06-21days on market $305,000 Active 54 DOM
-
2026-06-18days on market $305,000 Active 51 DOM
-
2026-06-17days on market $305,000 Active 50 DOM
-
2026-06-16days on market $305,000 Active 49 DOM
-
2026-06-15days on market $305,000 Active 48 DOM
-
2026-06-13days on market $305,000 Active 46 DOM
-
2026-06-09days on market $305,000 Active 42 DOM
-
2026-06-08days on market $305,000 Active 41 DOM
-
2026-06-07days on market $305,000 Active 40 DOM
-
2026-06-04days on market $305,000 Active 37 DOM
-
2026-06-03days on market $305,000 Active 36 DOM
-
2026-06-02days on market $305,000 Active 35 DOM
-
2026-06-01days on market $305,000 Active 34 DOM
-
2026-05-31days on market $305,000 Active 33 DOM
-
2026-04-27$315,000 Active 1272-char remark
-
2026-04-20historical
-
2026-04-17$315,000 Active
-
2026-04-11historical
-
2026-03-04price $319,000
-
2026-01-11$325,000 Active
-
2023-06-29soldstatus Closed
-
2023-04-18status Pending
-
2023-03-21price $318,073
-
2023-01-19$313,073 Active
ⓘ Source: listings_history table (triggers on properties + properties_extension) + one-shot
backfill from property_details.listing_events for pre-trigger history.
Tax reassessment forecast TX · Resets to sale price
- Current annual tax
- $6,584 · $549/mo
- Projected year-2 tax
- $6,584 · $549/mo
- Expected delta
- $0/yr ($0/mo · 0.0%)
ⓘ Screening estimate from a state-policy table — verify with the county assessor before closing.
Nearby sold comps map
Loading sold comps map…
Walkable amenities ~0.75 mi
Loading nearby amenities…
Taxation est. · year 1
- Rental income
- $32,597
- − Mortgage interest
- −$17,085
- − Property taxes
- −$6,584
- − Insurance
- −$1,525
- − Repairs & maintenance
- −$2,608
- − Management
- −$2,608
- − HOA
- −$600
- − Depreciation
- −$8,873
- Taxable loss
- −$7,286
- Est. tax savings @ 24.0%
- +$1,749
- After-tax cash flow
- $-403/yr
For passive investors: Depreciation is non-cash, so a rental often shows a tax loss while cash-flowing — sheltering income. Rental losses are passive: they offset passive income freely, and up to $25,000/yr can offset ordinary (W-2) income if you actively participate and your MAGI is under $100k (phasing out to $0 by $150k); unused losses carry forward. On sale, claimed depreciation is recaptured at up to 25%, and gains may owe capital-gains tax (a 1031 exchange can defer both). Figures are a year-1 estimate at your 24.0% rate — not tax advice; consult a CPA.
Condition & rehab AI · 12 photos
This well-maintained, split-bedroom home offers a functional open-concept layout and is ready for immediate move-in. It has a good condition score and minimal repairs needed, making it an excellent investment opportunity.
Value-add opportunities
- Both Painting exterior and interior walls — Fresh paint enhances curb appeal and interior aesthetics
- Both Landscaping and curb appeal improvements — Enhances curb appeal and can attract more buyers
- Both Add a smart home system — Improves energy efficiency and adds modern amenities
Renovation cost estimate screening
Value-add ROI direction
- Both Painting exterior and interior walls — Fresh paint enhances curb appeal and interior aesthetics ↑
- Both Landscaping and curb appeal improvements — Enhances curb appeal and can attract more buyers ↑
- Both Add a smart home system — Improves energy efficiency and adds modern amenities ↑
ⓘ Cost ranges are severity-bucket heuristics (US national rule-of-thumb). Get contractor quotes + a written scope before underwriting a rehab budget.
Schools (NCES district)
- District
- Royse City ISD
- NCES district ID
- 4838220
- Math proficiency
- 42% ▼ -10.00%
- Reading proficiency
- 42% ▼ -5.00%
- Median HH income
- $73,810
- Composite
- 38.44/100
- National rank
- #4197
- State rank
- #266 of 826 in TX
Livability — Royse City
- Score
- 75/100
- State rank
- #158
- US rank
- #4292
Category grades
Schools grade is shown separately in the Schools card above.
Census & demographics
- County
- Rockwall County · 132,930 people
- City population
- 48,739
- Metro
- Dallas-Fort Worth-Arlington, TX
- Population (ZIP)
- 48,739
- Household income
- $117,125
- Rent vs Own
- Severe rent burden
- 569.0
Population outlook (Rockwall County) Hauer SSP2
- Today (2025)
- 118,396 people
- By 2030
- 132,209 · +11.7%
- By 2040
- 159,538 · +34.7%
- By 2050
- 185,299 · +56.5%
- By 2075
- 243,489 · +105.7%
- By 2100
- 277,814 · +134.6%
Race, ethnicity, and origin ACS 2023
- Neighborhood character
- Diverse neighborhood (Simpson 0.57)
- Race & ethnicity
- White 60% Hispanic / Latino 25% Two or more races 12% Black 10% Asian 2%
- Hispanic origin (detail)
- Mexican 20%
- Common ancestry
- Slovak 2% Serbian 1% Lithuanian 1%
- Foreign-born
- 10% · Canada, Philippines, Jamaica
- Languages at home
- 80% English-only · Spanish 15% Other Indo-European 1%
Political lean MEDSL · Rockwall
- 2024 margin
- Solid R (+40.9) · D 29.1% · R 70.0%
- 2008→2024 swing
- +5.3pp toward D · 2008: -46.2pp · 2024: -40.9pp
- All cycles
- 2024: R+40.9 2020: R+37.7 2016: R+47.5 2012: R+53.3 2008: R+46.2
Not yet ingested
- Civics
- —
Market trends
- HPI YoY
- ▼ -71.10%
- Current HPI
- 212.8422
- Rent YoY
- ▼ -1.13%
- Metro
- Dallas-Fort Worth-Arlington, TX
- State GDP YoY
- ▲ 3.95%
- F500 in state
- 110
Industry mix (Fortune 500 HQ in TX)
| Industry | F500 HQs | Revenue |
|---|---|---|
| Energy | 16 | $1,198B |
|
||
| Technology | 5 | $198B |
|
||
| Engineering / Construction | 4 | $72B |
|
||
| Energy Services | 3 | $60B |
|
||
| Utilities | 3 | $41B |
|
||
| Healthcare | 2 | $330B |
|
||
Price history
-2.6% since first listed11 events — show timeline
- 2026-05-27 Price Changed $305,000 NTREIS
- 2026-04-27 Listed $315,000 NTREIS
- 2026-04-20 Listing Removed — NTREIS
- 2026-04-17 Listed $315,000 NTREIS
- 2026-04-11 Listing Removed — NTREIS
- 2026-03-04 Price Changed $319,000 NTREIS
- 2026-01-11 Listed $325,000 NTREIS
- 2023-06-29 Sold (MLS) — NTREIS
- 2023-04-18 Pending — NTREIS
- 2023-03-21 Price Changed $318,073 NTREIS
- 2023-01-19 Listed $313,073 NTREIS
Property tax history
+221.9%/yrLatest (2025): $6,584 · -1.5% YoY. Source: county tax records.
Cash-flow waterfall
monthlySold comps — $/sqft
last 12 mo · ≤1 miLoading sold comps…