34065 Shaver Springs Rd · Auberry, CA
Flood risk No data
- FEMA flood zone
- —
- Chance of flooding over 30 yrs
- —
- Est. flood insurance / yr
- —
Fire risk No data
- Est. fire insurance / yr
- —
Heat risk No data
- Hot days now (above threshold)
- —
- Hot days in 30 yrs
- —
Wind risk No data
- Chance of severe wind over 30 yrs
- —
Air-quality risk No data
- Unhealthy air days now
- —
- Unhealthy air days in 30 yrs
- —
Risk factors via First Street. Map © Google.
Why this score? — see what drove the D+ grade
The composite is a weighted blend of 9 inputs, each scored 0–100. Each bar is that input's sub-score; the figure is the points it added to the 100-point composite (weight × sub-score).
- ARV discount +15.0/15.0
- Cash flow +13.4/30.0
- Schools +5.0/10.0
- DSCR +4.0/10.0
- 1% rule +3.6/10.0
- Livability +2.7/5.0
- Rent growth +2.5/5.0
- Condition / age +2.5/5.0
- Appreciation +0.0/10.0
$295,000
🖨 Deal sheet 📄 Offer letter ✓ Due diligence
Listing remarks
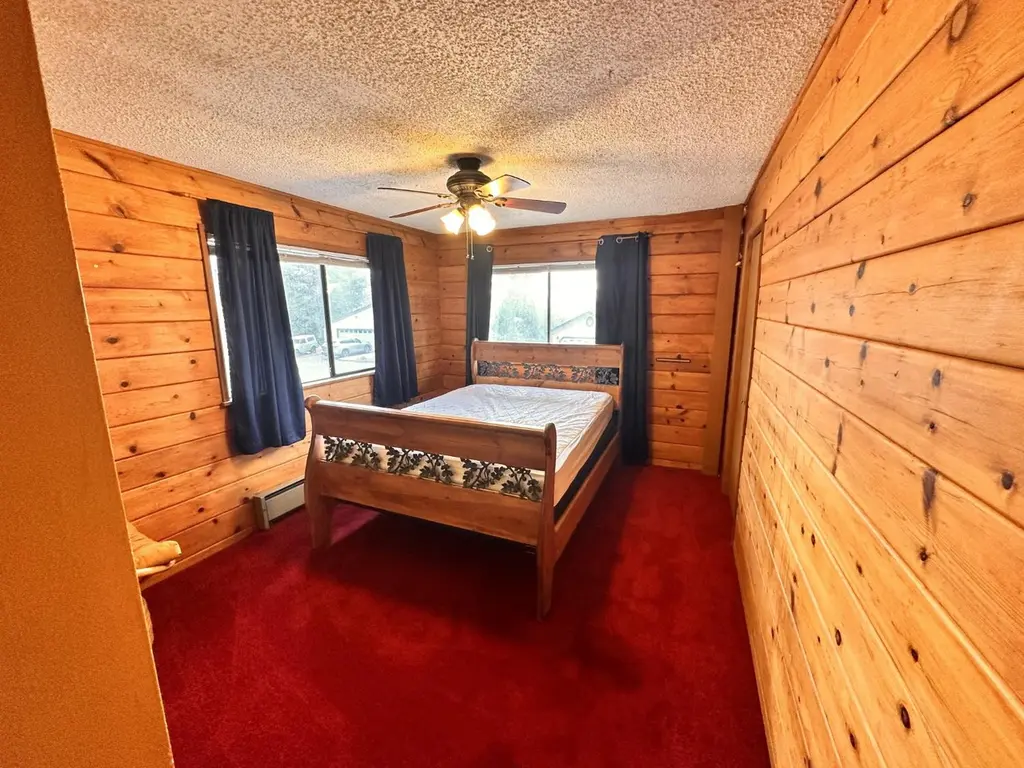
Just 15 minutes from Shaver Lake, 34065 Shaver Springs Road in Auberry offers incredible mountain value. This spacious 4-bedroom, 2.5-bathroom cabin features 1,939 square feet of living space on an 8,000 square foot lot. Move-in ready, the layout includes a bright living area with a fireplace, unique hydronic radiator heating, and upstairs laundry. The functional kitchen and baths are ready for updates, and the wrap-around deck needs repair or replacement, presenting a perfect canvas to build instant equity. Outside, enjoy views of the community pond, huge under-house storage, and highly coveted RV or boat parking. There is no central AC, leaving a great opportunity for mini-splits. Sold as
Key facts
- Rv or boat parking
- Under-house storage
- Wrap-around deck
Tags
Property features AI
Finance
- HOA & community: Association with monthly fee of $50; Community includes a lake/pond
Exterior
- Utilities: Electric service on; Public sewer; Public utilities
- Home design: Two-story single family residence
- Construction: Wood siding; Wood subfloor foundation; Composition roof; No solar
- Exterior features: Mountain-view lot; Lot dimensions approximately 80 x 100
Interior
- Bedrooms: Upper-level laundry (bedrooms not specified)
- Flooring: Carpet; Laminate
- Bathrooms: 2.5 bathrooms
- Heating & cooling: Central heating; Evaporative cooling
- Interior features: Free-standing fireplace; Tub/shower
- Laundry & utility: Laundry inside on upper level with electric dryer hookup
Neighborhood map
What this means for you Summary
Snapshot
- This is a 4-bed/3.0-bath single-family listed at $295k.
Deal economics
- At list price, monthly cash flow is $4 ($46/yr) — positive.
- The deal already cash-flows at list — no discount required.
- To meet the 1% rule (rent ≥ 1% of price), the offer needs to be $253k (14.1% below list).
- Recommended offer: $253k (14.1% below list) — sets the bar for 1% rule.
- Cap rate 6.3% vs local median 2.4% in Auberry — top-decile yield for the area; either an underpriced asset or a hidden risk that comps aren't pricing in. Stress-test before assuming the spread holds.
Location & tenants
- Location reads 53/100 on livability (#982 in CA) — a working-class tenant base; expect higher turnover. Strengths: housing A+, crime B, employment B; Watch: schools D+, amenities F, commute F.
- Market conditions: 58 active listings in the ZIP; 2,426 units permitted in Fresno County in 2024 (296 in 5+ unit buildings).
Forward outlook
- Local home prices are declining (-3.0%/yr); year-one equity from $2k of loan paydown is wiped out by about $9k of value loss. Plan a longer hold.
- Fresno County population projected at +11% by 2050 — modest demand growth; plan on rents tracking national, not racing it.
Negotiation context
- It's been on market 23 days — a 2% lower offer ($291k) is reasonable based on typical stale-listing flexibility.
- 9 sale attempts since 5y ago with the ask held roughly flat each time — persistent listings suggest the price (not the market) is what's stuck; bring a comps-based counter.
Questions for the listing agent
- What does the HOA fee cover, when was the last increase, and are there any pending special assessments or reserve-fund shortfalls?
- Is there a deadline driving the sale (1031 exchange, divorce, estate, relocation)? That informs how much negotiation room exists.
- Schools are D-rated, which usually means shorter tenancies and higher turnover. Who's the typical renter profile here, and what's been the actual vacancy rate?
- The area grade is low — what's the realistic commute time and amenity access for the typical tenant pool here? Any planned neighborhood developments (good or bad) we should know about?
- What's the average days-on-market for RENTAL listings here right now (not sales)? A rising rental-DOM trend means longer vacancies and softer asking-rent achievability than the comps imply.
- What's the recent tenant-quality profile in this submarket — average credit score on applications, eviction rate, late-payment / NSF rate, and stable-employment percentage? A property-management company in the area should have these aggregated.
- How much new for-sale + rental construction is in the pipeline within 1–3 miles? Heavy new supply typically softens prices + rents 12–24 months out; constrained supply supports both.
Investment metrics
- 1% rule
- 0.86% ✗
- Cap rate
- 6.31%
- Cash-on-cash
- 0.06%
- DSCR
- 1.00
- GRM
- 9.7
CMA / ARV
- ARV (on-the-fly)
- $369,595
- Comps found
- 3
Show comp detail 3 sales within ~0.75 mi
| Address | Dist | Beds/Ba | Sqft | Sold | Price | $/sf | Match |
|---|---|---|---|---|---|---|---|
| 33855 Shaver Springs Rd | 0.19mi | 3/1.8 (-1) | 1,899 (-1%) | 3mo | $377,000 | $199 | 77 |
| 34139 Shaver Springs Rd | 0.08mi | 4/2.0 | 1,813 (-5%) | 19mo | $350,000 | $193 | 68 |
| 33815 Shaver Springs Rd | 0.21mi | 3/1.8 (-1) | 1,860 (-3%) | 18mo | $210,000 | $113 | 60 |
Match score weights: distance 35% · size 25% · config 20% · recency 20%. Top-matched comps best support the ARV.
Projected returns pro-forma
-3.0% appreciation · 3.0% rent growth · sell at horizon
- IRR
- -16.2%
- Equity multiple
- 0.42×
- Total profit
- $-47,547
- Equity at exit
- $43,985
- IRR
- -7.9%
- Equity multiple
- 0.50×
- Total profit
- $-41,036
- Equity at exit
- $25,506
Cash invested: $82,600 (down + closing). Projections, not guarantees.
Landlord ↔ Tenant lean methodology
- Overall (STATE)
- 18 Strongly Tenant-Friendly
- State California
- 18 Strongly Tenant-Friendly · D+13
- County
- — inherits STATE
- City
- — inherits STATE
ZIP-level market 93602
- Home prices YoY
- -28.8%
- Active inventory
- 58
- Price-to-rent
- 9.7×
Monthly cashflow live
- Estimated rent
- $2,534 medium interval (Pro) →
- Mortgage (P&I)
- −$1,547
- Tax from tax record
- −$278 /mo · $3,340/yr
- Insurance
- −$123
- HOA
- −$50
- Vacancy / Maint / Mgmt
- −$532
- Net cashflow
- $4
Break-even live
UW: 25.0% down · 7.5% · 30yr · 1.5% tax · 5.0% vac · 8.0% maint · 8.0% mgmt
Financing live
Cash to close
- Down payment
- $73,750
- Closing costs
- $8,850
- Reserves months
- —
- Total cash needed
- —
Loan-product check · same deal, 3 products live
Conventional
25% down · 7.5% · 30yr
- Down + closing
- —
- Monthly P&I
- —
- Monthly cashflow
- —
- DSCR
- —
- Eligible?
- —
Personal DTI + credit; lowest rate.
DSCR
20% down · 8.5% · 30yr
- Down + closing
- —
- Monthly P&I
- —
- Monthly cashflow
- —
- DSCR
- —
- Eligible?
- —
No personal income docs; deal must DSCR.
Hard money
10% down · 12.0% · 12mo
- Down + closing
- —
- Monthly P&I
- —
- Monthly cashflow
- —
- DSCR
- —
- Eligible?
- —
Short-term bridge; refi at stabilization.
HOA detail
- Monthly dues
- $50 · $600/yr
Listing history 41 events
-
2026-06-19days on market $295,000 Active 23 DOM
-
2026-06-18days on market $295,000 Active 22 DOM
-
2026-06-17days on market $295,000 Active 21 DOM
-
2026-06-16days on market $295,000 Active 20 DOM
-
2026-06-15days on market $295,000 Active 19 DOM
-
2026-06-14days on market $295,000 Active 17 DOM
-
2026-06-12days on market $295,000 Active 16 DOM
-
2026-06-09days on market $295,000 Active 13 DOM
-
2026-06-08days on market $295,000 Active 12 DOM
-
2026-06-07days on market $295,000 Active 11 DOM
-
2026-06-04days on market $295,000 Active 7 DOM
-
2026-06-02days on market $295,000 Active 6 DOM
-
2026-06-01days on market $295,000 Active 5 DOM
-
2026-05-31days on market $295,000 Active 4 DOM
-
2026-05-31days on market $295,000 Active 3 DOM
-
2026-05-22$295,000 Active
-
2023-09-09status Active
-
2023-09-09price $335,000
-
2023-09-09historical
-
2023-09-08historical
-
2023-08-22price $375,000
-
2023-08-11price $375,000
-
2023-08-01$390,000 Active
-
2023-07-22$390,000 Active
-
2021-10-22price $279,000
-
2021-10-22$279,000 Active
-
2021-10-22historical
-
2021-10-22status Active
-
2021-09-13soldstatus $290,000 Sold
-
2021-09-13soldstatus $290,000
-
2021-08-04status Pending
-
2021-08-04price $290,000
-
2021-06-07price $279,000
-
2021-06-04status Active
-
2021-05-25status Pending
-
2021-05-14status Active
-
2021-05-10status Backup
-
2021-04-22price $270,000
-
2021-03-17price $299,000
-
2021-03-05$309,000 Active
-
1995-06-01soldstatus $97,500
ⓘ Source: listings_history table (triggers on properties + properties_extension) + one-shot
backfill from property_details.listing_events for pre-trigger history.
Tax reassessment forecast CA · Resets to sale price
- Current annual tax
- $3,340 · $278/mo
- Projected year-2 tax
- $3,340 · $278/mo
- Expected delta
- $0/yr ($0/mo · 0.0%)
ⓘ Screening estimate from a state-policy table — verify with the county assessor before closing.
Nearby sold comps map
Loading sold comps map…
Walkable amenities ~0.75 mi
Loading nearby amenities…
Taxation est. · year 1
- Rental income
- $30,411
- − Mortgage interest
- −$16,525
- − Property taxes
- −$3,340
- − Insurance
- −$1,475
- − Repairs & maintenance
- −$2,433
- − Management
- −$2,433
- − HOA
- −$600
- − Depreciation
- −$8,582
- Taxable loss
- −$4,976
- Est. tax savings @ 24.0%
- +$1,194
- After-tax cash flow
- $1,240/yr
For passive investors: Depreciation is non-cash, so a rental often shows a tax loss while cash-flowing — sheltering income. Rental losses are passive: they offset passive income freely, and up to $25,000/yr can offset ordinary (W-2) income if you actively participate and your MAGI is under $100k (phasing out to $0 by $150k); unused losses carry forward. On sale, claimed depreciation is recaptured at up to 25%, and gains may owe capital-gains tax (a 1031 exchange can defer both). Figures are a year-1 estimate at your 24.0% rate — not tax advice; consult a CPA.
Schools (NCES district)
No district data.
Livability — Auberry
- Score
- 53/100
- State rank
- #982
- US rank
- #24661
Category grades
Schools grade is shown separately in the Schools card above.
Census & demographics
- Census place
- Auberry, CA
- City population
- 3,091
- Population (ZIP)
- 3,091
Population outlook (Fresno County) Hauer SSP2
- Today (2025)
- 1,042,971 people
- By 2030
- 1,072,198 · +2.8%
- By 2040
- 1,122,408 · +7.6%
- By 2050
- 1,157,251 · +11.0%
- By 2075
- 1,182,575 · +13.4%
- By 2100
- 1,105,899 · +6.0%
Race, ethnicity, and origin ACS 2023
- Neighborhood character
- Predominantly White (74%)
- Race & ethnicity
- White 74% Two or more races 12% Hispanic / Latino 10% Native American 9%
- Hispanic origin (detail)
- Mexican 10%
- Common ancestry
- Lithuanian 4% Scotch-Irish 2% Italian 2%
- Foreign-born
- 1% · Canada
- Languages at home
- 95% English-only · Spanish 4% Other Indo-European 1%
Political lean MEDSL · Fresno
- 2024 margin
- Toss-up / Even · D 46.5% · R 50.9% · Other 2.6%
- 2008→2024 swing
- -6.5pp toward R · 2008: 2.1pp · 2024: -4.4pp
- All cycles
- 2024: R+4.4 2020: D+7.8 2016: D+3.9 2012: R+2.9 2008: D+2.1
Not yet ingested
- Civics
- —
Market trends
- HPI YoY
- ▼ -98.97%
- Current HPI
- 244.699
- Rent YoY
- —
- Metro
- —
- State GDP YoY
- ▲ 3.21%
- F500 in state
- 116
Industry mix (Fortune 500 HQ in CA)
| Industry | F500 HQs | Revenue |
|---|---|---|
| Technology | 27 | $1,492B |
|
||
| Financial Services | 3 | $174B |
|
||
| Retail | 3 | $44B |
|
||
| Insurance | 3 | $26B |
|
||
| Media / Entertainment | 2 | $115B |
|
||
| Pharmaceuticals / Biotech | 2 | $62B |
|
||
Price history
+202.6% since first listed26 events — show timeline
- 2026-05-22 Listed $295,000 FRESNOMLS
- 2023-09-09 Relisted — FRESNOMLS
- 2023-09-09 Price Changed $335,000 FRESNOMLS
- 2023-09-09 Listing Removed — CRMLS
- 2023-09-08 Delisted — FRESNOMLS
- 2023-08-22 Price Changed $375,000 FRESNOMLS
- 2023-08-11 Price Changed $375,000 CRMLS
- 2023-08-01 Listed $390,000 CRMLS
- 2023-07-22 Listed $390,000 FRESNOMLS
- 2021-10-22 Price Changed $279,000 FRESNOMLS
- 2021-10-22 Listed $279,000 FRESNOMLS
- 2021-10-22 Delisted — FRESNOMLS
- 2021-10-22 Relisted — FRESNOMLS
- 2021-09-13 Sold (Public Records) $290,000 Public Records
- 2021-09-13 Sold (MLS) $290,000 FRESNOMLS
- 2021-08-04 Pending — FRESNOMLS
- 2021-08-04 Price Changed $290,000 FRESNOMLS
- 2021-06-07 Price Changed $279,000 FRESNOMLS
- 2021-06-04 Relisted — FRESNOMLS
- 2021-05-25 Pending — FRESNOMLS
- 2021-05-14 Relisted — FRESNOMLS
- 2021-05-10 Pending — FRESNOMLS
- 2021-04-22 Price Changed $270,000 FRESNOMLS
- 2021-03-17 Price Changed $299,000 FRESNOMLS
- 2021-03-05 Listed $309,000 FRESNOMLS
- 1995-06-01 Sold (Public Records) $97,500 Public Records
Property tax history
+8.5%/yrLatest (2025): $3,340 · +6.3% YoY. Source: county tax records.
Cash-flow waterfall
monthlySold comps — $/sqft
last 12 mo · ≤1 miLoading sold comps…