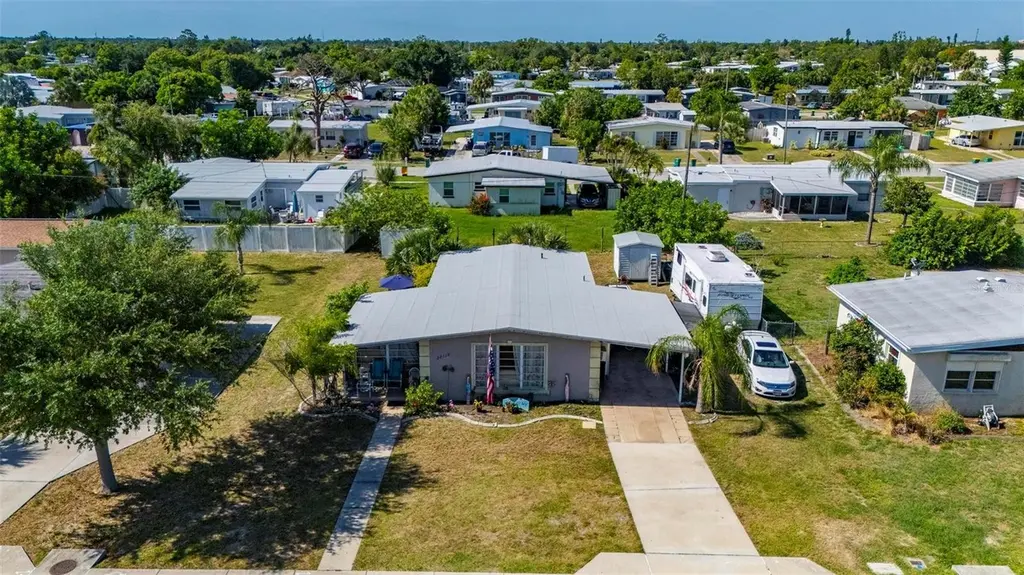
22115 Midway Blvd · Port Charlotte, FL
Flood risk 6/10 · Moderate
- FEMA flood zone
- X (shaded)
- Chance of flooding over 30 yrs
- 0.57%
- Est. flood insurance / yr
- $507 – $1,088
Fire risk 1/10 · Minimal
- Est. fire insurance / yr
- $947 – $1,759
Heat risk 10/10 · Severe
- Hot days now (above 107°F)
- 7 days/yr
- Hot days in 30 yrs
- 28 days/yr
Wind risk 10/10 · Severe
- Chance of severe wind over 30 yrs
- 99.0%
Air-quality risk 3/10 · Minor
- Unhealthy air days now
- 2 days/yr
- Unhealthy air days in 30 yrs
- 2 days/yr
Risk factors via First Street. Map © Google.
Why this score? — see what drove the B- grade
The composite is a weighted blend of 9 inputs, each scored 0–100. Each bar is that input's sub-score; the figure is the points it added to the 100-point composite (weight × sub-score).
- Cash flow +26.4/30.0
- ARV discount +15.0/15.0
- DSCR +9.0/10.0
- 1% rule +6.1/10.0
- Schools +4.6/10.0
- Livability +3.2/5.0
- Condition / age +2.5/5.0
- Rent growth +2.2/5.0
- Appreciation +0.0/10.0
$130,000
🖨 Deal sheet 📄 Offer letter ✓ Due diligence
Listing remarks MLS
This adorable 2 bedroom 1.5 bath 1 car port home is located right in the middle of town! It has lots of natural lighting and hard flooring through the whole house! The kitchen has a large pantry. The laundry hookup is inside the home. The full bath has a walk in shower. This house is perfect for a first time home buyer, or snow bird, or someone looking to downsize. At this price it will not last long, so see it today!
Key facts
- Covered carport
- Large pantry
- Walk-in shower
Tags
Property features AI
Finance
- Other: Living area approximately 897 square feet; Total rooms: 5; Property zoned RSF3.5; Furnished: Negotiable; Direction to property: 41 South to Midway, turn left; home is on the right
Exterior
- Parking: Carport; 3 carport spaces
- Utilities: Public water; Public sewer; Broadband/high-speed internet available; Cable available and connected; Electricity available and connected
- Home design: Single family residence; Residential property; Fixer condition; Faces north; One story / One level; Homestead exempt
- Construction: Block and stucco construction; Other roof type; Slab foundation; Built on a 0.17-acre lot
- Exterior features: Enclosed patio; Side porch; Exterior lighting; Asphalt road access; Lot dimensions 75 x 100
Interior
- Kitchen: Dishwasher; Microwave; Range; Refrigerator; Electric water heater
- Bedrooms: 2 bedrooms
- Flooring: Vinyl
- Bathrooms: 1 full bath; 1 half bath
- Heating & cooling: Electric heating; Wall/window air conditioning units
- Interior features: Thermostat; Blinds
- Laundry & utility: Washer; Dryer; Laundry inside
Neighborhood map
What this means for you Summary
Snapshot
- This is a 2-bed/1.0-bath single-family listed at $130k.
Deal economics
- At list price, monthly cash flow is $339 ($4k/yr) — positive.
- The deal already cash-flows at list — no discount required.
- Meets the 1% rule at list price ($1k rent vs $130k).
- Cap rate 9.4% vs local median 4.4% in Port Charlotte — top-decile yield for the area; either an underpriced asset or a hidden risk that comps aren't pricing in. Stress-test before assuming the spread holds.
Location & tenants
- Location reads 65/100 on livability (#655 in FL) — a middle-class / working-renter tenant base. Strengths: cost of living A+, housing A+; Watch: employment D, amenities F, commute F.
- Charlotte (suburban): math 54% / reading 54% proficiency, ranked #22 of 73 in FL (top 30%) — acceptable for families but not a draw, mixed tenant base, ~2y average lease.
- Zoned schools: Neil Armstrong Elementary School (math 66% / reading 63%, grade B, #525 of 2,144 statewide, top 26%, 780 students, 63% FRL); Charlotte High School (math 44% / reading 46%, grade D-, #228 of 667 statewide, top 35%, 1,994 students, 41% FRL) — zoned schools at 52% FRL track the district average.
- Market conditions: Rents soft (-1.4%/yr); 707 active listings in the ZIP; 24 comparable units currently listed for rent nearby; rentals at typical pace (median 21d on market — plan ~3-4 weeks tenant-placement turnaround); 4,585 units permitted in Charlotte County in 2024 (703 in 5+ unit buildings).
Forward outlook
- Local home prices are declining (-3.0%/yr); year-one equity from $899 of loan paydown is wiped out by about $4k of value loss. Plan a longer hold.
- Charlotte County population projected at +24% by 2050 — long-run rental-demand tailwind backs the buy-and-hold thesis.
Negotiation context
- Only 4 days on market — expect competitive offers; lowballing is unlikely to land.
- 7 sale attempts since 20y ago with the ask held roughly flat each time — persistent listings suggest the price (not the market) is what's stuck; bring a comps-based counter.
- Current owner paid $45k; list at $130k implies a 189% gain — meaningful room to come down on a strong offer.
Risks & watch-outs
- Climate carrying-cost: major flood risk; severe wind risk, 99% chance of damaging wind over 30y; extreme-heat days projected 7→28/yr by 2055 (HVAC capex compounding) — expect insurance premiums to compound above CPI over the hold.
Questions for the listing agent
- Built in 1961 — when were the roof, HVAC, electrical panel, plumbing, and water heater last replaced?
- Is there a deadline driving the sale (1031 exchange, divorce, estate, relocation)? That informs how much negotiation room exists.
- Schools are D-rated, which usually means shorter tenancies and higher turnover. Who's the typical renter profile here, and what's been the actual vacancy rate?
- What's the average days-on-market for RENTAL listings here right now (not sales)? A rising rental-DOM trend means longer vacancies and softer asking-rent achievability than the comps imply.
- What's the recent tenant-quality profile in this submarket — average credit score on applications, eviction rate, late-payment / NSF rate, and stable-employment percentage? A property-management company in the area should have these aggregated.
- How much new for-sale + rental construction is in the pipeline within 1–3 miles? Heavy new supply typically softens prices + rents 12–24 months out; constrained supply supports both.
Investment metrics
- 1% rule
- 1.11% ✓
- Cap rate
- 9.42%
- Cash-on-cash
- 11.16%
- DSCR
- 1.50
- GRM
- 7.5
CMA / ARV
- ARV (on-the-fly)
- $185,679
- Comps found
- 12
Show comp detail 12 sales within ~0.75 mi
| Address | Dist | Beds/Ba | Sqft | Sold | Price | $/sf | Match |
|---|---|---|---|---|---|---|---|
| 22243 Lasalle Rd | 0.24mi | 2/1.0 | 880 (-2%) | 1mo | $152,267 | $173 | 85 |
| 22163 Lasalle Rd | 0.11mi | 2/1.0 | 938 (+5%) | 7mo | $124,000 | $132 | 82 |
| 22131 Belinda Ave | 0.35mi | 2/1.0 | 901 (+0%) | 9mo | $125,000 | $139 | 75 |
| 22326 Cadet Ln | 0.59mi | 2/2.0 | 890 (-1%) | 1mo | $197,000 | $221 | 67 |
| 2401 Starlite Ln | 0.46mi | 2/1.0 | 840 (-6%) | 10mo | $182,000 | $217 | 60 |
| 21914 Cellini Ave | 0.46mi | 3/1.0 (+1) | 952 (+6%) | 5mo | $197,500 | $207 | 59 |
| 2271 Hariet St | 0.31mi | 2/1.0 | 988 (+10%) | 14mo | $225,000 | $228 | 56 |
| 22209 Beverly Ave | 0.39mi | 2/1.0 | 823 (-8%) | 15mo | $160,000 | $194 | 56 |
| 21475 Gibralter Dr | 0.44mi | 2/1.0 | 1,017 (+13%) | 10mo | $93,000 | $91 | 49 |
| 21379 Gladis Ave | 0.54mi | 2/1.0 | 812 (-10%) | 15mo | $199,000 | $245 | 47 |
| 21403 Glendale Ave | 0.48mi | 3/1.0 (+1) | 1,009 (+12%) | 11mo | $252,500 | $250 | 43 |
| 21476 Augusta Ave | 0.70mi | 2/1.0 | 768 (-14%) | 10mo | $152,000 | $198 | 35 |
Match score weights: distance 35% · size 25% · config 20% · recency 20%. Top-matched comps best support the ARV.
Projected returns pro-forma
-3.0% appreciation · 0.0% rent growth · sell at horizon
- IRR
- -2.8%
- Equity multiple
- 0.90×
- Total profit
- $-3,777
- Equity at exit
- $19,383
- IRR
- 3.4%
- Equity multiple
- 1.22×
- Total profit
- $7,937
- Equity at exit
- $11,240
Cash invested: $36,400 (down + closing). Projections, not guarantees.
Landlord ↔ Tenant lean methodology
- Overall (STATE)
- 87 Strongly Landlord-Friendly
- State Florida
- 87 Strongly Landlord-Friendly · R+3
- County
- — inherits STATE
- City
- — inherits STATE
ZIP-level market 33952
- Home prices YoY
- -4.8%
- Rents YoY
- -1.4%
- Active inventory
- 707
- Price-to-rent
- 7.5×
Monthly cashflow live
- Estimated rent
- $1,448 high interval (Pro) →
- Mortgage (P&I)
- −$682
- Tax from tax record
- −$70 /mo · $837/yr
- Insurance
- −$54
- HOA
- −$0
- Vacancy / Maint / Mgmt
- −$304
- Net cashflow
- $339
Break-even live
UW: 25.0% down · 7.5% · 30yr · 1.5% tax · 5.0% vac · 8.0% maint · 8.0% mgmt
Financing live
Cash to close
- Down payment
- $32,500
- Closing costs
- $3,900
- Reserves months
- —
- Total cash needed
- —
Loan-product check · same deal, 3 products live
Conventional
25% down · 7.5% · 30yr
- Down + closing
- —
- Monthly P&I
- —
- Monthly cashflow
- —
- DSCR
- —
- Eligible?
- —
Personal DTI + credit; lowest rate.
DSCR
20% down · 8.5% · 30yr
- Down + closing
- —
- Monthly P&I
- —
- Monthly cashflow
- —
- DSCR
- —
- Eligible?
- —
No personal income docs; deal must DSCR.
Hard money
10% down · 12.0% · 12mo
- Down + closing
- —
- Monthly P&I
- —
- Monthly cashflow
- —
- DSCR
- —
- Eligible?
- —
Short-term bridge; refi at stabilization.
Rent comps 24 comps
| Address | Beds | Baths | Sqft | Rent | $/sqft | DOM | Units | Dist |
|---|---|---|---|---|---|---|---|---|
| 22070 Gatewood Ave Port Charlotte, FL | 2.0 | 1.0 | 812 | $1,350 | $1.66 | 13d | 1 | 0.09mi |
| 22203 Lasalle Rd Port Charlotte, FL | 2.0 | 1.0 | 874 | $1,325 | $1.52 | 21d | 1 | 0.18mi |
| 21499 Glendale Ave Port Charlotte, FL | 3.0 | 1.0 | 1077 | $1,600 | $1.49 | 21d | 1 | 0.30mi |
| 22086 Beverly Ave Port Charlotte, FL | 2.0 | 1.0 | 1031 | $1,250 | $1.21 | 21d | 1 | 0.45mi |
| 1636 Hayworth Rd Port Charlotte, FL | 2.0 | 2.0 | 884 | $1,300 | $1.47 | 21d | 1 | 0.54mi |
| 21322 Stillwater Ave Port Charlotte, FL | 2.0 | 1.0 | 1080 | $1,300 | $1.20 | 21d | 1 | 0.73mi |
| 21280 Brinson Ave Port Charlotte, FL | 1.0 | 1.0 | 650 | $1,000 | $1.54 | 21d | 1 | 0.91mi |
| 21440 Mallory Ave Port Charlotte, FL | 2.0 | 1.0 | 930 | $1,550 | $1.67 | 21d | 1 | 0.93mi |
| 21155 Meehan Ave Port Charlotte, FL | 3.0 | 1.0 | 1060 | $1,300 | $1.23 | 21d | 1 | 0.93mi |
| 3108 Whiting Ln Port Charlotte, FL | 2.0 | 1.0 | 828 | $1,350 | $1.63 | 21d | 1 | 0.97mi |
| 21405 Olean Blvd Port Charlotte, FL | 1.0–2.0 | 1.0–2.0 | 708 | $1,445 | $2.04 | 21d | 2 | 0.98mi |
| 21150 Gertrude Ave Unit F-6 Port Charlotte, FL | 1.0 | 1.0 | 550 | $1,150 | $2.09 | 21d | 1 | 0.99mi |
| 21405 Olean Blvd #511 Port Charlotte, FL | 1.0 | 1.0 | 634 | $1,445 | $2.28 | 13d | 1 | 1.00mi |
| 2300 Aaron St #114 Port Charlotte, FL | 2.0 | 2.0 | 869 | $1,250 | $1.44 | 21d | 1 | 1.01mi |
| 3100 Harbor Blvd Port Charlotte, FL | 2.0 | 1.0–1.5 | 994 | $1,472 | $1.48 | 21d | 2 | 1.08mi |
| 3126 Harbor Blvd Unit 3A Port Charlotte, FL | 2.0 | 2.0 | 1100 | $1,500 | $1.36 | 13d | 1 | 1.10mi |
| 21061 Midway Blvd Port Charlotte, FL | 2.0 | 1.0 | 897 | $1,600 | $1.78 | 21d | 1 | 1.11mi |
| 2425 Caring Way Unit 205 Port Charlotte, FL | 2.0 | 2.0 | 900 | $1,400 | $1.56 | 21d | 1 | 1.14mi |
| 21026 Glendale Ave Port Charlotte, FL | 2.0 | 1.0 | 812 | $1,400 | $1.72 | 21d | 1 | 1.16mi |
| 2456 Elkcam Blvd Port Charlotte, FL | 2.0 | 2.0 | 1015 | $1,700 | $1.67 | 21d | 1 | 1.17mi |
| 3006 Caring Way Port Charlotte, FL | 2.0 | 2.0 | 783 | $2,050 | $2.62 | 13d | 2 | 1.20mi |
| 3006 Caring Way Port Charlotte, FL | 1.0–2.0 | 1.0–2.0 | 708 | $2,500 | $3.53 | 21d | 3 | 1.20mi |
| 2472 Picnic St Port Charlotte, FL | 2.0 | 2.0 | 990 | $1,575 | $1.59 | 21d | 1 | 1.36mi |
| 3460 Normandy Dr Port Charlotte, FL | 2.0 | 1.0 | 695 | $1,490 | $2.14 | 21d | 1 | 1.45mi |
Listing history 5 events
-
2026-06-16status $130,000 Pending 4 DOM
-
2026-06-16days on market $130,000 Active 4 DOM
-
2026-06-15days on market $130,000 Active 3 DOM
-
2026-06-13remarks 699-char remark
-
2026-06-13$130,000 Active 1 DOM
ⓘ Source: listings_history table (triggers on properties + properties_extension) + one-shot
backfill from property_details.listing_events for pre-trigger history.
Tax reassessment forecast FL · Resets to sale price
- Current annual tax
- $837 · $70/mo
- Projected year-2 tax
- $1,079 · $90/mo
- Expected delta
- +$242/yr (+$20/mo · 28.9%)
ⓘ Screening estimate from a state-policy table — verify with the county assessor before closing.
Climate risk First Street
- Flood 6/10 Major FEMA zone X (shaded) · 57% chance over 30 yrs
- Wildfire 1/10 Low
- Heat 10/10 Extreme 7 d/yr ≥107°F today · 28 d/yr by 30 yrs out
- Wind 10/10 Extreme 99% chance of damaging wind over 30 yrs
- Air quality 3/10 Moderate 2 unhealthy d/yr today · 2 by 30 yrs out
Nearby sold comps map
Loading sold comps map…
Walkable amenities ~0.75 mi
Loading nearby amenities…
Taxation est. · year 1
- Rental income
- $17,382
- − Mortgage interest
- −$7,282
- − Property taxes
- −$837
- − Insurance
- −$650
- − Repairs & maintenance
- −$1,391
- − Management
- −$1,391
- − Depreciation
- −$3,782
- Taxable income
- $2,050
- Est. tax owed @ 24.0%
- −$492
- After-tax cash flow
- $3,572/yr
For passive investors: Depreciation is non-cash, so a rental often shows a tax loss while cash-flowing — sheltering income. Rental losses are passive: they offset passive income freely, and up to $25,000/yr can offset ordinary (W-2) income if you actively participate and your MAGI is under $100k (phasing out to $0 by $150k); unused losses carry forward. On sale, claimed depreciation is recaptured at up to 25%, and gains may owe capital-gains tax (a 1031 exchange can defer both). Figures are a year-1 estimate at your 24.0% rate — not tax advice; consult a CPA.
Schools (NCES district)
- District
- Charlotte
- NCES district ID
- 1200240
- Math proficiency
- 54% ▼ -6.00%
- Reading proficiency
- 54% ▼ -1.00%
- Median HH income
- $44,864
- Composite
- 45.62/100
- National rank
- #2586
- State rank
- #22 of 73 in FL
Livability — Port Charlotte
- Score
- 65/100
- State rank
- #655
- US rank
- #13081
Category grades
Schools grade is shown separately in the Schools card above.
Census & demographics
- Census place
- Port Charlotte, FL
- County
- Charlotte County · 196,994 people
- City population
- 102,180
- Metro
- Punta Gorda, FL
- Population (ZIP)
- 35,231
- Household income
- $61,382
- Rent vs Own
- Severe rent burden
- 733.0
Population outlook (Charlotte County) Hauer SSP2
- Today (2025)
- 198,646 people
- By 2030
- 210,507 · +6.0%
- By 2040
- 230,857 · +16.2%
- By 2050
- 247,148 · +24.4%
- By 2075
- 281,777 · +41.8%
- By 2100
- 293,609 · +47.8%
Race, ethnicity, and origin ACS 2023
- Neighborhood character
- Predominantly White (76%)
- Race & ethnicity
- White 76% Hispanic / Latino 14% Two or more races 8% Black 6% Asian 2%
- Hispanic origin (detail)
- Mexican 2% Puerto Rican 3% Cuban 2%
- Common ancestry
- Lithuanian 2% Romanian 2% Italian 2%
- Foreign-born
- 12% · Canada, Vietnam
- Languages at home
- 85% English-only · Spanish 10% French/Haitian/Cajun 1% Russian/Polish/Slavic 1%
Political lean MEDSL · Charlotte
- 2024 margin
- Solid R (+34.0) · D 32.7% · R 66.7%
- 2008→2024 swing
- -26.7pp toward R · 2008: -7.2pp · 2024: -34.0pp
- All cycles
- 2024: R+34.0 2020: R+26.6 2016: R+27.8 2012: R+14.3 2008: R+7.2
Not yet ingested
- Civics
- —
Market trends
- HPI YoY
- ▼ -17.18%
- Current HPI
- 339.0932
- Rent YoY
- ▼ -1.35%
- Metro
- Punta Gorda, FL
- State GDP YoY
- ▲ 3.28%
- F500 in state
- 36
Industry mix (Fortune 500 HQ in FL)
| Industry | F500 HQs | Revenue |
|---|---|---|
| Industrial Technology | 2 | $29B |
|
||
| Insurance | 2 | $17B |
|
||
| Retail | 1 | $60B |
|
||
| Technology Distribution | 1 | $58B |
|
||
| Homebuilding | 1 | $35B |
|
||
| Technology Manufacturing | 1 | $35B |
|
||
Price history
+271.4% since first listed15 events — show timeline
- 2026-06-12 Listed $130,000 Stellar MLS as Distributed by MLS Grid
- 2018-08-16 Sold (Public Records) $45,000 Public Records
- 2018-08-13 Sold (MLS) $90,000 Stellar MLS as Distributed by MLS Grid
- 2018-07-02 Pending — Stellar MLS as Distributed by MLS Grid
- 2018-06-26 Listed $90,000 Stellar MLS as Distributed by MLS Grid
- 2008-05-09 Listing Removed — Stellar MLS as Distributed by MLS Grid
- 2008-05-09 Listed $49,000 Stellar MLS as Distributed by MLS Grid
- 2007-06-26 Listed $79,000 Stellar MLS as Distributed by MLS Grid
- 2007-06-23 Listed $58,900 Stellar MLS as Distributed by MLS Grid
- 2006-08-07 Listing Removed — Stellar MLS as Distributed by MLS Grid
- 2006-07-23 Listing Removed — Stellar MLS as Distributed by MLS Grid
- 2006-07-16 Listed $149,900 Stellar MLS as Distributed by MLS Grid
- 2006-07-16 Listed $149,900 Stellar MLS as Distributed by MLS Grid
- 2004-10-14 Sold (Public Records) $106,000 Public Records
- 1994-07-27 Sold (Public Records) $35,000 Public Records
Property tax history
-0.4%/yrLatest (2025): $837 · +2.4% YoY. Source: county tax records.
Cash-flow waterfall
monthlySold comps — $/sqft
last 12 mo · ≤1 miLoading sold comps…