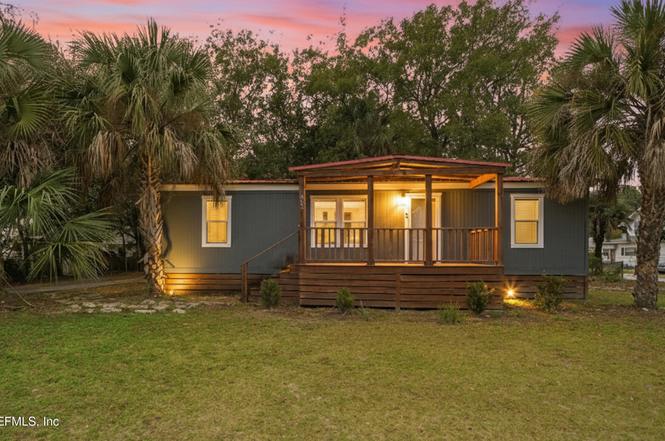
402 W 19th St · Jacksonville, FL
Flood risk 1/10 · Minimal
- FEMA flood zone
- X (unshaded)
- Chance of flooding over 30 yrs
- 0.0%
- Est. flood insurance / yr
- $507 – $1,088
Fire risk 1/10 · Minimal
- Est. fire insurance / yr
- $947 – $1,759
Heat risk 9/10 · Severe
- Hot days now (above 107°F)
- 7 days/yr
- Hot days in 30 yrs
- 20 days/yr
Wind risk 9/10 · Severe
- Chance of severe wind over 30 yrs
- 99.0%
Air-quality risk 4/10 · Minor
- Unhealthy air days now
- 6 days/yr
- Unhealthy air days in 30 yrs
- 6 days/yr
Risk factors via First Street. Map © Google.
Why this score? — see what drove the C- grade
The composite is a weighted blend of 9 inputs, each scored 0–100. Each bar is that input's sub-score; the figure is the points it added to the 100-point composite (weight × sub-score).
- Cash flow +20.7/30.0
- ARV discount +7.5/15.0
- DSCR +6.6/10.0
- 1% rule +5.3/10.0
- Livability +4.2/5.0
- Schools +3.9/10.0
- Rent growth +2.7/5.0
- Condition / age +2.5/5.0
- Appreciation +0.0/10.0
$120,000
🖨 Deal sheet 📄 Offer letter ✓ Due diligence
Listing remarks
PRICED TO SELL. CASH ONLY. Looking for a smart investment opportunity? This property checks all the boxes. 402 W 19th Street sits on a corner lot in a prime location with strong potential for both long term and short term rental use. This home does need some TLC, but it can be used as an income-producing investment right away. Currently operating as an Airbnb, it averages 15+ booked days per month. Located near Downtown Jacksonville, you're just minutes from the Fairgrounds, TIAA Bank Field, and all the dining, events, and growth happening in Springfield. All information pertaining to the property is deemed reliable, but not guaranteed. Information to be verified by the Buyer. Be advised th
Key facts
- Corner lot
- 4,791 sq ft lot
- Built 1989
Tags
Property features AI
Finance
- HOA & community: Not a senior community
Exterior
- Parking: Off-street parking; On-street parking
- Utilities: Public sewer; Electricity connected; Sewer connected; Water connected
- Home design: Double wide manufactured home; Single-story
- Construction: Wood siding; Metal roof
- Exterior features: Deck; Porch; Chain link fence; Paved road access
Interior
- Kitchen: Dishwasher; Electric range; Microwave; Refrigerator
- Bedrooms: 3 bedrooms
- Flooring: Vinyl
- Bathrooms: 2 full bathrooms
- Heating & cooling: Electric heating; Central air conditioning
- Interior features: Breakfast bar; Ceiling fan(s); Pantry; Primary bathroom with shower (no tub)
- Laundry & utility: Washer and dryer included; In-unit laundry; Washer hookup; Electric dryer hookup; Electric water heater
Neighborhood map
What this means for you Summary
Snapshot
- This is a 3-bed/2.0-bath manufactured listed at $120k.
Deal economics
- At list price, monthly cash flow is $162 ($2k/yr) — positive.
- The deal already cash-flows at list — no discount required.
- Meets the 1% rule at list price ($1k rent vs $120k).
- Recommended offer: $106k (12.0% below list) — sets the bar for market timing.
- Cap rate 7.9% vs local median 4.0% in Jacksonville — top-decile yield for the area; either an underpriced asset or a hidden risk that comps aren't pricing in. Stress-test before assuming the spread holds.
Location & tenants
- Location reads 83/100 on livability (#50 in FL, #911 nationally) — a professional / high-income tenant draw. Strengths: amenities A+, commute A+, housing A+.
- Duval (urban): math 46% / reading 45% proficiency, ranked #48 of 73 in FL (top 66%) — families likely to look elsewhere, expect single-tenant / working-renter base with shorter leases.
- Market conditions: Rents flat; 194 active listings in the ZIP; 40 comparable units currently listed for rent nearby; rentals at typical pace (median 24d on market — plan ~3-4 weeks tenant-placement turnaround); lower-income renter base — watch delinquency; 6,503 units permitted in Duval County in 2024 (1,131 in 5+ unit buildings).
- This rent runs 38% of the median local income ($39k/yr) — at the standard rent-burdened threshold; future hikes will face affordability resistance.
Forward outlook
- Local home prices are declining (-3.0%/yr); year-one equity from $830 of loan paydown is wiped out by about $4k of value loss. Plan a longer hold.
- Duval County population projected at +19% by 2050 — long-run rental-demand tailwind backs the buy-and-hold thesis.
Negotiation context
- It's been on market 140 days — a 12% lower offer ($106k) is reasonable based on typical stale-listing flexibility.
- 10 sale attempts since 20y ago; this cycle's ask has dropped $45k (27%) from the opening price — seller is motivated, your offer sets the floor, not the list.
- Current owner paid $98k; 22% above their basis — modest negotiation headroom, anchor on the comps not their cost.
Risks & watch-outs
- Climate carrying-cost: severe wind risk, 99% chance of damaging wind over 30y; extreme-heat days projected 7→20/yr by 2055 (HVAC capex compounding) — expect insurance premiums to compound above CPI over the hold.
Questions for the listing agent
- It's been on market 140 days. Have you received any prior offers? Is the seller open to a 12% concession, seller financing, or rate buy-down credit?
- Why hasn't it sold? Are there any deal-killer items the seller is aware of (foundation, flood, title, zoning, code violations)?
- Is there a deadline driving the sale (1031 exchange, divorce, estate, relocation)? That informs how much negotiation room exists.
- Schools are B-rated — typically a magnet for longer-tenancy family renters. What's the average tenant stay here, and is there a school-zone premium baked into asking?
- What's the average days-on-market for RENTAL listings here right now (not sales)? A rising rental-DOM trend means longer vacancies and softer asking-rent achievability than the comps imply.
- What's the recent tenant-quality profile in this submarket — average credit score on applications, eviction rate, late-payment / NSF rate, and stable-employment percentage? A property-management company in the area should have these aggregated.
- How much new for-sale + rental construction is in the pipeline within 1–3 miles? Heavy new supply typically softens prices + rents 12–24 months out; constrained supply supports both.
Investment metrics
- 1% rule
- 1.03% ✓
- Cap rate
- 7.91%
- Cash-on-cash
- 5.77%
- DSCR
- 1.26
- GRM
- 8.1
CMA / ARV
No comps found within radius.
Projected returns pro-forma
-3.0% appreciation · 0.94% rent growth · sell at horizon
- IRR
- -9.7%
- Equity multiple
- 0.65×
- Total profit
- $-11,659
- Equity at exit
- $17,892
- IRR
- -3.3%
- Equity multiple
- 0.80×
- Total profit
- $-6,761
- Equity at exit
- $10,375
Cash invested: $33,600 (down + closing). Projections, not guarantees.
Landlord ↔ Tenant lean methodology
- Overall (STATE)
- 87 Strongly Landlord-Friendly
- State Florida
- 87 Strongly Landlord-Friendly · R+3
- County
- — inherits STATE
- City
- — inherits STATE
ZIP-level market 32206
- Home prices YoY
- -23.7%
- Rents YoY
- 0.9%
- Active inventory
- 194
- Price-to-rent
- 8.1×
Monthly cashflow live
- Estimated rent
- $1,238 high interval (Pro) →
- Mortgage (P&I)
- −$629
- Tax from tax record
- −$137 /mo · $1,648/yr
- Insurance
- −$50
- HOA
- −$0
- Vacancy / Maint / Mgmt
- −$260
- Net cashflow
- $162
Break-even live
UW: 25.0% down · 7.5% · 30yr · 1.5% tax · 5.0% vac · 8.0% maint · 8.0% mgmt
Financing live
Cash to close
- Down payment
- $30,000
- Closing costs
- $3,600
- Reserves months
- —
- Total cash needed
- —
Loan-product check · same deal, 3 products live
Conventional
25% down · 7.5% · 30yr
- Down + closing
- —
- Monthly P&I
- —
- Monthly cashflow
- —
- DSCR
- —
- Eligible?
- —
Personal DTI + credit; lowest rate.
DSCR
20% down · 8.5% · 30yr
- Down + closing
- —
- Monthly P&I
- —
- Monthly cashflow
- —
- DSCR
- —
- Eligible?
- —
No personal income docs; deal must DSCR.
Hard money
10% down · 12.0% · 12mo
- Down + closing
- —
- Monthly P&I
- —
- Monthly cashflow
- —
- DSCR
- —
- Eligible?
- —
Short-term bridge; refi at stabilization.
Rent comps 40 comps
| Address | Beds | Baths | Sqft | Rent | $/sqft | DOM | Units | Dist |
|---|---|---|---|---|---|---|---|---|
| 519 W 19th St Jacksonville, FL | 2.0 | 2.0 | 1071 | $1,095 | $1.02 | 21d | 1 | 0.12mi |
| 519 W 19th St Jacksonville, FL | 2.0 | 2.0 | 1071 | $1,075 | $1.00 | 4d | 1 | 0.12mi |
| 519 W 19th St Unit a Jacksonville, FL | 2.0 | 1.5 | 1071 | $1,095 | $1.02 | 21d | 1 | 0.12mi |
| 519 W 19th St Unit a Jacksonville, FL | 2.0 | 1.5 | 1071 | $1,075 | $1.00 | 13d | 1 | 0.12mi |
| 503 W 16th St Jacksonville, FL | 4.0 | 1.5 | 1216 | $1,420 | $1.17 | 23d | 1 | 0.13mi |
| 522 W 21st St Jacksonville, FL | 3.0 | 2.0 | 1045 | $1,350 | $1.29 | 23d | 1 | 0.17mi |
| 2906 Silver St Unit 01 Jacksonville, FL | 2.0 | 1.0 | 840 | $895 | $1.07 | 23d | 1 | 0.18mi |
| 610 W 18th St Unit 2 Jacksonville, FL | 2.0 | 1.0 | 750 | $825 | $1.10 | 2d | 1 | 0.19mi |
| 610 W 18th St Unit 1 Jacksonville, FL | 2.0 | 1.0 | 750 | $825 | $1.10 | 23d | 1 | 0.19mi |
| 347 W 23rd St Jacksonville, FL | 3.0 | 1.5 | 1176 | $1,112 | $0.95 | 7d | 1 | 0.26mi |
| 204 W 23rd St Jacksonville, FL | 3.0 | 1.0 | 960 | $1,225 | $1.28 | 1d | 1 | 0.28mi |
| 3020 N Laura St Jacksonville, FL | 3.0 | 1.0 | 1162 | $1,300 | $1.12 | 23d | 1 | 0.28mi |
| 134 W 23rd St Jacksonville, FL | 2.0 | 1.0 | 768 | $1,050 | $1.37 | 23d | 1 | 0.31mi |
| 2817 Mars Ave Jacksonville, FL | 2.0 | 1.0 | 945 | $975 | $1.03 | 21d | 1 | 0.33mi |
| 528 W 25th St Jacksonville, FL | 2.0 | 1.0 | 944 | $1,100 | $1.17 | 23d | 1 | 0.33mi |
| 2811 Venus St Jacksonville, FL | 2.0 | 1.0 | 830 | $1,087 | $1.31 | 4d | 1 | 0.37mi |
| 34 W 23rd St Jacksonville, FL | 3.0 | 1.5 | 962 | $1,400 | $1.46 | 23d | 1 | 0.38mi |
| 231 W 10th St Jacksonville, FL | 3.0 | 1.0 | 1200 | $1,500 | $1.25 | 23d | 1 | 0.44mi |
| 2063 N Laura St Jacksonville, FL | 2.0 | 1.0 | 900 | $1,250 | $1.39 | 23d | 1 | 0.46mi |
| 2040 N Laura St Jacksonville, FL | 2.0 | 1.5 | 1300 | $1,498 | $1.15 | 23d | 1 | 0.47mi |
| 3730 Lehigh St Unit 3730 Jacksonville, FL | 2.0 | 1.0 | 850 | $900 | $1.06 | 14d | 1 | 0.49mi |
| 3732 Lehigh St Jacksonville, FL | 2.0 | 1.0 | 850 | $900 | $1.06 | 14d | 1 | 0.49mi |
| 2025 N Laura St Jacksonville, FL | 2.0 | 1.0 | 1000 | $1,195 | $1.20 | 4d | 1 | 0.50mi |
| 154 W 28th St Jacksonville, FL | 2.0 | 2.0 | 818 | $1,138 | $1.39 | 17d | 1 | 0.50mi |
| 118 W 28th St Jacksonville, FL | 3.0 | 2.0 | 1332 | $1,250 | $0.94 | 23d | 1 | 0.52mi |
| 2314 Teal St Jacksonville, FL | 2.0 | 1.0 | 750 | $1,150 | $1.53 | 23d | 1 | 0.52mi |
| 3728 Silver St Jacksonville, FL | 2.0 | 1.0 | 916 | $1,100 | $1.20 | 23d | 1 | 0.53mi |
| 916 W 25th St Jacksonville, FL | 2.0 | 1.0 | 816 | $1,025 | $1.26 | 17d | 1 | 0.56mi |
| 3927 Notter Ave Jacksonville, FL | 2.0 | 1.0 | 738 | $850 | $1.15 | 13d | 1 | 0.60mi |
| 3927 Notter Ave Jacksonville, FL | 2.0 | 1.0 | 738 | $850 | $1.15 | 21d | 1 | 0.60mi |
| 1018 W 23rd St Jacksonville, FL | 3.0 | 2.5 | 1161 | $1,600 | $1.38 | 23d | 1 | 0.60mi |
| 2313 Janette St Jacksonville, FL | 4.0 | 2.0 | 1148 | $1,349 | $1.18 | 16d | 1 | 0.62mi |
| 326 Basswood St Jacksonville, FL | 3.0 | 2.0 | 1317 | $1,550 | $1.18 | 23d | 1 | 0.62mi |
| 3914 Springfield Blvd Jacksonville, FL | 2.0 | 1.0 | 858 | $1,050 | $1.22 | 4d | 1 | 0.63mi |
| 3914 Springfield Blvd Jacksonville, FL | 2.0 | 1.0 | 858 | $1,050 | $1.22 | 23d | 1 | 0.63mi |
| 2324 Moncrief Rd Unit 2324 Jacksonville, FL | 2.0 | 1.0 | 900 | $900 | $1.00 | 23d | 1 | 0.68mi |
| 318 E 19th St Jacksonville, FL | 2.0 | 1.0 | 1096 | $895 | $0.82 | 23d | 1 | 0.68mi |
| 2532 Moncrief Rd Jacksonville, FL | 2.0 | 1.0 | 700 | $900 | $1.29 | 23d | 1 | 0.70mi |
| 1031 W 26th St Jacksonville, FL | 3.0 | 2.0 | 1261 | $1,445 | $1.15 | 23d | 1 | 0.70mi |
| 55 E 9th St Jacksonville, FL | 3.0 | 1.5 | 1246 | $1,675 | $1.34 | 14d | 1 | 0.71mi |
Listing history 44 events
-
2026-06-18days on market $120,000 Active 140 DOM
-
2026-06-17days on market $120,000 Active 139 DOM
-
2026-06-16days on market $120,000 Active 138 DOM
-
2026-06-15days on market $120,000 Active 137 DOM
-
2026-06-10days on market $120,000 Active 131 DOM
-
2026-06-08days on market $120,000 Active 130 DOM
-
2026-06-07days on market $120,000 Active 129 DOM
-
2026-06-03days on market $120,000 Active 125 DOM
-
2026-06-02days on market $120,000 Active 124 DOM
-
2026-06-01days on market $120,000 Active 123 DOM
-
2026-05-31days on market $120,000 Active 122 DOM
-
2026-04-08price $120,000
-
2026-02-20status Active
-
2026-02-20price $125,000
-
2026-02-16historical Active Under Contract
-
2026-02-12price $150,000
-
2026-01-29$165,000 Active
-
2024-06-14historical
-
2024-03-14$135,000 Active
-
2024-03-06historical
-
2024-02-29status Active
-
2024-02-01status Pending
-
2023-12-09status Active
-
2023-12-07status Pending
-
2023-11-19price $137,000
-
2023-10-16price $142,000
-
2023-10-02price $145,000
-
2023-09-15price $150,000
-
2023-09-06$160,000 Active
-
2023-08-26historical
-
2023-08-26$160,000 Active
-
2023-08-15historical
-
2023-06-07price $165,000
-
2023-05-19price $170,000
-
2023-04-07$175,000 Active
-
2022-12-22soldstatus $98,000
-
2020-08-31soldstatus $10,500 Sold
-
2020-07-03status Pending
-
2020-05-23price $15,995
-
2020-05-01$19,999 Active
-
2008-08-02historical
-
2006-11-03$44,900
-
1987-11-01soldstatus $32,000
-
1986-11-06soldstatus $24,000
ⓘ Source: listings_history table (triggers on properties + properties_extension) + one-shot
backfill from property_details.listing_events for pre-trigger history.
Tax reassessment forecast FL · Resets to sale price
- Current annual tax
- $1,648 · $137/mo
- Projected year-2 tax
- $1,648 · $137/mo
- Expected delta
- $0/yr ($0/mo · 0.0%)
ⓘ Screening estimate from a state-policy table — verify with the county assessor before closing.
Climate risk First Street
- Flood 1/10 Low FEMA zone X (unshaded) · 0% chance over 30 yrs
- Wildfire 1/10 Low
- Heat 9/10 Extreme 7 d/yr ≥107°F today · 20 d/yr by 30 yrs out
- Wind 9/10 Extreme 99% chance of damaging wind over 30 yrs
- Air quality 4/10 Moderate 6 unhealthy d/yr today · 6 by 30 yrs out
Nearby sold comps map
Loading sold comps map…
Walkable amenities ~0.75 mi
Loading nearby amenities…
Taxation est. · year 1
- Rental income
- $14,859
- − Mortgage interest
- −$6,722
- − Property taxes
- −$1,648
- − Insurance
- −$600
- − Repairs & maintenance
- −$1,189
- − Management
- −$1,189
- − Depreciation
- −$3,491
- Taxable income
- $20
- Est. tax owed @ 24.0%
- −$5
- After-tax cash flow
- $1,934/yr
For passive investors: Depreciation is non-cash, so a rental often shows a tax loss while cash-flowing — sheltering income. Rental losses are passive: they offset passive income freely, and up to $25,000/yr can offset ordinary (W-2) income if you actively participate and your MAGI is under $100k (phasing out to $0 by $150k); unused losses carry forward. On sale, claimed depreciation is recaptured at up to 25%, and gains may owe capital-gains tax (a 1031 exchange can defer both). Figures are a year-1 estimate at your 24.0% rate — not tax advice; consult a CPA.
Schools (NCES district)
- District
- Duval
- NCES district ID
- 1200480
- Math proficiency
- 46% ▼ -11.00%
- Reading proficiency
- 45% ▼ -4.00%
- Median HH income
- $48,987
- Composite
- 38.97/100
- National rank
- #4076
- State rank
- #48 of 73 in FL
Livability — Jacksonville
- Score
- 83/100
- State rank
- #50
- US rank
- #911
Category grades
Schools grade is shown separately in the Schools card above.
Census & demographics
- Census place
- Jacksonville, FL
- County
- Duval County · 1,015,274 people
- City population
- 979,034
- Metro
- Jacksonville, FL
- Population (ZIP)
- 17,105
- Household income
- $39,242
- Rent vs Own
- Severe rent burden
- 1057.0
Population outlook (Duval County) Hauer SSP2
- Today (2025)
- 1,013,010 people
- By 2030
- 1,059,228 · +4.6%
- By 2040
- 1,141,439 · +12.7%
- By 2050
- 1,205,258 · +19.0%
- By 2075
- 1,324,282 · +30.7%
- By 2100
- 1,319,620 · +30.3%
Race, ethnicity, and origin ACS 2023
- Neighborhood character
- Predominantly Black (65%)
- Race & ethnicity
- Black 65% White 22% Two or more races 8% Hispanic / Latino 6%
- Hispanic origin (detail)
- Mexican 1% Puerto Rican 2%
- Common ancestry
- Italian 2% Romanian 1% Slovak 1%
- Foreign-born
- 5% · Canada
- Languages at home
- 93% English-only · Spanish 3% Arabic 1% German/W. Germanic 1%
Political lean MEDSL · Duval
- 2024 margin
- Toss-up / Even · D 48.7% · R 50.1% · Other 1.2%
- 2008→2024 swing
- +0.4pp no change · 2008: -1.9pp · 2024: -1.5pp
- All cycles
- 2024: R+1.5 2020: D+3.8 2016: R+1.5 2012: R+3.6 2008: R+1.9
Not yet ingested
- Civics
- —
Market trends
- HPI YoY
- ▼ -64.55%
- Current HPI
- 208.1852
- Rent YoY
- ▲ 0.94%
- Metro
- Jacksonville, FL
- State GDP YoY
- ▲ 3.28%
- F500 in state
- 36
Industry mix (Fortune 500 HQ in FL)
| Industry | F500 HQs | Revenue |
|---|---|---|
| Industrial Technology | 2 | $29B |
|
||
| Insurance | 2 | $17B |
|
||
| Retail | 1 | $60B |
|
||
| Technology Distribution | 1 | $58B |
|
||
| Homebuilding | 1 | $35B |
|
||
| Technology Manufacturing | 1 | $35B |
|
||
Price history
+400.0% since first listed33 events — show timeline
- 2026-04-08 Price Changed $120,000 realMLS
- 2026-02-20 Relisted — realMLS
- 2026-02-20 Price Changed $125,000 realMLS
- 2026-02-16 Contingent — realMLS
- 2026-02-12 Price Changed $150,000 realMLS
- 2026-01-29 Listed $165,000 realMLS
- 2024-06-14 Listing Removed — Stellar MLS as Distributed by MLS Grid
- 2024-03-14 Listed $135,000 Stellar MLS as Distributed by MLS Grid
- 2024-03-06 Listing Removed — Stellar MLS as Distributed by MLS Grid
- 2024-02-29 Relisted — Stellar MLS as Distributed by MLS Grid
- 2024-02-01 Pending — Stellar MLS as Distributed by MLS Grid
- 2023-12-09 Relisted — Stellar MLS as Distributed by MLS Grid
- 2023-12-07 Pending — Stellar MLS as Distributed by MLS Grid
- 2023-11-19 Price Changed $137,000 Stellar MLS as Distributed by MLS Grid
- 2023-10-16 Price Changed $142,000 Stellar MLS as Distributed by MLS Grid
- 2023-10-02 Price Changed $145,000 Stellar MLS as Distributed by MLS Grid
- 2023-09-15 Price Changed $150,000 Stellar MLS as Distributed by MLS Grid
- 2023-09-06 Listed $160,000 Stellar MLS as Distributed by MLS Grid
- 2023-08-26 Listed $160,000 realMLS
- 2023-08-26 Listing Removed — realMLS
- 2023-08-15 Listing Removed — realMLS
- 2023-06-07 Price Changed $165,000 realMLS
- 2023-05-19 Price Changed $170,000 realMLS
- 2023-04-07 Listed $175,000 realMLS
- 2022-12-22 Sold (Public Records) $98,000 Public Records
- 2020-08-31 Sold (MLS) $10,500 realMLS
- 2020-07-03 Pending — realMLS
- 2020-05-23 Price Changed $15,995 realMLS
- 2020-05-01 Listed $19,999 realMLS
- 2008-08-02 Listing Removed — realMLS
- 2006-11-03 Listed $44,900 realMLS
- 1987-11-01 Sold (Public Records) $32,000 Public Records
- 1986-11-06 Sold (Public Records) $24,000 Public Records
Property tax history
+78.8%/yrLatest (2025): $1,648 · +21.4% YoY. Source: county tax records.
Cash-flow waterfall
monthlySold comps — $/sqft
last 12 mo · ≤1 miLoading sold comps…