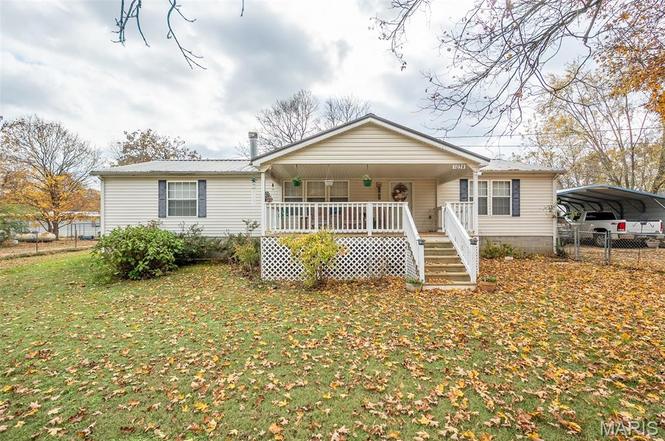
1034 Wayne 372 · Piedmont, MO
Flood risk No data
- FEMA flood zone
- —
- Chance of flooding over 30 yrs
- —
- Est. flood insurance / yr
- —
Fire risk No data
- Est. fire insurance / yr
- —
Heat risk No data
- Hot days now (above threshold)
- —
- Hot days in 30 yrs
- —
Wind risk No data
- Chance of severe wind over 30 yrs
- —
Air-quality risk No data
- Unhealthy air days now
- —
- Unhealthy air days in 30 yrs
- —
Risk factors via First Street. Map © Google.
Why this score? — see what drove the D grade
The composite is a weighted blend of 9 inputs, each scored 0–100. Each bar is that input's sub-score; the figure is the points it added to the 100-point composite (weight × sub-score).
- Cash flow +10.5/30.0
- Appreciation +7.9/10.0
- ARV discount +7.5/15.0
- DSCR +3.0/10.0
- Schools +2.7/10.0
- Livability +2.6/5.0
- Rent growth +2.5/5.0
- Condition / age +2.5/5.0
- 1% rule +1.8/10.0
$164,900
🖨 Deal sheet (PDF) 📄 Offer letter ✓ Due diligence
Listing remarks
Enjoy peaceful country living in this well maintained 3-bedroom, 2-bathroom manufactured home offering 1,512 sq. ft. of comfortable living space. The inviting living room features a cozy wood burning fireplace. Step outside to a private, fenced backyard complete with a chicken coop and shed--ideal for hobby farming or outdoor projects! Sitting on 3.75 acres +/- surrounded by nature, open skies, this property offers privacy and charm of rural living. Sit on your covered deck and enjoy the quiet living!
Key facts
- Covered deck
- Shed
- 3.75 acres
Tags
Property features AI
Exterior
- Parking: Carport with 2 spaces
- Utilities: Well water; Septic tank sewer; 220 volt electrical service; Cable available
- Home design: Manufactured home; One level
- Construction: Vinyl siding exterior; Metal roof
- Exterior features: Chain link fencing; Shed(s); Front yard; Few trees
Interior
- Kitchen: Dishwasher; Oven; Electric range; Refrigerator
- Bedrooms: 3 bedrooms (all on the main level)
- Bathrooms: 2 full bathrooms (both on the main level)
- Heating & cooling: Electric heating; Central air conditioning
- Interior features: Wood burning stove fireplace; Dishwasher; Oven; Electric range; Refrigerator; Electric water heater
- Laundry & utility: Electric water heater
Neighborhood map
What this means for you Summary
Snapshot
- This is a 3-bed/2.0-bath other listed at $165k.
Deal economics
- At list price, monthly cash flow is $-85 ($-1k/yr) — negative.
- To cash-flow at today's rent, offer at most $150k (9.1% below list).
- To meet the 1% rule (rent ≥ 1% of price), the offer needs to be $112k (32.3% below list).
- Recommended offer: $112k (32.3% below list) — sets the bar for 1% rule.
- Cap rate 5.7% vs local median 4.3% in Piedmont — top-decile yield for the area; either an underpriced asset or a hidden risk that comps aren't pricing in. Stress-test before assuming the spread holds.
Location & tenants
- Location reads 52/100 on livability (#854 in MO) — a working-class tenant base; expect higher turnover. Strengths: cost of living A+, housing A+; Watch: crime F, amenities F, commute F.
- Clearwater R-I (rural): math 33% / reading 33% proficiency, ranked #255 of 324 in MO (top 79%) — families likely to look elsewhere, expect single-tenant / working-renter base with shorter leases; 62% free/reduced lunch — lower-income household profile, screen leases tightly.
- Zoned schools: Clearwater Elementary (math 42% / reading 32%, grade F, #611 of 1,115 statewide, top 59%, 414 students, 72% FRL); Clearwater Middle (math 26% / reading 27%, grade F, #313 of 391 statewide, top 81%, 263 students, 66% FRL); Clearwater High (math 34% / reading 57%, grade D-, #174 of 521 statewide, top 33%, 239 students, 55% FRL) — zoned schools at 64% FRL track the district average.
- Market conditions: 70 active listings in the ZIP.
Forward outlook
- In year one you build about $11k of equity ($1k loan paydown + $10k appreciation (5.9% local appreciation)).
- Wayne County population projected to shrink 9% by 2050 — rents likely to lag national; underwrite the cash flow, not the appreciation.
- By year 4, paydown + projected appreciation supports a ~$37k cash-out refi (75% LTV) — recoverable capital for the next deal without selling this one.
Negotiation context
- It's been on market 170 days — a 12% lower offer ($145k) is reasonable based on typical stale-listing flexibility.
- 2 sale attempts; this cycle's ask has dropped $10k (6%) from the opening price — seller is motivated, your offer sets the floor, not the list.
Questions for the listing agent
- What do current leases actually rent for vs. the listed asking? Can we see a recent rent roll and the last 12 months of T-12 income?
- It's been on market 170 days. Have you received any prior offers? Is the seller open to a 32% concession, seller financing, or rate buy-down credit?
- Why hasn't it sold? Are there any deal-killer items the seller is aware of (foundation, flood, title, zoning, code violations)?
- Is there a deadline driving the sale (1031 exchange, divorce, estate, relocation)? That informs how much negotiation room exists.
- Schools are F-rated, which usually means shorter tenancies and higher turnover. Who's the typical renter profile here, and what's been the actual vacancy rate?
- Crime grade is F in this area — have there been break-ins, vandalism, or insurance claims at this property in the last 3 years? What carrier currently insures it and at what premium?
- The area grade is low — what's the realistic commute time and amenity access for the typical tenant pool here? Any planned neighborhood developments (good or bad) we should know about?
- What's the average days-on-market for RENTAL listings here right now (not sales)? A rising rental-DOM trend means longer vacancies and softer asking-rent achievability than the comps imply.
- What's the recent tenant-quality profile in this submarket — average credit score on applications, eviction rate, late-payment / NSF rate, and stable-employment percentage? A property-management company in the area should have these aggregated.
- How much new for-sale + rental construction is in the pipeline within 1–3 miles? Heavy new supply typically softens prices + rents 12–24 months out; constrained supply supports both.
Investment metrics
- 1% rule
- 0.68% ✗
- Cap rate
- 5.68%
- Cash-on-cash
- -2.21%
- DSCR
- 0.90
- GRM
- 12.3
CMA / ARV
No comps found within radius.
Projected returns pro-forma
5.89% appreciation · 3.0% rent growth · sell at horizon
- IRR
- 13.3%
- Equity multiple
- 1.89×
- Total profit
- $41,077
- Equity at exit
- $102,557
- IRR
- 13.8%
- Equity multiple
- 3.71×
- Total profit
- $125,157
- Equity at exit
- $185,036
Cash invested: $46,172 (down + closing). Projections, not guarantees.
Landlord ↔ Tenant lean methodology
- Overall (STATE)
- 81 Strongly Landlord-Friendly
- State Missouri
- 81 Strongly Landlord-Friendly · R+10
- County
- — inherits STATE
- City
- — inherits STATE
ZIP-level market 63957
- Home prices YoY
- 3.7%
- Active inventory
- 70
- Price-to-rent
- 12.3×
Monthly cashflow live
- Estimated rent
- $1,117 medium interval (Pro) →
- Mortgage (P&I)
- −$865
- Tax from tax record
- −$34 /mo · $406/yr
- Insurance
- −$69
- HOA
- −$0
- Vacancy / Maint / Mgmt
- −$235
- Net cashflow
- $-85
Break-even live
Sensitivity live
| Price | -10% $8 | -5% $-38 | +0% $-85 | +5% $-132 | +10% $-178 |
|---|---|---|---|---|---|
| Rent | -10% $-173 | -5% $-129 | +0% $-85 | +5% $-41 | +10% $3 |
| Rate | -1.0pp $-2 | -0.5pp $-43 | base $-85 | +0.5pp $-128 | +1.0pp $-171 |
UW: 25.0% down · 7.5% · 30yr · 1.5% tax · 5.0% vac · 8.0% maint · 8.0% mgmt
Financing live
Cash to close
- Down payment
- $41,225
- Closing costs
- $4,947
- Reserves months
- —
- Total cash needed
- —
Loan-product check · same deal, 3 products live
Conventional
25% down · 7.5% · 30yr
- Down + closing
- —
- Monthly P&I
- —
- Monthly cashflow
- —
- DSCR
- —
- Eligible?
- —
Personal DTI + credit; lowest rate.
DSCR
20% down · 8.5% · 30yr
- Down + closing
- —
- Monthly P&I
- —
- Monthly cashflow
- —
- DSCR
- —
- Eligible?
- —
No personal income docs; deal must DSCR.
Hard money
10% down · 12.0% · 12mo
- Down + closing
- —
- Monthly P&I
- —
- Monthly cashflow
- —
- DSCR
- —
- Eligible?
- —
Short-term bridge; refi at stabilization.
Listing history 2 events
-
2026-06-13remarks 506-char remark
-
2026-06-13$164,900 Pending 170 DOM
ⓘ Source: listings_history table (triggers on properties + properties_extension) + one-shot
backfill from property_details.listing_events for pre-trigger history.
Tax reassessment forecast MO · Resets to sale price
- Current annual tax
- $406 · $34/mo
- Projected year-2 tax
- $1,600 · $133/mo
- Expected delta
- +$1,194/yr (+$99/mo · 294.0%)
ⓘ Screening estimate from a state-policy table — verify with the county assessor before closing.
Nearby sold comps map
Loading sold comps map…
Walkable amenities ~0.75 mi
Loading nearby amenities…
Taxation est. · year 1
- Rental income
- $13,404
- − Mortgage interest
- −$9,237
- − Property taxes
- −$406
- − Insurance
- −$824
- − Repairs & maintenance
- −$1,072
- − Management
- −$1,072
- − Depreciation
- −$4,797
- Taxable loss
- −$4,005
- Est. tax savings @ 24.0%
- +$961
- After-tax cash flow
- $-57/yr
For passive investors: Depreciation is non-cash, so a rental often shows a tax loss while cash-flowing — sheltering income. Rental losses are passive: they offset passive income freely, and up to $25,000/yr can offset ordinary (W-2) income if you actively participate and your MAGI is under $100k (phasing out to $0 by $150k); unused losses carry forward. On sale, claimed depreciation is recaptured at up to 25%, and gains may owe capital-gains tax (a 1031 exchange can defer both). Figures are a year-1 estimate at your 24.0% rate — not tax advice; consult a CPA.
Schools (NCES district)
- District
- Clearwater R-I
- NCES district ID
- 2909750
- Math proficiency
- 33% ▲ 1.00%
- Reading proficiency
- 33% ▼ -6.00%
- Median HH income
- $31,119
- Composite
- 26.89/100
- National rank
- #7095
- State rank
- #255 of 324 in MO
Livability — Piedmont
- Score
- 52/100
- State rank
- #854
- US rank
- #24925
Category grades
Schools grade is shown separately in the Schools card above.
Census & demographics
- Population (ZIP)
- 5,068
Population outlook (Wayne County) Hauer SSP2
- Today (2025)
- 13,005 people
- By 2030
- 12,767 · -1.8%
- By 2040
- 12,319 · -5.3%
- By 2050
- 11,828 · -9.1%
- By 2075
- 10,806 · -16.9%
- By 2100
- 9,610 · -26.1%
Race, ethnicity, and origin ACS 2023
- Neighborhood character
- Predominantly White (96%)
- Race & ethnicity
- White 96% Two or more races 3%
- Common ancestry
- Italian 2% Slovak 2% Lithuanian 1%
- Foreign-born
- 0%
Political lean MEDSL · Wayne
- 2024 margin
- Solid R (+72.6) · D 13.4% · R 86.0%
- 2008→2024 swing
- -47.6pp toward R · 2008: -25.0pp · 2024: -72.6pp
- All cycles
- 2024: R+72.6 2020: R+70.5 2016: R+64.4 2012: R+34.6 2008: R+25.0
Not yet ingested
- Civics
- —
Market trends
- HPI YoY
- ▲ 5.89%
- Current HPI
- 165.6832
- Rent YoY
- —
- Metro
- —
- State GDP YoY
- ▲ 1.84%
- F500 in state
- 20
Industry mix (Fortune 500 HQ in MO)
| Industry | F500 HQs | Revenue |
|---|---|---|
| Healthcare | 1 | $163B |
|
||
| Insurance | 1 | $21B |
|
||
| Industrial Technology | 1 | $17B |
|
||
| Retail | 1 | $16B |
|
||
| Industrial Distribution | 1 | $10B |
|
||
| Utilities | 1 | $9B |
|
||
Price history
-5.8% since first listed6 events — show timeline
- 2026-05-18 Pending — MARIS as Distributed by MLS Grid
- 2026-04-02 Relisted — MARIS as Distributed by MLS Grid
- 2026-03-17 Pending — MARIS as Distributed by MLS Grid
- 2026-01-16 Price Changed $164,900 MARIS as Distributed by MLS Grid
- 2025-12-04 Price Changed $169,900 MARIS as Distributed by MLS Grid
- 2025-11-13 Listed $175,000 MARIS as Distributed by MLS Grid
Property tax history
+0.7%/yrLatest (2025): $406 · +0.7% YoY. Source: county tax records.
Cash-flow waterfall
monthlySold comps — $/sqft
last 12 mo · ≤1 miLoading sold comps…