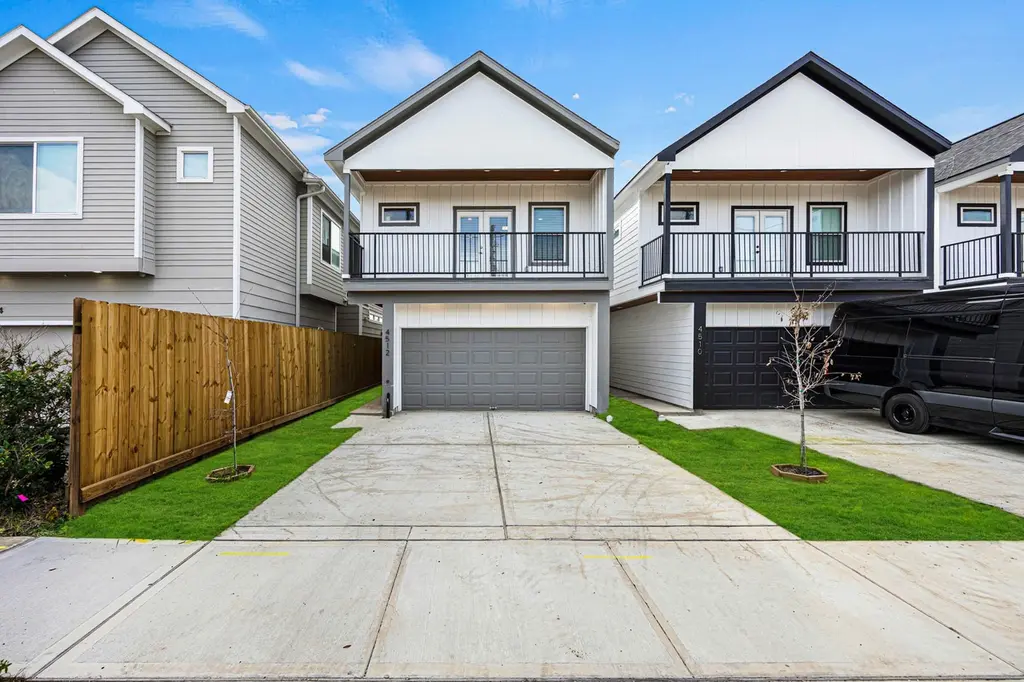
4512 Noble St · Houston, TX
Flood risk 4/10 · Minor
- FEMA flood zone
- X (unshaded)
- Chance of flooding over 30 yrs
- 0.22%
- Est. flood insurance / yr
- $507 – $1,088
Fire risk 1/10 · Minimal
- Est. fire insurance / yr
- $1,222 – $2,270
Heat risk 9/10 · Severe
- Hot days now (above 109°F)
- 7 days/yr
- Hot days in 30 yrs
- 23 days/yr
Wind risk 9/10 · Severe
- Chance of severe wind over 30 yrs
- 99.0%
Air-quality risk 3/10 · Minor
- Unhealthy air days now
- 2 days/yr
- Unhealthy air days in 30 yrs
- 3 days/yr
Risk factors via First Street. Map © Google.
Why this score? — see what drove the D grade
The composite is a weighted blend of 9 inputs, each scored 0–100. Each bar is that input's sub-score; the figure is the points it added to the 100-point composite (weight × sub-score).
- Appreciation +10.0/10.0
- ARV discount +9.4/15.0
- Cash flow +5.7/30.0
- Condition / age +4.8/5.0
- Livability +3.7/5.0
- Rent growth +3.6/5.0
- Schools +2.7/10.0
- 1% rule +1.6/10.0
- DSCR +0.1/10.0
$330,000
🖨 Deal sheet (PDF) 📄 Offer letter ✓ Due diligence
Listing remarks MLS
Uncover the epitome of modern living at this newly constructed gem in the historic Fifth Ward! This 2-story home boats contemporary architecture, convenient first-floor living, an open inviting layout & high-end finishes throughout. A light-filled haven awaits in the spacious living area w/ soaring ceilings; perfect for entertaining. At the heart of this abode, the gourmet kitchen showcases luxurious quartz counters, an expansive island, chic Samsung appliances & glossy lacquer cabinetry. Tranquility abounds in the primary suite flaunting a quaint balcony & a spa-like bath w/ a dual sink vanity, oversized walk-in closet soaking tub & glass enclosed shower. The private backyard w/ lush landscaping offers an idyllic setting to take in the open air or dine alfresco. Find abundant parking w/ a 2-car garage & double-wide driveway. Reside minutes away from Boyce Dorian Park, Discovery Green, Lynos Avenue, Downtown, East River & more!
Key facts
- Spa-like bath
- Private backyard
- First-floor living
Tags
Neighborhood map
What this means for you Summary
Snapshot
- This is a 3-bed/2.5-bath single-family listed at $330k. Condition is rated excellent.
Deal economics
- At list price, monthly cash flow is $-668 ($-8k/yr) — negative.
- To cash-flow at today's rent, offer at most $212k (35.8% below list).
- To meet the 1% rule (rent ≥ 1% of price), the offer needs to be $219k (33.6% below list).
- Recommended offer: $212k (35.8% below list) — sets the bar for cash-flow.
- Cap rate 3.9% vs local median 3.2% in Houston — meaningfully above typical; check what's discounted (condition, days-on-market, listing class) to confirm the premium yield is real.
Location & tenants
- Location reads 74/100 on livability (#184 in TX, #4,771 nationally) — a middle-class / working-renter tenant base. Strengths: amenities A+, cost of living A+, housing A+; Watch: crime F.
- Houston ISD (urban): math 27% / reading 35% proficiency, ranked #593 of 826 in TX (top 72%) — families likely to look elsewhere, expect single-tenant / working-renter base with shorter leases; 71% free/reduced lunch — lower-income household profile, screen leases tightly.
- Zoned schools: Atherton El (math 8% / reading 22%, grade F, #4,021 of 4,322 statewide, top 94%, 433 students, 96% FRL); Fleming Middle (math 10% / reading 15%, grade F, #1,616 of 1,662 statewide, top 97%, 384 students, 97% FRL); Wheatley H S (math 17% / reading 19%, grade F, #1,445 of 1,632 statewide, top 89%, 643 students, 95% FRL) — zoned schools average 96% FRL vs 71% district-wide (25 pts higher); higher-poverty schools than district average — tighter screening recommended.
- Zoned-school proficiency averages 15% at this address vs 31% district-wide (-16 pts) — the specific schools serving this property underperform the Houston ISD average; the district grade overstates school quality for this exact location.
- Market conditions: Rents rising fast (+4.3%/yr); 339 active listings in the ZIP; 24 comparable units currently listed for rent nearby; rentals lingering (median 46d on market — plan ~5-8 weeks vacancy on turnover, expect pricing pressure); 62% of comp listings sitting > 30 days — soft ceiling on asking rent; 29,883 units permitted in Harris County in 2024 (8,621 in 5+ unit buildings).
- At $2,191/mo this rent would consume 52% of the median local household income ($50k/yr) (locally 969% of renters already pay >50% of income on rent) — very limited rent-growth headroom before tenants either downsize or default.
Forward outlook
- In year one you build about $35k of equity ($2k loan paydown + $33k appreciation (10.0% local appreciation)).
- Harris County population projected at +47% by 2050 — long-run rental-demand tailwind backs the buy-and-hold thesis.
- By year 2, paydown + projected appreciation supports a ~$57k cash-out refi (75% LTV) — recoverable capital for the next deal without selling this one.
Negotiation context
- It's been on market 85 days — a 6% lower offer ($310k) is reasonable based on typical stale-listing flexibility.
- 5 sale attempts since 3y ago; this cycle's ask is 13100% above the opening price — seller raised mid-cycle; expect resistance to lowballs.
Risks & watch-outs
- Climate carrying-cost: severe wind risk, 99% chance of damaging wind over 30y; extreme-heat days projected 7→23/yr by 2055 (HVAC capex compounding) — expect insurance premiums to compound above CPI over the hold.
Questions for the listing agent
- What do current leases actually rent for vs. the listed asking? Can we see a recent rent roll and the last 12 months of T-12 income?
- It's been on market 85 days. Have you received any prior offers? Is the seller open to a 36% concession, seller financing, or rate buy-down credit?
- Why hasn't it sold? Are there any deal-killer items the seller is aware of (foundation, flood, title, zoning, code violations)?
- Is there a deadline driving the sale (1031 exchange, divorce, estate, relocation)? That informs how much negotiation room exists.
- Schools are D-rated, which usually means shorter tenancies and higher turnover. Who's the typical renter profile here, and what's been the actual vacancy rate?
- Crime grade is F in this area — have there been break-ins, vandalism, or insurance claims at this property in the last 3 years? What carrier currently insures it and at what premium?
- The area grade is low — what's the realistic commute time and amenity access for the typical tenant pool here? Any planned neighborhood developments (good or bad) we should know about?
- What's the average days-on-market for RENTAL listings here right now (not sales)? A rising rental-DOM trend means longer vacancies and softer asking-rent achievability than the comps imply.
- What's the recent tenant-quality profile in this submarket — average credit score on applications, eviction rate, late-payment / NSF rate, and stable-employment percentage? A property-management company in the area should have these aggregated.
- How much new for-sale + rental construction is in the pipeline within 1–3 miles? Heavy new supply typically softens prices + rents 12–24 months out; constrained supply supports both.
Investment metrics
- 1% rule
- 0.66% ✗
- Cap rate
- 3.86%
- Cash-on-cash
- -8.68%
- DSCR
- 0.61
- GRM
- 12.5
CMA / ARV
- ARV (median comp)
- $344,665
- List price
- $330,000
- Delta
- -4.25%
- Verdict
- FAIR
- Comps
- 20 within 1.0 mi
Show comp detail 12 sales within ~0.75 mi
| Address | Dist | Beds/Ba | Sqft | Sold | Price | $/sf | Match |
|---|---|---|---|---|---|---|---|
| 2302 Wipprecht St | 0.17mi | 3/2.5 | 1,636 (+1%) | 6mo | $299,000 | $183 | 85 |
| 2207 Dan St | 0.06mi | 3/2.5 | 1,736 (+7%) | 5mo | $339,000 | $195 | 80 |
| 4809 Nichols St | 0.19mi | 3/2.5 | 1,581 (-2%) | 9mo | $285,000 | $180 | 80 |
| 2303 Wipprecht St | 0.15mi | 3/2.5 | 1,764 (+9%) | 2mo | $329,000 | $187 | 76 |
| 4703 Oats St Unit B | 0.16mi | 3/3.0 | 1,768 (+9%) | 6mo | $359,000 | $203 | 70 |
| 2013 Schweikhardt St | 0.08mi | 3/2.5 | 1,806 (+12%) | 8mo | $304,999 | $169 | 70 |
| 2105 Sam Wilson St Unit A | 0.59mi | 3/3.5 | 1,611 (-0%) | 9mo | $270,000 | $168 | 60 |
| 4404 Bond St | 0.63mi | 3/2.5 | 1,529 (-5%) | 3mo | $295,000 | $193 | 59 |
| 1907 Harlem St Unit A | 0.46mi | 2/2.5 (-1) | 1,700 (+5%) | 9mo | $307,000 | $181 | 58 |
| 3107 Amboy St | 0.64mi | 3/2.0 | 1,503 (-7%) | 6mo | $280,000 | $186 | 52 |
| 4611 Buck St | 0.69mi | 3/1.0 | 1,541 (-5%) | 8mo | $205,000 | $133 | 48 |
| 1811 Pannell St Unit C | 0.52mi | 2/2.0 (-1) | 1,381 (-15%) | 7mo | $275,000 | $199 | 39 |
Match score weights: distance 35% · size 25% · config 20% · recency 20%. Top-matched comps best support the ARV.
Projected returns pro-forma
10.0% appreciation · 4.27% rent growth · sell at horizon
- IRR
- 18.5%
- Equity multiple
- 2.52×
- Total profit
- $140,114
- Equity at exit
- $297,290
- IRR
- 17.5%
- Equity multiple
- 5.90×
- Total profit
- $452,348
- Equity at exit
- $641,117
Cash invested: $92,400 (down + closing). Projections, not guarantees.
Landlord ↔ Tenant lean methodology
- Overall (STATE)
- 87 Strongly Landlord-Friendly
- State Texas
- 87 Strongly Landlord-Friendly · R+5
- County
- — inherits STATE
- City
- — inherits STATE
ZIP-level market 77020
- Home prices YoY
- 29.1%
- Rents YoY
- 4.3%
- Active inventory
- 339
- Price-to-rent
- 12.5×
Monthly cashflow live
- Estimated rent
- $2,191 high interval (Pro) →
- Mortgage (P&I)
- −$1,731
- Tax from tax record
- −$531 /mo · $6,376/yr
- Insurance
- −$138
- HOA
- −$0
- Vacancy / Maint / Mgmt
- −$460
- Net cashflow
- $-668
Break-even live
Sensitivity live
| Price | -10% $-481 | -5% $-575 | +0% $-668 | +5% $-762 | +10% $-855 |
|---|---|---|---|---|---|
| Rent | -10% $-841 | -5% $-755 | +0% $-668 | +5% $-582 | +10% $-495 |
| Rate | -1.0pp $-502 | -0.5pp $-584 | base $-668 | +0.5pp $-754 | +1.0pp $-841 |
UW: 25.0% down · 7.5% · 30yr · 1.5% tax · 5.0% vac · 8.0% maint · 8.0% mgmt
Financing live
Cash to close
- Down payment
- $82,500
- Closing costs
- $9,900
- Reserves months
- —
- Total cash needed
- —
Loan-product check · same deal, 3 products live
Conventional
25% down · 7.5% · 30yr
- Down + closing
- —
- Monthly P&I
- —
- Monthly cashflow
- —
- DSCR
- —
- Eligible?
- —
Personal DTI + credit; lowest rate.
DSCR
20% down · 8.5% · 30yr
- Down + closing
- —
- Monthly P&I
- —
- Monthly cashflow
- —
- DSCR
- —
- Eligible?
- —
No personal income docs; deal must DSCR.
Hard money
10% down · 12.0% · 12mo
- Down + closing
- —
- Monthly P&I
- —
- Monthly cashflow
- —
- DSCR
- —
- Eligible?
- —
Short-term bridge; refi at stabilization.
Rent comps 24 comps
| Address | Beds | Baths | Sqft | Rent | $/sqft | DOM | Units | Dist |
|---|---|---|---|---|---|---|---|---|
| 4712 Rawley St Unit B Houston, TX | 3.0 | 2.5 | 1501 | $2,045 | $1.36 | 22d | 1 | 0.13mi |
| 4712 Rawley St Unit a Houston, TX | 3.0 | 2.0 | 1501 | $2,070 | $1.38 | 22d | 1 | 0.13mi |
| 4300 Lyons Ave Unit 304 Houston, TX | 4.0 | 2.0 | 1393 | $1,460 | $1.05 | 45d | 1 | 0.34mi |
| 5217 Noble St Houston, TX | 3.0 | 2.5 | 1897 | $2,750 | $1.45 | 45d | 1 | 0.38mi |
| 4509 Courtney St Houston, TX | 4.0 | 1.0 | 1456 | $1,150 | $0.79 | 24d | 1 | 0.49mi |
| 1222 Upton St Houston, TX | 3.0 | 4.0 | 2055 | $2,600 | $1.27 | 45d | 1 | 0.52mi |
| 3730 Lyons Ave Unit 216 Houston, TX | 3.0 | 2.0 | 1107 | $1,300 | $1.17 | 45d | 1 | 0.57mi |
| 5605 Mulvey St Unit 1019610P Houston, TX | 3.0 | 2.5 | 1410 | $4,376 | $3.10 | 1d | 1 | 0.57mi |
| 2105 Sam Wilson St Houston, TX | 3.0 | 2.5 | 1416 | $6,750 | $4.77 | 45d | 1 | 0.57mi |
| 1513 Cage St Houston, TX | 3.0 | 2.0 | 1467 | $1,550 | $1.06 | 45d | 1 | 0.77mi |
| 4109 Hare St Unit A Houston, TX | 4.0 | 2.5 | 1913 | $6,950 | $3.63 | 45d | 1 | 0.79mi |
| 4109 Hare St Unit 1019559P Houston, TX | 4.0 | 2.5 | 1905 | $6,852 | $3.60 | 9d | 1 | 0.79mi |
| 3300 Lyons Ave Unit 304 Houston, TX | 4.0 | 2.0 | 1393 | $1,460 | $1.05 | 45d | 1 | 0.84mi |
| 3503 Wyrick St Houston, TX | 3.0 | 2.5 | 1746 | $2,850 | $1.63 | 45d | 1 | 0.88mi |
| 1307 Bayou St Unit B Houston, TX | 3.0 | 3.0 | 1814 | $2,400 | $1.32 | 9d | 1 | 0.97mi |
| 1303 Bayou St Unit C Houston, TX | 3.0 | 3.0 | 1869 | $3,200 | $1.71 | 45d | 1 | 0.97mi |
| 3410 Baer St Houston, TX | 3.0 | 4.0 | 2040 | $3,500 | $1.72 | 45d | 1 | 1.07mi |
| 3419 Gillespie St Houston, TX | 3.0 | 3.5 | 2168 | $2,300 | $1.06 | 45d | 1 | 1.08mi |
| 1023 Hahlo St Houston, TX | 4.0 | 2.0 | 1434 | $1,775 | $1.24 | 7d | 1 | 1.11mi |
| 611 Sydnor St Houston, TX | 3.0 | 4.0 | 2157 | $2,400 | $1.11 | 45d | 1 | 1.23mi |
| 308 Grove St Houston, TX | 3.0 | 3.0 | 1701 | $2,350 | $1.38 | 9d | 1 | 1.23mi |
| 2905 Baer St Unit 1047953P Houston, TX | 3.0 | 2.5 | 1991 | $2,922 | $1.47 | 1d | 1 | 1.28mi |
| 3910 Woolworth St Houston, TX | 3.0 | 2.0 | 1150 | $1,750 | $1.52 | 45d | 1 | 1.34mi |
| 1714 Mary St Houston, TX | 2.0 | 2.0 | 1100 | $2,400 | $2.18 | 45d | 1 | 1.36mi |
Listing history 24 events
-
2026-06-21days on market $330,000 Active 85 DOM
-
2026-06-18days on market $330,000 Active 82 DOM
-
2026-06-17days on market $330,000 Active 81 DOM
-
2026-06-16days on market $330,000 Active 80 DOM
-
2026-06-15days on market $330,000 Active 79 DOM
-
2026-06-13days on market $330,000 Active 77 DOM
-
2026-06-10days on market $330,000 Active 73 DOM
-
2026-06-08days on market $330,000 Active 72 DOM
-
2026-06-07days on market $330,000 Active 71 DOM
-
2026-06-04days on market $330,000 Active 68 DOM
-
2026-06-01days on market $330,000 Active 65 DOM
-
2026-05-31days on market $330,000 Active 64 DOM
-
2026-03-30$2,500
-
2026-03-28$330,000 Active 965-char remark
Show marketing remark (965 chars)
Uncover the epitome of modern living at this newly constructed gem in the historic Fifth Ward! This 2-story home boats contemporary architecture, convenient first-floor living, an open inviting layout & high-end finishes throughout. A light-filled haven awaits in the spacious living area w/ soaring ceilings; perfect for entertaining. At the heart of this abode, the gourmet kitchen showcases luxurious quartz counters, an expansive island, chic Samsung appliances & glossy lacquer cabinetry. Tranquility abounds in the primary suite flaunting a quaint balcony & a spa-like bath w/ a dual sink vanity, oversized walk-in closet soaking tub & glass enclosed shower. The private backyard w/ lush landscaping offers an idyllic setting to take in the open air or dine alfresco. Find abundant parking w/ a 2-car garage & double-wide driveway. Reside minutes away from Boyce Dorian Park, Discovery Green, Lynos Avenue, Downtown, East River & more!
-
2024-04-30historical $2,400
-
2024-03-19price $2,400
-
2024-02-29$2,600
-
2024-02-29historical
-
2024-02-28$2,600 Active
-
2024-02-27soldstatus
-
2024-02-26soldstatus
-
2023-12-16historical
-
2023-11-01$359,000 Active
-
2023-10-24historical
ⓘ Source: listings_history table (triggers on properties + properties_extension) + one-shot
backfill from property_details.listing_events for pre-trigger history.
Tax reassessment forecast TX · Resets to sale price
- Current annual tax
- $6,376 · $531/mo
- Projected year-2 tax
- $6,376 · $531/mo
- Expected delta
- $0/yr ($0/mo · 0.0%)
ⓘ Screening estimate from a state-policy table — verify with the county assessor before closing.
Climate risk First Street
- Flood 4/10 Moderate FEMA zone X (unshaded) · 22% chance over 30 yrs
- Wildfire 1/10 Low
- Heat 9/10 Extreme 7 d/yr ≥109°F today · 23 d/yr by 30 yrs out
- Wind 9/10 Extreme 99% chance of damaging wind over 30 yrs
- Air quality 3/10 Moderate 2 unhealthy d/yr today · 3 by 30 yrs out
Nearby sold comps map
Loading sold comps map…
Walkable amenities ~0.75 mi
Loading nearby amenities…
Taxation est. · year 1
- Rental income
- $26,297
- − Mortgage interest
- −$18,485
- − Property taxes
- −$6,376
- − Insurance
- −$1,650
- − Repairs & maintenance
- −$2,104
- − Management
- −$2,104
- − Depreciation
- −$9,600
- Taxable loss
- −$14,021
- Est. tax savings @ 24.0%
- +$3,365
- After-tax cash flow
- $-4,653/yr
For passive investors: Depreciation is non-cash, so a rental often shows a tax loss while cash-flowing — sheltering income. Rental losses are passive: they offset passive income freely, and up to $25,000/yr can offset ordinary (W-2) income if you actively participate and your MAGI is under $100k (phasing out to $0 by $150k); unused losses carry forward. On sale, claimed depreciation is recaptured at up to 25%, and gains may owe capital-gains tax (a 1031 exchange can defer both). Figures are a year-1 estimate at your 24.0% rate — not tax advice; consult a CPA.
Condition & rehab AI · 13 photos
This newly constructed single-family home in the historic Fifth Ward offers modern living with contemporary architecture and high-end finishes. It is move-in ready with no visible repairs or maintenance needed.
Value-add opportunities
- Both Painting the exterior siding — Enhances curb appeal and can increase both resale and rental value.
- Both Landscaping improvements — Enhances curb appeal and can increase both resale and rental value.
Renovation cost estimate screening
Value-add ROI direction
- Both Painting the exterior siding — Enhances curb appeal and can increase both resale and rental value. ↑
- Both Landscaping improvements — Enhances curb appeal and can increase both resale and rental value. ↑
ⓘ Cost ranges are severity-bucket heuristics (US national rule-of-thumb). Get contractor quotes + a written scope before underwriting a rehab budget.
Schools (NCES district)
- District
- Houston ISD
- NCES district ID
- 4823640
- Math proficiency
- 27% ▼ -18.00%
- Reading proficiency
- 35% ▼ -6.00%
- Median HH income
- $46,054
- Composite
- 26.63/100
- National rank
- #7173
- State rank
- #593 of 826 in TX
Livability — Houston
- Score
- 74/100
- State rank
- #184
- US rank
- #4771
Category grades
Schools grade is shown separately in the Schools card above.
Census & demographics
- Census place
- Houston, TX
- County
- Harris County · 4,702,590 people
- City population
- 3,226,434
- Metro
- Houston-The Woodlands-Sugar Land, TX
- Population (ZIP)
- 23,686
- Household income
- $50,119
- Rent vs Own
- Severe rent burden
- 969.0
Population outlook (Harris County) Hauer SSP2
- Today (2025)
- 5,571,493 people
- By 2030
- 6,089,821 · +9.3%
- By 2040
- 7,142,806 · +28.2%
- By 2050
- 8,185,864 · +46.9%
- By 2075
- 10,574,329 · +89.8%
- By 2100
- 12,109,958 · +117.4%
Race, ethnicity, and origin ACS 2023
- Neighborhood character
- Predominantly Hispanic (69%)
- Race & ethnicity
- Hispanic / Latino 69% Black 24% Two or more races 22% White 5% Asian 1%
- Hispanic origin (detail)
- Mexican 60%
- Common ancestry
- Swiss 1%
- Foreign-born
- 23% · Canada
- Languages at home
- 39% English-only · Spanish 59% Other Indo-European 1%
Political lean MEDSL · Harris
- 2024 margin
- Lean D (+5.5) · D 52.0% · R 46.4% · Other 1.6%
- 2008→2024 swing
- +3.9pp toward D · 2008: 1.6pp · 2024: 5.5pp
- All cycles
- 2024: D+5.5 2020: D+13.3 2016: D+12.4 2012: D+0.1 2008: D+1.6
Not yet ingested
- Civics
- —
Market trends
- HPI YoY
- ▲ 55.64%
- Current HPI
- 246.5578
- Rent YoY
- ▲ 4.27%
- Metro
- Houston-The Woodlands-Sugar Land, TX
- State GDP YoY
- ▲ 3.95%
- F500 in state
- 110
Industry mix (Fortune 500 HQ in TX)
| Industry | F500 HQs | Revenue |
|---|---|---|
| Energy | 16 | $1,198B |
|
||
| Technology | 5 | $198B |
|
||
| Engineering / Construction | 4 | $72B |
|
||
| Energy Services | 3 | $60B |
|
||
| Utilities | 3 | $41B |
|
||
| Healthcare | 2 | $330B |
|
||
Price history
-99.3% since first listed12 events — show timeline
- 2026-03-30 Listed for Rent $2,500 HARMLS
- 2026-03-28 Listed $330,000 HARMLS
- 2024-04-30 Rental Removed $2,400 HARMLS
- 2024-03-19 Price Changed $2,400 HARMLS
- 2024-02-29 Listed for Rent $2,600 HARMLS
- 2024-02-29 Listing Removed — HARMLS
- 2024-02-28 Listed $2,600 HARMLS
- 2024-02-27 Sold (Public Records) — Public Records
- 2024-02-26 Sold (Public Records) — Public Records
- 2023-12-16 Listing Removed — HARMLS
- 2023-11-01 Listed $359,000 HARMLS
- 2023-10-24 Coming Soon — HARMLS
Property tax history
+76.7%/yrLatest (2025): $6,376 · -8.4% YoY. Source: county tax records.
Cash-flow waterfall
monthlySold comps — $/sqft
last 12 mo · ≤1 miLoading sold comps…