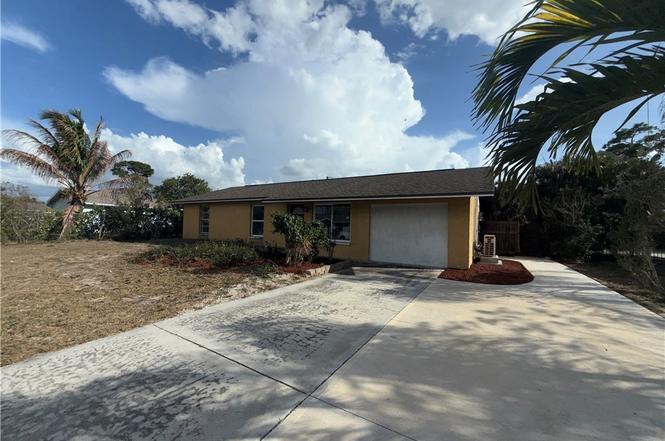
9112 Pineapple Rd · San Carlos Park, FL
Flood risk 4/10 · Minor
- FEMA flood zone
- X (unshaded)
- Chance of flooding over 30 yrs
- 0.13%
- Est. flood insurance / yr
- $507 – $1,088
Fire risk 1/10 · Minimal
- Est. fire insurance / yr
- $947 – $1,759
Heat risk 10/10 · Severe
- Hot days now (above 107°F)
- 7 days/yr
- Hot days in 30 yrs
- 31 days/yr
Wind risk 10/10 · Severe
- Chance of severe wind over 30 yrs
- 99.0%
Air-quality risk 2/10 · Minimal
- Unhealthy air days now
- 1 days/yr
- Unhealthy air days in 30 yrs
- 1 days/yr
Risk factors via First Street. Map © Google.
Why this score? — see what drove the C grade
The composite is a weighted blend of 9 inputs, each scored 0–100. Each bar is that input's sub-score; the figure is the points it added to the 100-point composite (weight × sub-score).
- Cash flow +20.5/30.0
- ARV discount +15.0/15.0
- DSCR +6.5/10.0
- 1% rule +5.6/10.0
- Schools +4.1/10.0
- Livability +3.2/5.0
- Condition / age +2.5/5.0
- Rent growth +1.1/5.0
- Appreciation +0.0/10.0
$199,900
🖨 Deal sheet 📄 Offer letter ✓ Due diligence
Listing remarks
This 3B/1Ba home is is located in San Carlos Park in Fort Myers, FL. This concrete block single family home is 1,040 SqFt. The property is a . 18 acre lot with a fenced-in backyard and exterior shed. The home has a 2016 shingle roof. Located in close proximity to RSW Airport, I-75, Gulf Coast Town Center, and FGCU. Don't miss this opportunity - schedule your tour today!
Key facts
- 2016 shingle roof
- Fenced-in backyard
- Exterior shed
Tags
Property features AI
Finance
- Other: Zoning: RS-1; Lot dimensions approximately 81 x 105 x 81 x 105 (0.188 acre)
- Financial info: Pets are allowed
- HOA & community: No HOA fee (association fee listed as 0)
Exterior
- Parking: No parking details provided
- Security: No security features listed
- Utilities: Public water; Public sewer; Cable service not available
- Home design: Single-story home; North-facing; Entry on first level; Resale property
- Construction: Block, concrete and stucco construction; Shingle roof; Built with a foundation typical for resale (year built not provided)
- Exterior features: No specific exterior features listed; Rectangular lot; South exposure
Interior
- Kitchen: No kitchen appliance details provided
- Bedrooms: Bedrooms located on main level
- Flooring: Vinyl flooring
- Bathrooms: 1 full bathroom
- Heating & cooling: No heating or cooling details provided
- Interior features: Unfurnished; Split bedrooms; No additional interior features listed
- Laundry & utility: No laundry details provided
Neighborhood map
What this means for you Summary
Snapshot
- This is a 3-bed/1.0-bath single-family listed at $200k.
Deal economics
- At list price, monthly cash flow is $262 ($3k/yr) — positive.
- The deal already cash-flows at list — no discount required.
- Meets the 1% rule at list price ($2k rent vs $200k).
- Recommended offer: $188k (6.0% below list) — sets the bar for market timing.
- Cap rate 7.9% vs local median 2.4% in San Carlos Park — top-decile yield for the area; either an underpriced asset or a hidden risk that comps aren't pricing in. Stress-test before assuming the spread holds.
Location & tenants
- Location reads 65/100 on livability (#662 in FL) — a middle-class / working-renter tenant base. Strengths: housing A+, employment A-, crime B+; Watch: schools F, amenities F, commute F.
- Lee (suburban): math 47% / reading 50% proficiency, ranked #42 of 73 in FL (top 58%) — families likely to look elsewhere, expect single-tenant / working-renter base with shorter leases.
- Market conditions: Rents falling (-5.7%/yr); 226 active listings in the ZIP; 33 comparable units currently listed for rent nearby; rentals at typical pace (median 19d on market — plan ~3-4 weeks tenant-placement turnaround); solid renter incomes; 15,411 units permitted in Lee County in 2024 (4,686 in 5+ unit buildings).
Forward outlook
- Local home prices are declining (-3.0%/yr); year-one equity from $1k of loan paydown is wiped out by about $6k of value loss. Plan a longer hold.
- Lee County population projected at +44% by 2050 — long-run rental-demand tailwind backs the buy-and-hold thesis.
Negotiation context
- It's been on market 63 days — a 6% lower offer ($188k) is reasonable based on typical stale-listing flexibility.
- 5 sale attempts since 2y ago with the ask held roughly flat each time — persistent listings suggest the price (not the market) is what's stuck; bring a comps-based counter.
- Current owner paid $95k; list at $200k implies a 111% gain — meaningful room to come down on a strong offer.
Risks & watch-outs
- Climate carrying-cost: severe wind risk, 99% chance of damaging wind over 30y; extreme-heat days projected 7→31/yr by 2055 (HVAC capex compounding) — expect insurance premiums to compound above CPI over the hold.
Questions for the listing agent
- It's been on market 63 days. Have you received any prior offers? Is the seller open to a 6% concession, seller financing, or rate buy-down credit?
- Why hasn't it sold? Are there any deal-killer items the seller is aware of (foundation, flood, title, zoning, code violations)?
- Is there a deadline driving the sale (1031 exchange, divorce, estate, relocation)? That informs how much negotiation room exists.
- Schools are F-rated, which usually means shorter tenancies and higher turnover. Who's the typical renter profile here, and what's been the actual vacancy rate?
- What's the average days-on-market for RENTAL listings here right now (not sales)? A rising rental-DOM trend means longer vacancies and softer asking-rent achievability than the comps imply.
- What's the recent tenant-quality profile in this submarket — average credit score on applications, eviction rate, late-payment / NSF rate, and stable-employment percentage? A property-management company in the area should have these aggregated.
- How much new for-sale + rental construction is in the pipeline within 1–3 miles? Heavy new supply typically softens prices + rents 12–24 months out; constrained supply supports both.
Investment metrics
- 1% rule
- 1.06% ✓
- Cap rate
- 7.87%
- Cash-on-cash
- 5.62%
- DSCR
- 1.25
- GRM
- 7.9
CMA / ARV
- ARV (on-the-fly)
- $304,720
- Comps found
- 8
Show comp detail 8 sales within ~0.75 mi
| Address | Dist | Beds/Ba | Sqft | Sold | Price | $/sf | Match |
|---|---|---|---|---|---|---|---|
| 9069 King Rd W | 0.12mi | 3/1.0 | 1,040 (0%) | 2mo | $280,000 | $269 | 93 |
| 9064 Hamlin Rd W | 0.10mi | 3/2.0 | 1,000 (-4%) | 2mo | $166,100 | $166 | 84 |
| 9104 Pineapple Rd | 0.02mi | 3/1.0 | 1,040 (0%) | 22mo | $305,000 | $293 | 81 |
| 19041 Murcott Dr E | 0.25mi | 3/1.0 | 1,040 (0%) | 22mo | $310,000 | $298 | 70 |
| 9017 Pomelo Rd W | 0.22mi | 3/2.0 | 1,150 (+11%) | 24mo | $327,000 | $284 | 48 |
| 18500 Sarasota Rd | 0.73mi | 2/1.0 (-1) | 988 (-5%) | 7mo | $285,000 | $288 | 47 |
| 19029 Orlando Rd S | 0.31mi | 3/2.0 | 1,174 (+13%) | 24mo | $345,000 | $294 | 40 |
| 8457 Robin Rd | 0.56mi | 3/2.0 | 1,140 (+10%) | 18mo | $360,000 | $316 | 39 |
Match score weights: distance 35% · size 25% · config 20% · recency 20%. Top-matched comps best support the ARV.
Projected returns pro-forma
-3.0% appreciation · 0.0% rent growth · sell at horizon
- IRR
- -11.1%
- Equity multiple
- 0.61×
- Total profit
- $-21,846
- Equity at exit
- $29,806
- IRR
- -6.9%
- Equity multiple
- 0.62×
- Total profit
- $-21,257
- Equity at exit
- $17,284
Cash invested: $55,972 (down + closing). Projections, not guarantees.
Landlord ↔ Tenant lean methodology
- Overall (STATE)
- 87 Strongly Landlord-Friendly
- State Florida
- 87 Strongly Landlord-Friendly · R+3
- County
- — inherits STATE
- City
- — inherits STATE
ZIP-level market 33967
- Home prices YoY
- -29.3%
- Rents YoY
- -5.7%
- Active inventory
- 226
- Price-to-rent
- 7.9×
Monthly cashflow live
- Estimated rent
- $2,111 high interval (Pro) →
- Mortgage (P&I)
- −$1,048
- Tax from tax record
- −$274 /mo · $3,290/yr
- Insurance
- −$83
- HOA
- −$0
- Vacancy / Maint / Mgmt
- −$443
- Net cashflow
- $262
Break-even live
UW: 25.0% down · 7.5% · 30yr · 1.5% tax · 5.0% vac · 8.0% maint · 8.0% mgmt
Financing live
Cash to close
- Down payment
- $49,975
- Closing costs
- $5,997
- Reserves months
- —
- Total cash needed
- —
Loan-product check · same deal, 3 products live
Conventional
25% down · 7.5% · 30yr
- Down + closing
- —
- Monthly P&I
- —
- Monthly cashflow
- —
- DSCR
- —
- Eligible?
- —
Personal DTI + credit; lowest rate.
DSCR
20% down · 8.5% · 30yr
- Down + closing
- —
- Monthly P&I
- —
- Monthly cashflow
- —
- DSCR
- —
- Eligible?
- —
No personal income docs; deal must DSCR.
Hard money
10% down · 12.0% · 12mo
- Down + closing
- —
- Monthly P&I
- —
- Monthly cashflow
- —
- DSCR
- —
- Eligible?
- —
Short-term bridge; refi at stabilization.
Rent comps 33 comps
| Address | Beds | Baths | Sqft | Rent | $/sqft | DOM | Units | Dist |
|---|---|---|---|---|---|---|---|---|
| 19136 Miami Blvd Fort Myers, FL | 2.0 | 2.0 | 1068 | $1,550 | $1.45 | 14d | 1 | 0.26mi |
| 9211 Seville Rd Fort Myers, FL | 2.0 | 2.0 | 1021 | $2,000 | $1.96 | 19d | 1 | 0.39mi |
| 9209 Seville Rd Fort Myers, FL | 2.0 | 2.0 | 1021 | $2,000 | $1.96 | 3d | 1 | 0.39mi |
| 9209 Seville Rd Fort Myers, FL | 2.0 | 2.0 | 1021 | $2,000 | $1.96 | 3d | 1 | 0.39mi |
| 18659 Sarasota Rd Fort Myers, FL | 3.0 | 1.0 | 1148 | $2,300 | $2.00 | 23d | 1 | 0.43mi |
| 18660 Miami Blvd Fort Myers, FL | 2.0 | 1.0 | 960 | $1,599 | $1.67 | 23d | 1 | 0.48mi |
| 8402 Matanzas Rd Fort Myers, FL | 2.0 | 1.0 | 896 | $1,595 | $1.78 | 23d | 1 | 0.54mi |
| 18600 Miami Blvd #604 Fort Myers, FL | 2.0 | 1.0 | 960 | $1,800 | $1.88 | 19d | 1 | 0.58mi |
| 18600 Miami Blvd Unit Annual Fort Myers, FL | 2.0 | 1.0 | 960 | $1,700 | $1.77 | 16d | 1 | 0.58mi |
| 18581 Oriole Rd Fort Myers, FL | 2.0 | 2.0 | 975 | $1,600 | $1.64 | 21d | 1 | 0.63mi |
| 18569 Bartow Blvd Fort Myers, FL | 2.0 | 1.0 | 960 | $1,450 | $1.51 | 3d | 1 | 0.63mi |
| 19738 Tesoro Way Unit 1545812P Fort Myers, FL | 3.0 | 2.0 | 1496 | $3,871 | $2.59 | 16d | 1 | 0.63mi |
| 18570 Miami Blvd Fort Myers, FL | 2.0 | 2.0 | 1067 | $1,550 | $1.45 | 23d | 1 | 0.64mi |
| 9920 Portofino Vineyards Dr Unit 108 Fort Myers, FL | 2.0 | 2.0 | 1141 | $2,411 | $2.11 | 23d | 1 | 0.71mi |
| 8334 Robin Rd Fort Myers, FL | 3.0 | 2.0 | 1272 | $2,495 | $1.96 | 23d | 1 | 0.72mi |
| 9940 Estero Oaks Dr Fort Myers, FL | 1.0–3.0 | 1.0–2.0 | 1107 | $2,299 | $2.08 | 1d | 14 | 0.83mi |
| 9096 Frank Rd Fort Myers, FL | 3.0 | 2.0 | 1258 | $2,506 | $1.99 | 14d | 1 | 0.84mi |
| 9013 San Carlos Blvd Fort Myers, FL | 2.0 | 1.0 | 960 | $1,675 | $1.74 | 3d | 1 | 0.84mi |
| 8208 Matanzas Rd Fort Myers, FL | 2.0 | 1.0 | 896 | $1,899 | $2.12 | 23d | 1 | 0.87mi |
| 19760 Osprey Cove Blvd #145 Estero, FL | 2.0 | 2.0 | 1121 | $1,500 | $1.34 | 10d | 1 | 0.89mi |
| 8450 Kingbird Loop #430 Estero, FL | 2.0 | 2.0 | 1302 | $1,700 | $1.31 | 2d | 1 | 0.93mi |
| 8450 Kingbird Loop #430 Estero, FL | 2.0 | 2.0 | 1302 | $1,700 | $1.31 | 1d | 1 | 0.93mi |
| 8450 Kingbird Loop #412 Estero, FL | 2.0 | 2.0 | 1418 | $1,960 | $1.38 | 23d | 1 | 0.93mi |
| 8251 Grand Palm Dr #3 Estero, FL | 2.0 | 2.0 | 1332 | $5,800 | $4.35 | 23d | 1 | 0.98mi |
| 8470 Kingbird Loop #1027 Estero, FL | 2.0 | 2.0 | 1150 | $1,750 | $1.52 | 16d | 1 | 0.99mi |
| 8470 Kingbird Loop #1020 Estero, FL | 2.0 | 2.0 | 1302 | $1,750 | $1.34 | 2d | 1 | 0.99mi |
| 8165 Pelican Rd Fort Myers, FL | 3.0 | 2.0 | 1020 | $2,065 | $2.02 | 19d | 1 | 1.10mi |
| 20573 Candlewood Holw Estero, FL | 2.0 | 2.0 | 1375 | $4,800 | $3.49 | 23d | 1 | 1.26mi |
| 19091 Holly Rd Fort Myers, FL | 2.0 | 1.0 | 720 | $1,295 | $1.80 | 23d | 1 | 1.29mi |
| 18645 Holly Rd Unit 1 Fort Myers, FL | 2.0 | 1.0 | 950 | $1,800 | $1.89 | 19d | 1 | 1.34mi |
| 20321 Estero Gardens Cir Estero, FL | 2.0–3.0 | 1.5–2.0 | 1423 | $3,700 | $2.60 | 23d | 3 | 1.36mi |
| 20611 Country Creek Dr #3217 Estero, FL | 2.0 | 2.0 | 1161 | $3,595 | $3.10 | 23d | 1 | 1.44mi |
| 18543 Iris Rd Fort Myers, FL | 2.0 | 1.0 | 1110 | $1,795 | $1.62 | 14d | 1 | 1.45mi |
Listing history 22 events
-
2026-05-19status Pending
-
2026-04-22status Active
-
2026-04-10status Pending
-
2026-03-05$199,900 Active
-
2025-11-19status Pending
-
2025-11-19historical
-
2025-10-20$60,000 Active
-
2025-01-31historical
-
2024-12-04status Active
-
2024-12-04price $265,000
-
2024-11-30status Pending
-
2024-11-30price $285,000
-
2024-11-06price $270,000
-
2024-10-17price $285,000
-
2024-10-02$290,000 Active
-
2015-03-02price $79,900
-
2013-11-21soldstatus $94,900
-
2013-11-04soldstatus $94,900
-
2008-07-28soldstatus $88,282
-
2002-06-11soldstatus $93,500
-
2000-11-29soldstatus $71,900
-
1998-04-27soldstatus $42,300
ⓘ Source: listings_history table (triggers on properties + properties_extension) + one-shot
backfill from property_details.listing_events for pre-trigger history.
Tax reassessment forecast FL · Resets to sale price
- Current annual tax
- $3,290 · $274/mo
- Projected year-2 tax
- $3,290 · $274/mo
- Expected delta
- $0/yr ($0/mo · -0.0%)
ⓘ Screening estimate from a state-policy table — verify with the county assessor before closing.
Climate risk First Street
- Flood 4/10 Moderate FEMA zone X (unshaded) · 13% chance over 30 yrs
- Wildfire 1/10 Low
- Heat 10/10 Extreme 7 d/yr ≥107°F today · 31 d/yr by 30 yrs out
- Wind 10/10 Extreme 99% chance of damaging wind over 30 yrs
- Air quality 2/10 Low 1 unhealthy d/yr today · 1 by 30 yrs out
Nearby sold comps map
Loading sold comps map…
Walkable amenities ~0.75 mi
Loading nearby amenities…
Taxation est. · year 1
- Rental income
- $25,333
- − Mortgage interest
- −$11,198
- − Property taxes
- −$3,290
- − Insurance
- −$1,000
- − Repairs & maintenance
- −$2,027
- − Management
- −$2,027
- − Depreciation
- −$5,815
- Taxable loss
- −$23
- Est. tax savings @ 24.0%
- +$5
- After-tax cash flow
- $3,149/yr
For passive investors: Depreciation is non-cash, so a rental often shows a tax loss while cash-flowing — sheltering income. Rental losses are passive: they offset passive income freely, and up to $25,000/yr can offset ordinary (W-2) income if you actively participate and your MAGI is under $100k (phasing out to $0 by $150k); unused losses carry forward. On sale, claimed depreciation is recaptured at up to 25%, and gains may owe capital-gains tax (a 1031 exchange can defer both). Figures are a year-1 estimate at your 24.0% rate — not tax advice; consult a CPA.
Schools (NCES district)
- District
- Lee
- NCES district ID
- 1201080
- Math proficiency
- 47% ▼ -11.00%
- Reading proficiency
- 50% ▼ -4.00%
- Median HH income
- $49,518
- Composite
- 41.49/100
- National rank
- #3458
- State rank
- #42 of 73 in FL
Livability — San Carlos Park
- Score
- 65/100
- State rank
- #662
- US rank
- #13354
Category grades
Schools grade is shown separately in the Schools card above.
Census & demographics
- Census place
- San Carlos Park, FL
- County
- Lee County · 788,662 people
- City population
- 27,337
- Metro
- Cape Coral-Fort Myers, FL
- Population (ZIP)
- 28,341
- Household income
- $90,519
- Rent vs Own
- Severe rent burden
- 491.0
Population outlook (Lee County) Hauer SSP2
- Today (2025)
- 871,946 people
- By 2030
- 955,468 · +9.6%
- By 2040
- 1,113,587 · +27.7%
- By 2050
- 1,256,891 · +44.1%
- By 2075
- 1,560,270 · +78.9%
- By 2100
- 1,726,848 · +98.0%
Race, ethnicity, and origin ACS 2023
- Neighborhood character
- Predominantly White (67%)
- Race & ethnicity
- White 67% Hispanic / Latino 23% Two or more races 16% Asian 3% Black 3%
- Hispanic origin (detail)
- Mexican 8% Puerto Rican 2% Cuban 4% Dominican 1%
- Common ancestry
- Romanian 3% Lithuanian 2% Slovak 2%
- Foreign-born
- 14% · Canada, Jamaica, Vietnam
- Languages at home
- 79% English-only · Spanish 16% Other Indo-European 1% Vietnamese 1%
Political lean MEDSL · Lee
- 2024 margin
- Strong R (+28.4) · D 35.5% · R 63.9%
- 2008→2024 swing
- -18.0pp toward R · 2008: -10.4pp · 2024: -28.4pp
- All cycles
- 2024: R+28.4 2020: R+19.2 2016: R+20.4 2012: R+16.6 2008: R+10.4
Not yet ingested
- Civics
- —
Market trends
- HPI YoY
- ▼ -123.07%
- Current HPI
- 296.5923
- Rent YoY
- ▼ -5.68%
- Metro
- Cape Coral-Fort Myers, FL
- State GDP YoY
- ▲ 3.28%
- F500 in state
- 36
Industry mix (Fortune 500 HQ in FL)
| Industry | F500 HQs | Revenue |
|---|---|---|
| Industrial Technology | 2 | $29B |
|
||
| Insurance | 2 | $17B |
|
||
| Retail | 1 | $60B |
|
||
| Technology Distribution | 1 | $58B |
|
||
| Homebuilding | 1 | $35B |
|
||
| Technology Manufacturing | 1 | $35B |
|
||
Price history
+372.6% since first listed22 events — show timeline
- 2026-05-19 Pending — FORTMLS
- 2026-04-22 Relisted — FORTMLS
- 2026-04-10 Pending — FORTMLS
- 2026-03-05 Listed $199,900 FORTMLS
- 2025-11-19 Pending — Stellar MLS as Distributed by MLS Grid
- 2025-11-19 Listing Removed — Stellar MLS as Distributed by MLS Grid
- 2025-10-20 Listed $60,000 Stellar MLS as Distributed by MLS Grid
- 2025-01-31 Listing Removed — FORTMLS
- 2024-12-04 Relisted — FORTMLS
- 2024-12-04 Price Changed $265,000 FORTMLS
- 2024-11-30 Pending — FORTMLS
- 2024-11-30 Price Changed $285,000 FORTMLS
- 2024-11-06 Price Changed $270,000 FORTMLS
- 2024-10-17 Price Changed $285,000 FORTMLS
- 2024-10-02 Listed $290,000 FORTMLS
- 2015-03-02 Price Changed $79,900 FORTMLS
- 2013-11-21 Sold (Public Records) $94,900 Public Records
- 2013-11-04 Sold (MLS) $94,900 FORTMLS
- 2008-07-28 Sold (MLS) $88,282 FORTMLS
- 2002-06-11 Sold (Public Records) $93,500 Public Records
- 2000-11-29 Sold (Public Records) $71,900 Public Records
- 1998-04-27 Sold (Public Records) $42,300 Public Records
Property tax history
+7.5%/yrLatest (2025): $3,290 · +6.0% YoY. Source: county tax records.
Cash-flow waterfall
monthlySold comps — $/sqft
last 12 mo · ≤1 miLoading sold comps…