 🏷️ Likely Rental
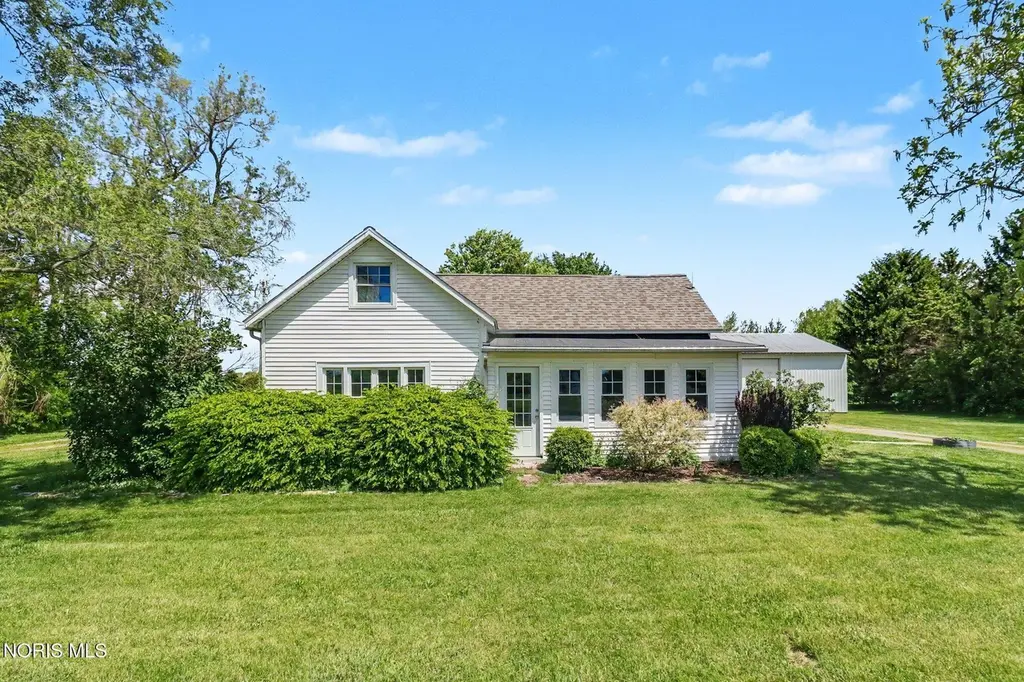
6612 Holcomb Rd · Pemberville, OH
Flood risk 1/10 · Minimal
- FEMA flood zone
- X (unshaded)
- Chance of flooding over 30 yrs
- 0.0%
- Est. flood insurance / yr
- $473 – $860
Fire risk 1/10 · Minimal
- Est. fire insurance / yr
- $713 – $1,323
Heat risk 3/10 · Minor
- Hot days now (above 100°F)
- 7 days/yr
- Hot days in 30 yrs
- 17 days/yr
Wind risk 2/10 · Minimal
- Chance of severe wind over 30 yrs
- —
Air-quality risk 2/10 · Minimal
- Unhealthy air days now
- 1 days/yr
- Unhealthy air days in 30 yrs
- 2 days/yr
Risk factors via First Street. Map © Google.
Why this score? — see what drove the C grade
The composite is a weighted blend of 9 inputs, each scored 0–100. Each bar is that input's sub-score; the figure is the points it added to the 100-point composite (weight × sub-score).
- Cash flow +20.5/30.0
- ARV discount +7.5/15.0
- Schools +6.6/10.0
- DSCR +6.5/10.0
- 1% rule +5.2/10.0
- Livability +4.3/5.0
- Rent growth +2.5/5.0
- Condition / age +2.5/5.0
- Appreciation +0.0/10.0
$139,000
🖨 Deal sheet 📄 Offer letter ✓ Due diligence
Listing remarks MLS
2 WELLS, HOUSE WELL PUMP NEW '06, WATER HEATER NEW '03 W/NEW FLUE, SEPTIC INSPECTED W/NEW LID '98, NEW ROOF '01. MOBILE HOME RENTED FOR $350/MONTH LEASE, MOBILE HOME SEPTIC CLEANED '04. THE 1973 MOBILE HOME IS A 14X65 NEW YORKER HAVING 2 BDRMS & 2 ENCLOSED PORCHES.
Key facts
- Workshop space
- Entertaining area
- Partial basement
Tags
Property features AI
Finance
- Other: Property sits on about 1.54 acres; Additional parcel included
Exterior
- Parking: Driveway; Gravel parking
- Utilities: Well water; Septic tank; Internet connected
- Home design: Single-family residence; House with one and one-half levels; Not attached to other structures; No common walls
- Construction: Vinyl siding; Block foundation; Living area approximately 1,585
- Exterior features: Shingle roof; Barn(s) on the property
Interior
- Kitchen: Main-level kitchen approximately 10 x 12
- Bedrooms: Upper-level bedroom approximately 14 x 14; Upper-level bedroom approximately 10 x 10; Upper-level bedroom approximately 12 x 10
- Flooring: Other flooring
- Bathrooms: 1 full bathroom
- Heating & cooling: Forced air heating (propane); Central air conditioning
- Interior features: Seven total rooms; Basement present; Other interior features
- Laundry & utility: Laundry located in the basement
Neighborhood map
What this means for you Summary
Snapshot
- This is a 3-bed/1.0-bath single-family listed at $139k.
Deal economics
- At list price, monthly cash flow is $183 ($2k/yr) — positive.
- The deal already cash-flows at list — no discount required.
- Meets the 1% rule at list price ($1k rent vs $139k).
- Recommended offer: $135k (3.0% below list) — sets the bar for market timing.
Location & tenants
- Location reads 86/100 on livability (#40 in OH, #409 nationally) — a professional / high-income tenant draw. Strengths: crime A+, employment A+, cost of living A+; Watch: amenities F, commute F.
- Eastwood Local (rural): math 74% / reading 81% proficiency, ranked #69 of 656 in OH (top 10%) — strong family-tenant draw, lease renewals of 3-5y typical; only 19% free/reduced lunch — higher-income household profile.
- Zoned schools: Eastwood Elementary School (math 82% / reading 83%, grade A+, #106 of 1,584 statewide, top 7%, 698 students, 26% FRL); Eastwood Middle School (math 65% / reading 76%, grade A, #131 of 654 statewide, top 21%, 345 students, 26% FRL); Eastwood I High School (math 77% / reading 87%, grade A, #23 of 781 statewide, top 3%, 412 students, 14% FRL) — zoned schools at 22% FRL track the district average.
- Market conditions: 19 active listings in the ZIP; solid renter incomes; 493 units permitted in Wood County in 2024 (48 in 5+ unit buildings).
Forward outlook
- Local home prices are declining (-3.0%/yr); year-one equity from $961 of loan paydown is wiped out by about $4k of value loss. Plan a longer hold.
- Wood County population projected at +14% by 2050 — modest demand growth; plan on rents tracking national, not racing it.
Negotiation context
- It's been on market 34 days — a 3% lower offer ($135k) is reasonable based on typical stale-listing flexibility.
- 2 sale attempts since 20y ago with the ask held roughly flat each time — persistent listings suggest the price (not the market) is what's stuck; bring a comps-based counter.
Risks & watch-outs
- Watch-outs: built in 1890 — expect roof / HVAC / electrical / plumbing capex.
Questions for the listing agent
- It's been on market 34 days. Have you received any prior offers? Is the seller open to a 3% concession, seller financing, or rate buy-down credit?
- Built in 1890 — when were the roof, HVAC, electrical panel, plumbing, and water heater last replaced?
- Is there a deadline driving the sale (1031 exchange, divorce, estate, relocation)? That informs how much negotiation room exists.
- Schools are A-rated — typically a magnet for longer-tenancy family renters. What's the average tenant stay here, and is there a school-zone premium baked into asking?
- What's the average days-on-market for RENTAL listings here right now (not sales)? A rising rental-DOM trend means longer vacancies and softer asking-rent achievability than the comps imply.
- What's the recent tenant-quality profile in this submarket — average credit score on applications, eviction rate, late-payment / NSF rate, and stable-employment percentage? A property-management company in the area should have these aggregated.
- How much new for-sale + rental construction is in the pipeline within 1–3 miles? Heavy new supply typically softens prices + rents 12–24 months out; constrained supply supports both.
Investment metrics
- 1% rule
- 1.02% ✓
- Cap rate
- 7.88%
- Cash-on-cash
- 5.65%
- DSCR
- 1.25
- GRM
- 8.2
CMA / ARV
- ARV (median comp)
- $368,916
- List price
- $139,000
- Delta
- -62.32%
- Verdict
- UNDERPRICED
- Comps
- 3 within 1.0 mi
Show comp detail 1 sale within ~0.75 mi
| Address | Dist | Beds/Ba | Sqft | Sold | Price | $/sf | Match |
|---|---|---|---|---|---|---|---|
| 6662 Holcomb Rd | 0.06mi | 4/2.0 (+1) | 1,804 (+14%) | 22mo | $380,000 | $211 | 46 |
Match score weights: distance 35% · size 25% · config 20% · recency 20%. Top-matched comps best support the ARV.
Projected returns pro-forma
-3.0% appreciation · 3.0% rent growth · sell at horizon
- IRR
- -7.5%
- Equity multiple
- 0.72×
- Total profit
- $-10,842
- Equity at exit
- $20,725
- IRR
- 2.0%
- Equity multiple
- 1.14×
- Total profit
- $5,614
- Equity at exit
- $12,018
Cash invested: $38,920 (down + closing). Projections, not guarantees.
Landlord ↔ Tenant lean methodology
- Overall (STATE)
- 73 Landlord-Friendly
- State Ohio
- 73 Landlord-Friendly · R+6
- County
- — inherits STATE
- City
- — inherits STATE
ZIP-level market 43450
- Home prices YoY
- -21.4%
- Active inventory
- 19
- Price-to-rent
- 8.2×
Monthly cashflow live
- Estimated rent
- $1,413 medium interval (Pro) →
- Mortgage (P&I)
- −$729
- Tax from tax record
- −$146 /mo · $1,753/yr
- Insurance
- −$58
- HOA
- −$0
- Vacancy / Maint / Mgmt
- −$297
- Net cashflow
- $183
Break-even live
UW: 25.0% down · 7.5% · 30yr · 1.5% tax · 5.0% vac · 8.0% maint · 8.0% mgmt
Financing live
Cash to close
- Down payment
- $34,750
- Closing costs
- $4,170
- Reserves months
- —
- Total cash needed
- —
Loan-product check · same deal, 3 products live
Conventional
25% down · 7.5% · 30yr
- Down + closing
- —
- Monthly P&I
- —
- Monthly cashflow
- —
- DSCR
- —
- Eligible?
- —
Personal DTI + credit; lowest rate.
DSCR
20% down · 8.5% · 30yr
- Down + closing
- —
- Monthly P&I
- —
- Monthly cashflow
- —
- DSCR
- —
- Eligible?
- —
No personal income docs; deal must DSCR.
Hard money
10% down · 12.0% · 12mo
- Down + closing
- —
- Monthly P&I
- —
- Monthly cashflow
- —
- DSCR
- —
- Eligible?
- —
Short-term bridge; refi at stabilization.
Listing history 22 events
-
2026-06-19status $139,000 Pending 34 DOM
-
2026-06-18days on market $139,000 Active 34 DOM
-
2026-06-17days on market $139,000 Active 33 DOM
-
2026-06-16days on market $139,000 Active 32 DOM
-
2026-06-15days on market $139,000 Active 31 DOM
-
2026-06-14days on market $139,000 Active 29 DOM
-
2026-06-13days on market $139,000 Active 28 DOM
-
2026-06-10days on market $139,000 Active 26 DOM
-
2026-06-09days on market $139,000 Active 25 DOM
-
2026-06-08days on market $139,000 Active 24 DOM
-
2026-06-07days on market $139,000 Active 23 DOM
-
2026-06-03days on market $139,000 Active 19 DOM
-
2026-06-02days on market $139,000 Active 18 DOM
-
2026-06-01days on market $139,000 Active 17 DOM
-
2026-05-31days on market $139,000 Active 16 DOM
-
2026-05-30days on market $139,000 Active 15 DOM
-
2026-05-07$139,000 Active 1162-char remark
-
2025-10-14price $130,000 269-char remark
Show marketing remark (269 chars)
2 WELLS, HOUSE WELL PUMP NEW '06, WATER HEATER NEW '03 W/NEW FLUE, SEPTIC INSPECTED W/NEW LID '98, NEW ROOF '01. MOBILE HOME RENTED FOR $350/MONTH LEASE, MOBILE HOME SEPTIC CLEANED '04. THE 1973 MOBILE HOME IS A 14X65 NEW YORKER HAVING 2 BDRMS & 2 ENCLOSED PORCHES.
-
2018-12-05soldstatus $140,000
-
2006-09-15soldstatus $130,000 269-char remark
Show marketing remark (269 chars)
2 WELLS, HOUSE WELL PUMP NEW '06, WATER HEATER NEW '03 W/NEW FLUE, SEPTIC INSPECTED W/NEW LID '98, NEW ROOF '01. MOBILE HOME RENTED FOR $350/MONTH LEASE, MOBILE HOME SEPTIC CLEANED '04. THE 1973 MOBILE HOME IS A 14X65 NEW YORKER HAVING 2 BDRMS & 2 ENCLOSED PORCHES.
-
2006-09-15soldstatus $130,000
Show marketing remark (269 chars)
2 WELLS, HOUSE WELL PUMP NEW '06, WATER HEATER NEW '03 W/NEW FLUE, SEPTIC INSPECTED W/NEW LID '98, NEW ROOF '01. MOBILE HOME RENTED FOR $350/MONTH LEASE, MOBILE HOME SEPTIC CLEANED '04. THE 1973 MOBILE HOME IS A 14X65 NEW YORKER HAVING 2 BDRMS & 2 ENCLOSED PORCHES.
-
2006-07-14$149,000 269-char remark
Show marketing remark (269 chars)
2 WELLS, HOUSE WELL PUMP NEW '06, WATER HEATER NEW '03 W/NEW FLUE, SEPTIC INSPECTED W/NEW LID '98, NEW ROOF '01. MOBILE HOME RENTED FOR $350/MONTH LEASE, MOBILE HOME SEPTIC CLEANED '04. THE 1973 MOBILE HOME IS A 14X65 NEW YORKER HAVING 2 BDRMS & 2 ENCLOSED PORCHES.
ⓘ Source: listings_history table (triggers on properties + properties_extension) + one-shot
backfill from property_details.listing_events for pre-trigger history.
Tax reassessment forecast OH · Partial reset (capped growth)
- Current annual tax
- $1,753 · $146/mo
- Projected year-2 tax
- $1,961 · $163/mo
- Expected delta
- +$207/yr (+$17/mo · 11.8%)
ⓘ Screening estimate from a state-policy table — verify with the county assessor before closing.
Climate risk First Street
- Flood 1/10 Low FEMA zone X (unshaded) · 0% chance over 30 yrs
- Wildfire 1/10 Low
- Heat 3/10 Moderate 7 d/yr ≥100°F today · 17 d/yr by 30 yrs out
- Wind 2/10 Low
- Air quality 2/10 Low 1 unhealthy d/yr today · 2 by 30 yrs out
Nearby sold comps map
Loading sold comps map…
Walkable amenities ~0.75 mi
Loading nearby amenities…
Taxation est. · year 1
- Rental income
- $16,957
- − Mortgage interest
- −$7,786
- − Property taxes
- −$1,753
- − Insurance
- −$695
- − Repairs & maintenance
- −$1,357
- − Management
- −$1,357
- − Depreciation
- −$4,044
- Taxable loss
- −$35
- Est. tax savings @ 24.0%
- +$8
- After-tax cash flow
- $2,209/yr
For passive investors: Depreciation is non-cash, so a rental often shows a tax loss while cash-flowing — sheltering income. Rental losses are passive: they offset passive income freely, and up to $25,000/yr can offset ordinary (W-2) income if you actively participate and your MAGI is under $100k (phasing out to $0 by $150k); unused losses carry forward. On sale, claimed depreciation is recaptured at up to 25%, and gains may owe capital-gains tax (a 1031 exchange can defer both). Figures are a year-1 estimate at your 24.0% rate — not tax advice; consult a CPA.
Schools (NCES district)
- District
- Eastwood Local
- NCES district ID
- 3905067
- Math proficiency
- 74% ▼ -8.00%
- Reading proficiency
- 81% ▼ -3.00%
- Median HH income
- $58,995
- Composite
- 66.42/100
- National rank
- #420
- State rank
- #69 of 656 in OH
Livability — Pemberville
- Score
- 86/100
- State rank
- #40
- US rank
- #409
Category grades
Schools grade is shown separately in the Schools card above.
Census & demographics
- County
- Wood · 127,168 people
- Metro
- Toledo, OH
- Population (ZIP)
- 3,602
- Household income
- $80,208
- Rent vs Own
- Severe rent burden
- 16.2
Population outlook (Wood County) Hauer SSP2
- Today (2025)
- 138,744 people
- By 2030
- 143,189 · +3.2%
- By 2040
- 150,896 · +8.8%
- By 2050
- 158,589 · +14.3%
- By 2075
- 182,166 · +31.3%
- By 2100
- 196,533 · +41.7%
Race, ethnicity, and origin ACS 2023
- Neighborhood character
- Predominantly White (89%)
- Race & ethnicity
- White 89% Hispanic / Latino 7% Two or more races 5% Pacific Islander 1%
- Hispanic origin (detail)
- Mexican 6%
- Common ancestry
- Romanian 6% Lithuanian 2% Slovak 1%
- Foreign-born
- 3% · Canada
- Languages at home
- 94% English-only · Spanish 4% Tagalog/Filipino 1% Other Asian/Pacific 1%
Political lean MEDSL · Wood
- 2024 margin
- R (+10.2) · D 44.4% · R 54.6%
- 2008→2024 swing
- -17.3pp toward R · 2008: 7.1pp · 2024: -10.2pp
- All cycles
- 2024: R+10.2 2020: R+7.6 2016: R+8.5 2012: D+4.2 2008: D+7.1
Not yet ingested
- Civics
- —
Market trends
- HPI YoY
- ▼ -55.46%
- Current HPI
- 203.416
- Rent YoY
- —
- Metro
- —
- State GDP YoY
- ▲ 1.98%
- F500 in state
- 48
Industry mix (Fortune 500 HQ in OH)
| Industry | F500 HQs | Revenue |
|---|---|---|
| Insurance | 3 | $145B |
|
||
| Industrial Machinery | 3 | $49B |
|
||
| Financial Services | 3 | $24B |
|
||
| Consumer Goods | 2 | $93B |
|
||
| Aerospace / Defense | 2 | $47B |
|
||
| Utilities | 2 | $33B |
|
||
Price history
-6.7% since first listed7 events — show timeline
- 2026-05-07 Listed $139,000 NORIS
- 2025-10-14 Price Changed $130,000 NORIS
- 2018-12-05 Sold (Public Records) $140,000 Public Records
- 2006-09-15 Sold (Public Records) $130,000 Public Records
- 2006-09-15 Sold (MLS) $130,000 NORIS
- 2006-09-11 Price Changed $149,000 NORIS
- 2006-07-14 Listed $149,000 NORIS
Property tax history
+6.0%/yrLatest (2025): $1,753 · -3.0% YoY. Source: county tax records.
Cash-flow waterfall
monthlySold comps — $/sqft
last 12 mo · ≤1 miLoading sold comps…