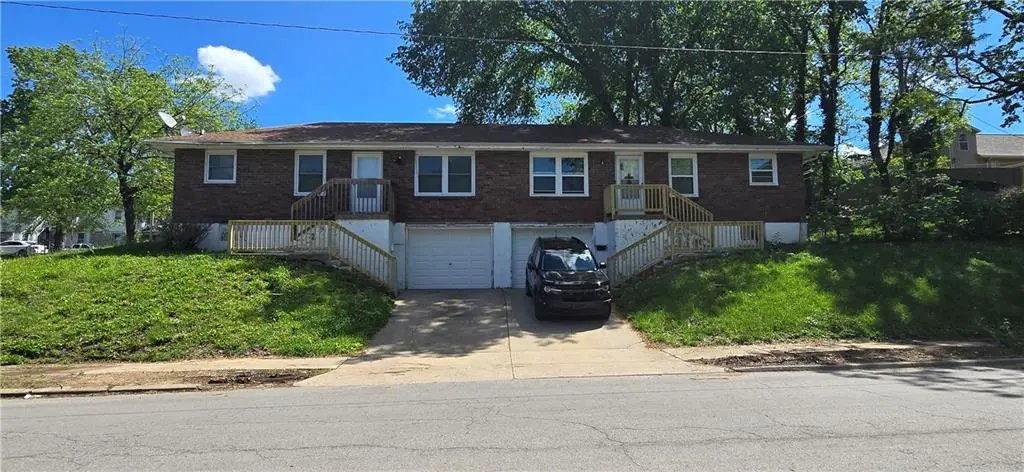
 Duplex
1301-1303 Topping Ave · Kansas City, MO
Flood risk 1/10 · Minimal
- FEMA flood zone
- X (unshaded)
- Chance of flooding over 30 yrs
- 0.0%
- Est. flood insurance / yr
- $473 – $860
Fire risk 1/10 · Minimal
- Est. fire insurance / yr
- $1,054 – $1,958
Heat risk 4/10 · Minor
- Hot days now (above 106°F)
- 7 days/yr
- Hot days in 30 yrs
- 17 days/yr
Wind risk 2/10 · Minimal
- Chance of severe wind over 30 yrs
- —
Air-quality risk 3/10 · Minor
- Unhealthy air days now
- 2 days/yr
- Unhealthy air days in 30 yrs
- 3 days/yr
Risk factors via First Street. Map © Google.
Why this score? — see what drove the B- grade
The composite is a weighted blend of 9 inputs, each scored 0–100. Each bar is that input's sub-score; the figure is the points it added to the 100-point composite (weight × sub-score).
- Cash flow +24.6/30.0
- Appreciation +10.0/10.0
- ARV discount +9.8/15.0
- DSCR +7.9/10.0
- 1% rule +5.1/10.0
- Livability +3.9/5.0
- Rent growth +2.5/5.0
- Condition / age +2.5/5.0
- Schools +1.5/10.0
$235,000
🖨 Deal sheet 📄 Offer letter ✓ Due diligence
Multi-family units
County records classify this as Multi-Family (2-4 Unit). Listing-text estimate: 2 units. confirmed
Listing remarks MLS
Fantastic cash flowing 3bed 1bath duplex under the 1% rule. No repairs or modifications needed one side already occupied. This building is perfect for a seasoned landlord looking to add to portfolio or new investor looking for something easy to take over. Great building, solid bones, and fantastic layout. Don't wait come see it this week and make an offer before its gone.
Key facts
- Two spacious units
- Remodeled
- Modern updates
Tags
Property features AI
Finance
- Other: Lot approximately 0.16 acres (public records); Directions: Hwy I-70 to Truman Road exit, go East; turn left on Topping; property on right; Current occupancy rate reported at 90–95%
- Financial info: Gross income reported at $27,000; Operating expenses include personal property tax, insurance, and property management
- HOA & community: No association fees
Exterior
- Parking: Attached garage
- Security: Smoke detector(s)
- Utilities: Public water; Public sewer; 100 amp electric service; Individual water heaters
- Home design: Duplex residential income property; Single-story building
- Construction: Brick and concrete construction; Composition roof
- Exterior features: Property is inside city limits; Paved road access; Not in a flood plain; Public maintenance for road
Interior
- Kitchen: Range/oven and refrigerator included in each unit; Microwave
- Bedrooms: Two units, each 3-bedroom
- Bathrooms: Each unit has 1 bathroom
- Heating & cooling: Natural gas heating; Electric cooling
- Interior features: Microwave; Refrigerator; Electric range; Smoke detectors
- Laundry & utility: Laundry located in basement
Neighborhood map
What this means for you Summary
Snapshot
- This is a 2 × 3-bed/1.0-bath units multifamily listed at $235k.
Deal economics
- At list price, monthly cash flow is $485 ($6k/yr) — positive. Per door: $242/mo.
- The deal already cash-flows at list — no discount required.
- Meets the 1% rule at list price ($2k rent vs $235k).
- Recommended offer: $228k (3.0% below list) — sets the bar for market timing.
- Cap rate 8.8% vs local median 3.9% in Kansas City — top-decile yield for the area; either an underpriced asset or a hidden risk that comps aren't pricing in. Stress-test before assuming the spread holds.
Location & tenants
- Location reads 78/100 on livability (#28 in MO, #2,671 nationally) — a middle-class / working-renter tenant base. Strengths: amenities A+, commute A+, cost of living A+; Watch: schools C-, crime F.
- Kansas City 33 (urban): math 12% / reading 24% proficiency, ranked #308 of 324 in MO (top 95%) — low school quality limits family demand, transient renter base, plan for 1-2y turnover; 75% free/reduced lunch — lower-income household profile, screen leases tightly.
- Market conditions: 21 active listings in the ZIP; 10 comparable units currently listed for rent nearby; rentals at typical pace (median 21d on market — plan ~3-4 weeks tenant-placement turnaround); 4,002 units permitted in Jackson County in 2024 (2,271 in 5+ unit buildings).
Forward outlook
- In year one you build about $25k of equity ($2k loan paydown + $24k appreciation (10.0% local appreciation)).
- Jackson County population projected at +4% by 2050 — modest demand growth; plan on rents tracking national, not racing it.
- At projected returns (10.0% appreciation + 3.0% rent growth), your $66k cash investment doubles in ~3 years — after that, you're playing with house money.
- By year 2, paydown + projected appreciation supports a ~$40k cash-out refi (75% LTV) — recoverable capital for the next deal without selling this one.
Negotiation context
- It's been on market 54 days — a 3% lower offer ($228k) is reasonable based on typical stale-listing flexibility.
- 7 sale attempts since 20y ago with the ask held roughly flat each time — persistent listings suggest the price (not the market) is what's stuck; bring a comps-based counter.
Questions for the listing agent
- It's been on market 54 days. Have you received any prior offers? Is the seller open to a 3% concession, seller financing, or rate buy-down credit?
- Can we see the unit-by-unit rent roll, current vacancy, and any below-market leases? What's the average tenancy length?
- What capital expenditures (roof, boiler, parking lot, exteriors) have been made in the last 5 years, and what's planned in the next 2?
- Built in 1967 — when were the roof, HVAC, electrical panel, plumbing, and water heater last replaced?
- Is there a deadline driving the sale (1031 exchange, divorce, estate, relocation)? That informs how much negotiation room exists.
- Crime grade is F in this area — have there been break-ins, vandalism, or insurance claims at this property in the last 3 years? What carrier currently insures it and at what premium?
- What's the average days-on-market for RENTAL listings here right now (not sales)? A rising rental-DOM trend means longer vacancies and softer asking-rent achievability than the comps imply.
- What's the recent tenant-quality profile in this submarket — average credit score on applications, eviction rate, late-payment / NSF rate, and stable-employment percentage? A property-management company in the area should have these aggregated.
- How much new apartment / multifamily construction is in the pipeline within 1–3 miles? Heavy new supply (>2% of stock underway) typically softens rents 12–24 months out; light construction supports rent growth.
Investment metrics
- 1% rule
- 1.01% ✓
- Cap rate
- 8.77%
- Cash-on-cash
- 8.84%
- DSCR
- 1.39
- GRM
- 8.2
CMA / ARV
- ARV (median comp)
- $247,574
- List price
- $235,000
- Delta
- -5.08%
- Verdict
- FAIR
- Comps
- 4 within 1.0 mi
Projected returns pro-forma
10.0% appreciation · 3.0% rent growth · sell at horizon
- IRR
- 30.7%
- Equity multiple
- 3.41×
- Total profit
- $158,758
- Equity at exit
- $211,707
- IRR
- 26.6%
- Equity multiple
- 7.73×
- Total profit
- $443,031
- Equity at exit
- $456,553
Cash invested: $65,800 (down + closing). Projections, not guarantees.
Landlord ↔ Tenant lean methodology
- Overall (STATE)
- 81 Strongly Landlord-Friendly
- State Missouri
- 81 Strongly Landlord-Friendly · R+10
- County
- — inherits STATE
- City
- — inherits STATE
ZIP-level market 64126
- Active inventory
- 21
- Price-to-rent
- 16.4×
Monthly cashflow live
- Estimated rent
- $2,382 high interval (Pro) →
- Mortgage (P&I)
- −$1,232
- Tax from tax record
- −$67 /mo · $801/yr
- Insurance
- −$98
- HOA
- −$0
- Vacancy / Maint / Mgmt
- −$500
- Net cashflow
- $485
Break-even live
2-unit breakdown (identical units grouped — click to expand)
| Units | Beds | Baths | Est. rent |
|---|---|---|---|
| 2× units | 3 | 1 | $2,382 |
| #1 | 3 | 1 | $1,191 |
| #2 | 3 | 1 | $1,191 |
| Total (2 units) | $2,382 | ||
UW: 25.0% down · 7.5% · 30yr · 1.5% tax · 5.0% vac · 8.0% maint · 8.0% mgmt
Financing live
Cash to close
- Down payment
- $58,750
- Closing costs
- $7,050
- Reserves months
- —
- Total cash needed
- —
Loan-product check · same deal, 3 products live
Conventional
25% down · 7.5% · 30yr
- Down + closing
- —
- Monthly P&I
- —
- Monthly cashflow
- —
- DSCR
- —
- Eligible?
- —
Personal DTI + credit; lowest rate.
DSCR
20% down · 8.5% · 30yr
- Down + closing
- —
- Monthly P&I
- —
- Monthly cashflow
- —
- DSCR
- —
- Eligible?
- —
No personal income docs; deal must DSCR.
Hard money
10% down · 12.0% · 12mo
- Down + closing
- —
- Monthly P&I
- —
- Monthly cashflow
- —
- DSCR
- —
- Eligible?
- —
Short-term bridge; refi at stabilization.
Rent comps 10 comps
| Address | Beds | Baths | Sqft | Rent | $/sqft | DOM | Units | Dist |
|---|---|---|---|---|---|---|---|---|
| 5852 E 20th St Unit TOP-1724 Kansas City, MO | 3.0 | 1.5 | 1482 | $1,075 | $0.73 | 3d | 1 | 0.64mi |
| 815 Elmwood Ave Kansas City, MO | 3.0 | 1.5 | 1302 | $1,600 | $1.23 | 14d | 1 | 0.86mi |
| 1812 Elmwood Ave Kansas City, MO | 3.0 | 1.0 | 1650 | $1,600 | $0.97 | 16d | 1 | 0.94mi |
| 1905 Kensington Ave Kansas City, MO | 3.0 | 2.0 | 1285 | $1,325 | $1.03 | 23d | 1 | 1.06mi |
| 1805 Jackson Ave Kansas City, MO | 4.0 | 2.0 | 1250 | $1,250 | $1.00 | 43d | 1 | 1.12mi |
| 216 N Wheeling Ave Kansas City, MO | 3.0 | 2.0 | 1474 | $1,495 | $1.01 | 20d | 1 | 1.23mi |
| 216 N Wheeling Ave Kansas City, MO | 3.0 | 2.0 | 1474 | $1,495 | $1.01 | 16d | 1 | 1.23mi |
| 5213 Wilburn Ct Kansas City, MO | 3.0 | 1.0 | 1274 | $1,375 | $1.08 | 21d | 1 | 1.32mi |
| 218 N Elmwood Ave Kansas City, MO | 4.0 | 2.0 | 1184 | $1,500 | $1.27 | 43d | 1 | 1.49mi |
| 441 N Hardesty Ave Kansas City, MO | 4.0 | 1.0 | 1511 | $1,550 | $1.03 | 23d | 1 | 1.50mi |
Listing history 31 events
-
2026-06-18days on market $235,000 Active 54 DOM
-
2026-06-17days on market $235,000 Active 53 DOM
-
2026-06-16days on market $235,000 Active 52 DOM
-
2026-06-15days on market $235,000 Active 51 DOM
-
2026-06-13days on market $235,000 Active 49 DOM
-
2026-06-09days on market $235,000 Active 45 DOM
-
2026-06-08days on market $235,000 Active 44 DOM
-
2026-06-07days on market $235,000 Active 43 DOM
-
2026-06-05days on market $235,000 Active 40 DOM
-
2026-06-03days on market $235,000 Active 39 DOM
-
2026-06-02days on market $235,000 Active 38 DOM
-
2026-06-01days on market $235,000 Active 37 DOM
-
2026-05-31days on market $235,000 Active 36 DOM
-
2026-04-25$235,000 Active 919-char remark
-
2024-07-16soldstatus
-
2022-06-26price $925
-
2022-02-24soldstatus
-
2022-02-22soldstatus Closed 374-char remark
Show marketing remark (374 chars)
Fantastic cash flowing 3bed 1bath duplex under the 1% rule. No repairs or modifications needed one side already occupied. This building is perfect for a seasoned landlord looking to add to portfolio or new investor looking for something easy to take over. Great building, solid bones, and fantastic layout. Don't wait come see it this week and make an offer before its gone.
-
2022-01-22status Pending 374-char remark
Show marketing remark (374 chars)
Fantastic cash flowing 3bed 1bath duplex under the 1% rule. No repairs or modifications needed one side already occupied. This building is perfect for a seasoned landlord looking to add to portfolio or new investor looking for something easy to take over. Great building, solid bones, and fantastic layout. Don't wait come see it this week and make an offer before its gone.
-
2022-01-10$164,900 Active 374-char remark
Show marketing remark (374 chars)
Fantastic cash flowing 3bed 1bath duplex under the 1% rule. No repairs or modifications needed one side already occupied. This building is perfect for a seasoned landlord looking to add to portfolio or new investor looking for something easy to take over. Great building, solid bones, and fantastic layout. Don't wait come see it this week and make an offer before its gone.
-
2020-04-24historical
-
2020-04-04status Pending
-
2020-04-03$68,000 Active
-
2013-08-15$50,000
-
2010-11-05soldstatus
-
2010-06-15soldstatus
-
2010-04-22$30,000
-
2010-04-22historical
-
2009-11-03$35,000
-
2006-09-18soldstatus
-
2006-06-13$79,900
ⓘ Source: listings_history table (triggers on properties + properties_extension) + one-shot
backfill from property_details.listing_events for pre-trigger history.
Tax reassessment forecast MO · Resets to sale price
- Current annual tax
- $801 · $67/mo
- Projected year-2 tax
- $2,280 · $190/mo
- Expected delta
- +$1,479/yr (+$123/mo · 184.6%)
ⓘ Screening estimate from a state-policy table — verify with the county assessor before closing.
Climate risk First Street
- Flood 1/10 Low FEMA zone X (unshaded) · 0% chance over 30 yrs
- Wildfire 1/10 Low
- Heat 4/10 Moderate 7 d/yr ≥106°F today · 17 d/yr by 30 yrs out
- Wind 2/10 Low
- Air quality 3/10 Moderate 2 unhealthy d/yr today · 3 by 30 yrs out
Nearby sold comps map
Loading sold comps map…
Walkable amenities ~0.75 mi
Loading nearby amenities…
Taxation est. · year 1
- Rental income
- $28,584
- − Mortgage interest
- −$13,164
- − Property taxes
- −$801
- − Insurance
- −$1,175
- − Repairs & maintenance
- −$2,287
- − Management
- −$2,287
- − Depreciation
- −$6,836
- Taxable income
- $2,035
- Est. tax owed @ 24.0%
- −$488
- After-tax cash flow
- $5,329/yr
For passive investors: Depreciation is non-cash, so a rental often shows a tax loss while cash-flowing — sheltering income. Rental losses are passive: they offset passive income freely, and up to $25,000/yr can offset ordinary (W-2) income if you actively participate and your MAGI is under $100k (phasing out to $0 by $150k); unused losses carry forward. On sale, claimed depreciation is recaptured at up to 25%, and gains may owe capital-gains tax (a 1031 exchange can defer both). Figures are a year-1 estimate at your 24.0% rate — not tax advice; consult a CPA.
Schools (NCES district)
- District
- Kansas City 33
- NCES district ID
- 2916400
- Math proficiency
- 12% ▼ -8.00%
- Reading proficiency
- 24% ▬ 0.00%
- Median HH income
- $35,227
- Composite
- 14.8/100
- National rank
- #9387
- State rank
- #308 of 324 in MO
Livability — Kansas City
- Score
- 78/100
- State rank
- #28
- US rank
- #2671
Category grades
Schools grade is shown separately in the Schools card above.
Census & demographics
- Census place
- Kansas City, MO
- City population
- 439,467
- Population (ZIP)
- 6,433
Population outlook (Jackson County) Hauer SSP2
- Today (2025)
- 719,589 people
- By 2030
- 731,456 · +1.6%
- By 2040
- 746,689 · +3.8%
- By 2050
- 749,289 · +4.1%
- By 2075
- 736,227 · +2.3%
- By 2100
- 668,210 · -7.1%
Race, ethnicity, and origin ACS 2023
- Neighborhood character
- Diverse neighborhood (Simpson 0.62)
- Race & ethnicity
- Hispanic / Latino 57% Two or more races 29% White 19% Black 14% Asian 3% Native American 2%
- Hispanic origin (detail)
- Mexican 38% Cuban 4%
- Common ancestry
- Slovak 2% Iranian 1% Lithuanian 1%
- Foreign-born
- 36% · Canada
- Languages at home
- 44% English-only · Spanish 50% Vietnamese 1%
Political lean MEDSL · Jackson
- 2024 margin
- D (+19.3) · D 58.9% · R 39.5% · Other 1.6%
- 2008→2024 swing
- -6.1pp toward R · 2008: 25.4pp · 2024: 19.3pp
- All cycles
- 2024: D+19.3 2020: D+22.0 2016: D+16.6 2012: D+19.0 2008: D+25.4
Not yet ingested
- Civics
- —
Market trends
- HPI YoY
- ▲ 100.10%
- Current HPI
- 369.8782
- Rent YoY
- —
- Metro
- —
- State GDP YoY
- ▲ 1.84%
- F500 in state
- 20
Industry mix (Fortune 500 HQ in MO)
| Industry | F500 HQs | Revenue |
|---|---|---|
| Healthcare | 1 | $163B |
|
||
| Insurance | 1 | $21B |
|
||
| Industrial Technology | 1 | $17B |
|
||
| Retail | 1 | $16B |
|
||
| Industrial Distribution | 1 | $10B |
|
||
| Utilities | 1 | $9B |
|
||
Price history
+194.1% since first listed18 events — show timeline
- 2026-04-25 Listed $235,000 Heartland MLS as Distributed by MLS Grid
- 2024-07-16 Sold (Public Records) — Public Records
- 2022-06-26 Price Changed $925 RENT.
- 2022-02-24 Sold (Public Records) — Public Records
- 2022-02-22 Sold (MLS) — Heartland MLS as Distributed by MLS Grid
- 2022-01-22 Pending — Heartland MLS as Distributed by MLS Grid
- 2022-01-10 Listed $164,900 Heartland MLS as Distributed by MLS Grid
- 2020-04-24 Listing Removed — Heartland MLS as Distributed by MLS Grid
- 2020-04-04 Pending — Heartland MLS as Distributed by MLS Grid
- 2020-04-03 Listed $68,000 Heartland MLS as Distributed by MLS Grid
- 2013-08-15 Listed $50,000 Heartland MLS as Distributed by MLS Grid
- 2010-11-05 Sold (Public Records) — Public Records
- 2010-06-15 Sold (MLS) — Heartland MLS as Distributed by MLS Grid
- 2010-04-22 Listing Removed — Heartland MLS as Distributed by MLS Grid
- 2010-04-22 Listed $30,000 Heartland MLS as Distributed by MLS Grid
- 2009-11-03 Listed $35,000 Heartland MLS as Distributed by MLS Grid
- 2006-09-18 Sold (MLS) — Heartland MLS as Distributed by MLS Grid
- 2006-06-13 Listed $79,900 Heartland MLS as Distributed by MLS Grid
Property tax history
+7.2%/yrLatest (2025): $801 · -73.1% YoY. Source: county tax records.
Cash-flow waterfall
monthlySold comps — $/sqft
last 12 mo · ≤1 miLoading sold comps…