 Triplex
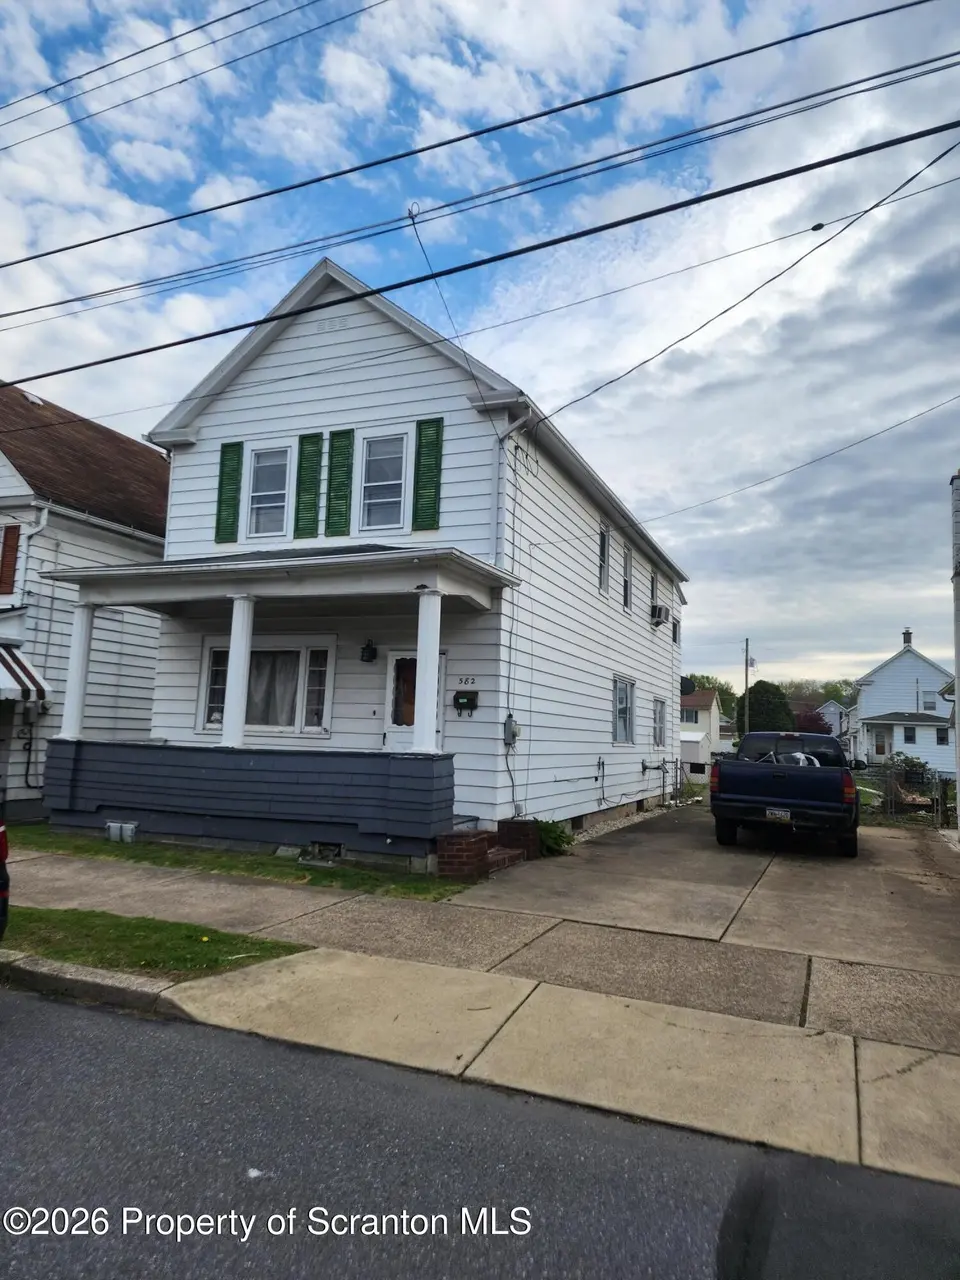
582-586 Shawnee St · Plymouth, PA
Flood risk 6/10 · Moderate
- FEMA flood zone
- X
- Chance of flooding over 30 yrs
- 0.27%
- Est. flood insurance / yr
- $507 – $1,088
Fire risk 3/10 · Minor
- Est. fire insurance / yr
- $511 – $949
Heat risk 4/10 · Minor
- Hot days now (above 96°F)
- 7 days/yr
- Hot days in 30 yrs
- 16 days/yr
Wind risk 3/10 · Minor
- Chance of severe wind over 30 yrs
- 5.0%
Air-quality risk 2/10 · Minimal
- Unhealthy air days now
- 1 days/yr
- Unhealthy air days in 30 yrs
- 2 days/yr
Risk factors via First Street. Map © Google.
Why this score? — see what drove the B grade
The composite is a weighted blend of 9 inputs, each scored 0–100. Each bar is that input's sub-score; the figure is the points it added to the 100-point composite (weight × sub-score).
- Cash flow +30.0/30.0
- ARV discount +15.0/15.0
- 1% rule +10.0/10.0
- DSCR +10.0/10.0
- Livability +3.3/5.0
- Rent growth +2.5/5.0
- Schools +1.9/10.0
- Condition / age +1.0/5.0
- Appreciation +0.0/10.0
$160,000
🖨 Deal sheet 📄 Offer letter ✓ Due diligence
Multi-family units
County records classify this as Multi-Family (2-4 Unit). Listing-text estimate: 3 units. confirmed
Listing remarks
HIGHEST AND BEST DUE BY NOON ON 5/5/26Investor Opportunity - Two Homes on One Deed in Hanover Township, PA!Rare chance to own two houses on one lot and deed in desirable Hanover Township. This property is a full rehab project with strong upside potential for investors, flippers, or buyers looking to build equity. 582 (Larger Home):Features 3 bedrooms and 1.5 bathrooms, with an eat-in kitchen and first-floor laundry for added convenience. The home showcases original hardwood floors ready to be refinished and brought back to life. A unique highlight is the screened-in porch off a second-floor bedroom, offering a great space to relax. Additional features include off-street parking and a shed f
Key facts
- Full rehab project
- Screened-in porch
- Storage shed
Tags
Property features AI
Finance
- Other: Living area reported as 2,600; Lot dimensions approximately 58 x 111 on a 0.15-acre lot
- Financial info: Property listed as residential income with 2 total units (Unit 582 and Unit 586)
Exterior
- Parking: Driveway and off-street parking
- Utilities: Public water; Public sewer; Electricity connected; Natural gas connected
- Home design: Two-story multi-family house; Residential income property; Fixer / under construction condition; Built circa 1950
- Construction: Block foundation; Shingle roof
- Exterior features: Front porch, screened porch, and rear porch; Chain link fencing in back yard; Shed(s) on the property; Paved city street frontage; public maintained road
Interior
- Kitchen: Both units include a kitchen; Each unit has a dining room
- Bedrooms: Total of 5 bedrooms (Unit 582: 3 bedrooms; Unit 586: 2 bedrooms)
- Flooring: Hardwood flooring; Linoleum flooring
- Bathrooms: 3 bathrooms total (2 full, 1 half)
- Heating & cooling: Baseboard heating; Radiant heating; Steam heating; Natural gas heating
- Interior features: Has unfinished block basement with walk-out access and concrete construction; Private yard
Neighborhood map
What this means for you Summary
Snapshot
- This is a 3 × 3.0-bed/1.5-bath units multifamily listed at $160k. Condition is rated poor.
Deal economics
- At list price, monthly cash flow is $2k ($26k/yr) — positive. Per door: $712/mo.
- The deal already cash-flows at list — no discount required.
- Meets the 1% rule at list price ($4k rent vs $160k).
- Cap rate 22.3% vs local median 8.3% in Plymouth — top-decile yield for the area; either an underpriced asset or a hidden risk that comps aren't pricing in. Stress-test before assuming the spread holds.
Location & tenants
- Location reads 66/100 on livability (#1,068 in PA) — a middle-class / working-renter tenant base. Strengths: cost of living A+, health & safety A+, housing B+; Watch: employment D, crime F, amenities F.
- Hanover Area SD (suburban): math 19% / reading 25% proficiency, ranked #484 of 539 in PA (top 90%) — low school quality limits family demand, transient renter base, plan for 1-2y turnover.
- Market conditions: 81 active listings in the ZIP; 349 units permitted in Luzerne County in 2024 (16 in 5+ unit buildings).
- At $4,104/mo this rent would consume 84% of the median local household income ($59k/yr) (locally 568% of renters already pay >50% of income on rent) — very limited rent-growth headroom before tenants either downsize or default.
Forward outlook
- Local home prices are declining (-3.0%/yr); year-one equity from $1k of loan paydown is wiped out by about $5k of value loss. Plan a longer hold.
- Luzerne County population projected at +4% by 2050 — modest demand growth; plan on rents tracking national, not racing it.
- At projected returns (-3.0% appreciation + 3.0% rent growth), your $45k cash investment doubles in ~2 years — after that, you're playing with house money.
Negotiation context
- Only 9 days on market — expect competitive offers; lowballing is unlikely to land.
Risks & watch-outs
- Watch-outs: built in 1950 — expect roof / HVAC / electrical / plumbing capex.
- Climate carrying-cost: major flood risk — expect insurance premiums to compound above CPI over the hold.
Questions for the listing agent
- Can we see the unit-by-unit rent roll, current vacancy, and any below-market leases? What's the average tenancy length?
- What capital expenditures (roof, boiler, parking lot, exteriors) have been made in the last 5 years, and what's planned in the next 2?
- Have any recent inspections been done? Can we get a copy of the seller's disclosures and any deferred-maintenance estimates?
- Built in 1950 — when were the roof, HVAC, electrical panel, plumbing, and water heater last replaced?
- Is there a deadline driving the sale (1031 exchange, divorce, estate, relocation)? That informs how much negotiation room exists.
- Crime grade is F in this area — have there been break-ins, vandalism, or insurance claims at this property in the last 3 years? What carrier currently insures it and at what premium?
- What's the average days-on-market for RENTAL listings here right now (not sales)? A rising rental-DOM trend means longer vacancies and softer asking-rent achievability than the comps imply.
- What's the recent tenant-quality profile in this submarket — average credit score on applications, eviction rate, late-payment / NSF rate, and stable-employment percentage? A property-management company in the area should have these aggregated.
- How much new apartment / multifamily construction is in the pipeline within 1–3 miles? Heavy new supply (>2% of stock underway) typically softens rents 12–24 months out; light construction supports rent growth.
Investment metrics
- 1% rule
- 2.56% ✓
- Cap rate
- 22.32%
- Cash-on-cash
- 57.23%
- DSCR
- 3.55
- GRM
- 3.2
CMA / ARV
- ARV (median comp)
- $199,192
- List price
- $160,000
- Delta
- -19.68%
- Verdict
- UNDERPRICED
- Comps
- 20 within 1.0 mi
Projected returns pro-forma
-3.0% appreciation · 3.0% rent growth · sell at horizon
- IRR
- 55.7%
- Equity multiple
- 3.46×
- Total profit
- $110,206
- Equity at exit
- $23,857
- IRR
- 60.7%
- Equity multiple
- 7.06×
- Total profit
- $271,430
- Equity at exit
- $13,834
Cash invested: $44,800 (down + closing). Projections, not guarantees.
Landlord ↔ Tenant lean methodology
- Overall (STATE)
- 62 Landlord-Friendly
- State Pennsylvania
- 62 Landlord-Friendly · EVEN
- County
- — inherits STATE
- City
- — inherits STATE
ZIP-level market 18706
- Active inventory
- 81
- Price-to-rent
- 9.7×
Monthly cashflow live
- Estimated rent
- $4,104 high interval (Pro) →
- Mortgage (P&I)
- −$839
- Tax est. 1.5%
- −$200 /mo · $2,400/yr
- Insurance
- −$67
- HOA
- −$0
- Vacancy / Maint / Mgmt
- −$862
- Net cashflow
- $2,136
Break-even live
3-unit breakdown (identical units grouped — click to expand)
| Units | Beds | Baths | Est. rent |
|---|---|---|---|
| 3× units | 3.0 | 1.5 | $4,104 |
| #1 | 3.0 | 1.5 | $1,368 |
| #2 | 3.0 | 1.5 | $1,368 |
| #3 | 3.0 | 1.5 | $1,368 |
| Total (3 units) | $4,104 | ||
UW: 25.0% down · 7.5% · 30yr · 1.5% tax · 5.0% vac · 8.0% maint · 8.0% mgmt
Financing live
Cash to close
- Down payment
- $40,000
- Closing costs
- $4,800
- Reserves months
- —
- Total cash needed
- —
Loan-product check · same deal, 3 products live
Conventional
25% down · 7.5% · 30yr
- Down + closing
- —
- Monthly P&I
- —
- Monthly cashflow
- —
- DSCR
- —
- Eligible?
- —
Personal DTI + credit; lowest rate.
DSCR
20% down · 8.5% · 30yr
- Down + closing
- —
- Monthly P&I
- —
- Monthly cashflow
- —
- DSCR
- —
- Eligible?
- —
No personal income docs; deal must DSCR.
Hard money
10% down · 12.0% · 12mo
- Down + closing
- —
- Monthly P&I
- —
- Monthly cashflow
- —
- DSCR
- —
- Eligible?
- —
Short-term bridge; refi at stabilization.
Listing history 2 events
-
2026-05-09status Pending 1259-char remark
-
2026-04-27$160,000 Active 1259-char remark
ⓘ Source: listings_history table (triggers on properties + properties_extension) + one-shot
backfill from property_details.listing_events for pre-trigger history.
Climate risk First Street
- Flood 6/10 Major FEMA zone X · 27% chance over 30 yrs
- Wildfire 3/10 Moderate
- Heat 4/10 Moderate 7 d/yr ≥96°F today · 16 d/yr by 30 yrs out
- Wind 3/10 Moderate 5% chance of damaging wind over 30 yrs
- Air quality 2/10 Low 1 unhealthy d/yr today · 2 by 30 yrs out
Nearby sold comps map
Loading sold comps map…
Walkable amenities ~0.75 mi
Loading nearby amenities…
Taxation est. · year 1
- Rental income
- $49,248
- − Mortgage interest
- −$8,962
- − Property taxes
- −$2,400
- − Insurance
- −$800
- − Repairs & maintenance
- −$3,940
- − Management
- −$3,940
- − Depreciation
- −$4,655
- Taxable income
- $24,551
- Est. tax owed @ 24.0%
- −$5,892
- After-tax cash flow
- $19,745/yr
For passive investors: Depreciation is non-cash, so a rental often shows a tax loss while cash-flowing — sheltering income. Rental losses are passive: they offset passive income freely, and up to $25,000/yr can offset ordinary (W-2) income if you actively participate and your MAGI is under $100k (phasing out to $0 by $150k); unused losses carry forward. On sale, claimed depreciation is recaptured at up to 25%, and gains may owe capital-gains tax (a 1031 exchange can defer both). Figures are a year-1 estimate at your 24.0% rate — not tax advice; consult a CPA.
Condition & rehab AI · 12 photos
This property requires extensive renovation, including kitchen and bathroom updates, structural repairs, and landscaping. The potential for significant value increase makes it a strong investment opportunity.
Repairs flagged
- Major Exposed wiring — Safety hazard
- Major Exposed plumbing — Leak risk
- Major Missing cabinets — No storage
- Major Missing countertops — No cooking surface
- Major Missing appliances — No functionality
- Major Missing fixtures — No functionality
- Major Missing flooring — No comfort
- Major Exposed drywall — Structural integrity risk
- Major Peeling paint — Aesthetic issue
Value-add opportunities
- Both Kitchen renovation — Modern kitchen increases both resale and rental value
- Both Bathroom renovation — Modern bathrooms increase both resale and rental value
- Both Exterior painting and landscaping — Enhances curb appeal and property value
- Both Structural repairs — Ensures safety and structural integrity
Renovation cost estimate screening
| Repair item | Severity | Est. cost |
|---|---|---|
| Exposed wiring · Safety hazard | Major | $15,000–50,000 |
| Exposed plumbing · Leak risk | Major | $15,000–50,000 |
| Missing cabinets · No storage | Major | $15,000–50,000 |
| Missing countertops · No cooking surface | Major | $15,000–50,000 |
| Missing appliances · No functionality | Major | $15,000–50,000 |
| Missing fixtures · No functionality | Major | $15,000–50,000 |
| Missing flooring · No comfort | Major | $15,000–50,000 |
| Exposed drywall · Structural integrity risk | Major | $15,000–50,000 |
| Peeling paint · Aesthetic issue | Major | $15,000–50,000 |
| Total estimated repair cost · 9 items | $135,000–450,000 |
Value-add ROI direction
- Both Kitchen renovation — Modern kitchen increases both resale and rental value ↑
- Both Bathroom renovation — Modern bathrooms increase both resale and rental value ↑
- Both Exterior painting and landscaping — Enhances curb appeal and property value ↑
- Both Structural repairs — Ensures safety and structural integrity ↑
ⓘ Cost ranges are severity-bucket heuristics (US national rule-of-thumb). Get contractor quotes + a written scope before underwriting a rehab budget.
Schools (NCES district)
- District
- Hanover Area SD
- NCES district ID
- 4211420
- Math proficiency
- 19% ▼ -3.00%
- Reading proficiency
- 25% ▼ -21.00%
- Median HH income
- $40,015
- Composite
- 18.6/100
- National rank
- #8903
- State rank
- #484 of 539 in PA
Livability — Plymouth
- Score
- 66/100
- State rank
- #1068
- US rank
- #12056
Category grades
Schools grade is shown separately in the Schools card above.
Census & demographics
- County
- Luzerne County · 118,885 people
- Metro
- Scranton--Wilkes-Barre, PA
- Population (ZIP)
- 16,387
- Household income
- $58,558
- Rent vs Own
- Severe rent burden
- 568.0
Population outlook (Luzerne County) Hauer SSP2
- Today (2025)
- 319,505 people
- By 2030
- 319,943 · +0.1%
- By 2040
- 322,643 · +1.0%
- By 2050
- 330,817 · +3.5%
- By 2075
- 379,145 · +18.7%
- By 2100
- 431,908 · +35.2%
Race, ethnicity, and origin ACS 2023
- Neighborhood character
- Predominantly White (76%)
- Race & ethnicity
- White 76% Hispanic / Latino 17% Two or more races 11% Black 3%
- Hispanic origin (detail)
- Puerto Rican 9% Dominican 4%
- Common ancestry
- Romanian 18% Scotch-Irish 3% Subsaharan African 1%
- Foreign-born
- 6% · Canada
- Languages at home
- 88% English-only · Spanish 10% Other Asian/Pacific 1%
Political lean MEDSL · Luzerne
- 2024 margin
- R (+19.2) · D 40.0% · R 59.2%
- 2008→2024 swing
- -27.6pp toward R · 2008: 8.4pp · 2024: -19.2pp
- All cycles
- 2024: R+19.2 2020: R+14.4 2016: R+19.6 2012: D+4.8 2008: D+8.4
Not yet ingested
- Civics
- —
Market trends
- HPI YoY
- ▼ -150.02%
- Current HPI
- 196.19
- Rent YoY
- —
- Metro
- Scranton--Wilkes-Barre, PA
- State GDP YoY
- ▲ 1.68%
- F500 in state
- 34
Industry mix (Fortune 500 HQ in PA)
| Industry | F500 HQs | Revenue |
|---|---|---|
| Healthcare | 2 | $309B |
|
||
| Insurance | 2 | $27B |
|
||
| Telecommunications / Media | 1 | $124B |
|
||
| Industrial Distribution | 1 | $22B |
|
||
| Financial Services | 1 | $20B |
|
||
| Chemicals / Materials | 1 | $18B |
|
||
Price history
2 events — show timeline
- 2026-05-09 Pending — GSBR as distributed by MLS GRID
- 2026-04-27 Listed $160,000 GSBR as distributed by MLS GRID
Cash-flow waterfall
monthlySold comps — $/sqft
last 12 mo · ≤1 miLoading sold comps…