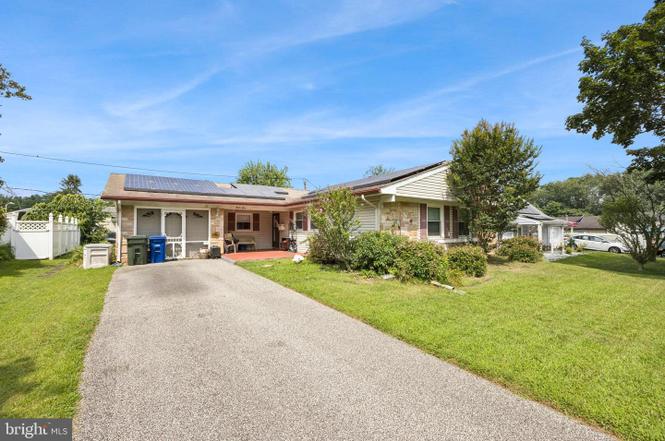
41 Holiday Ln · Burlington, NJ
Flood risk 1/10 · Minimal
- FEMA flood zone
- X (unshaded)
- Chance of flooding over 30 yrs
- 0.0%
- Est. flood insurance / yr
- $507 – $1,088
Fire risk 1/10 · Minimal
- Est. fire insurance / yr
- $526 – $976
Heat risk 6/10 · Moderate
- Hot days now (above 103°F)
- 7 days/yr
- Hot days in 30 yrs
- 15 days/yr
Wind risk 6/10 · Moderate
- Chance of severe wind over 30 yrs
- 27.0%
Air-quality risk 4/10 · Minor
- Unhealthy air days now
- 5 days/yr
- Unhealthy air days in 30 yrs
- 7 days/yr
Risk factors via First Street. Map © Google.
Why this score? — see what drove the D grade
The composite is a weighted blend of 9 inputs, each scored 0–100. Each bar is that input's sub-score; the figure is the points it added to the 100-point composite (weight × sub-score).
- Cash flow +14.0/30.0
- ARV discount +10.1/15.0
- 1% rule +4.5/10.0
- DSCR +4.3/10.0
- Livability +3.9/5.0
- Rent growth +2.5/5.0
- Condition / age +2.5/5.0
- Schools +1.7/10.0
- Appreciation +0.0/10.0
$330,000
🖨 Deal sheet 📄 Offer letter ✓ Due diligence
Listing remarks
Welcome home to 41 Holiday Lane! This well-maintained and affordably priced home is perfectly positioned in a central location—just a short drive to Philadelphia, the Jersey Shore, and New York City. Ideal for commuters or anyone looking for easy access to major highways, including I-295, this home combines comfort, convenience, and value. Start your mornings enjoying coffee on the screened-in back porch, where you can relax and take in the peaceful surroundings. The spacious backyard is perfect for entertaining, gardening, or simply enjoying the outdoors in your own private retreat. Inside, you'll find a spacious and inviting layout, perfect for relaxing or entertaining. Whether you'
Key facts
- Spacious backyard
- Close to dining
- Private retreat
Tags
Property features AI
Exterior
- Utilities: Public water; Public sewer; Natural gas for heating, cooling, and hot water; Leased PV solar array(s)
- Home design: Detached property; Good to average condition; Fee simple ownership
- Construction: Brick construction; Shingle roof; Slab foundation; Built year per assessor
- Exterior features: 65 x 100 lot dimensions; Not in tidal water area; Located in FEMA Flood Zone X
Interior
- Bedrooms: 3 bedrooms on the main level
- Flooring: Carpet; Laminate plank
- Bathrooms: 2 full bathrooms on the main level
- Heating & cooling: Forced air heating (natural gas); Central air conditioning (natural gas)
- Interior features: Drywall walls and ceilings
- Laundry & utility: Main-floor laundry
Neighborhood map
What this means for you Summary
Snapshot
- This is a 3-bed/2.0-bath single-family listed at $330k.
Deal economics
- At list price, monthly cash flow is $45 ($543/yr) — positive.
- The deal already cash-flows at list — no discount required.
- To meet the 1% rule (rent ≥ 1% of price), the offer needs to be $312k (5.3% below list).
- Recommended offer: $290k (12.0% below list) — sets the bar for market timing.
- Cap rate 6.5% vs local median 4.6% in Burlington — top-decile yield for the area; either an underpriced asset or a hidden risk that comps aren't pricing in. Stress-test before assuming the spread holds.
Location & tenants
- Location reads 78/100 on livability (#89 in NJ, #2,359 nationally) — a middle-class / working-renter tenant base. Strengths: housing A+, health & safety A+, cost of living A-; Watch: amenities F.
- Willingboro Public School District (suburban): math 5% / reading 30% proficiency, ranked #433 of 472 in NJ (top 92%) — low school quality limits family demand, transient renter base, plan for 1-2y turnover.
- Zoned schools: Hawthorne Park Elementary School (math 8% / reading 27%, grade F, #1,065 of 1,303 statewide, top 83%, 392 students, 10% FRL); Willingboro Memorial Middle School (math 5% / reading 34%, grade F, #398 of 431 statewide, top 93%, 600 students, 8% FRL); Willingboro High School (math 2% / reading 37%, grade F, #354 of 399 statewide, top 89%, 842 students, 0% FRL) — zoned schools average 6% FRL vs 48% district-wide (42 pts lower); this property's tenant base skews higher-income than the district average.
- Market conditions: 151 active listings in the ZIP; 12 comparable units currently listed for rent nearby; rentals leasing fast (median 1d on market — plan ~1-2 weeks tenant-placement turnaround); solid renter incomes; 2,161 units permitted in Burlington County in 2024 (988 in 5+ unit buildings).
- This rent runs 38% of the median local income ($98k/yr) — at the standard rent-burdened threshold; future hikes will face affordability resistance.
Forward outlook
- Local home prices are declining (-3.0%/yr); year-one equity from $2k of loan paydown is wiped out by about $10k of value loss. Plan a longer hold.
- Burlington County population projected to shrink 5% by 2050 — rents likely to lag national; underwrite the cash flow, not the appreciation.
Negotiation context
- It's been on market 179 days — a 12% lower offer ($290k) is reasonable based on typical stale-listing flexibility.
- 2 sale attempts with the ask held roughly flat each time — persistent listings suggest the price (not the market) is what's stuck; bring a comps-based counter.
Risks & watch-outs
- Climate carrying-cost: major wind risk, 27% chance of damaging wind over 30y; extreme-heat days projected 7→15/yr by 2055 (HVAC capex compounding) — expect insurance premiums to compound above CPI over the hold.
Questions for the listing agent
- It's been on market 179 days. Have you received any prior offers? Is the seller open to a 12% concession, seller financing, or rate buy-down credit?
- Built in 1963 — when were the roof, HVAC, electrical panel, plumbing, and water heater last replaced?
- Why hasn't it sold? Are there any deal-killer items the seller is aware of (foundation, flood, title, zoning, code violations)?
- Is there a deadline driving the sale (1031 exchange, divorce, estate, relocation)? That informs how much negotiation room exists.
- The area grade is low — what's the realistic commute time and amenity access for the typical tenant pool here? Any planned neighborhood developments (good or bad) we should know about?
- What's the average days-on-market for RENTAL listings here right now (not sales)? A rising rental-DOM trend means longer vacancies and softer asking-rent achievability than the comps imply.
- What's the recent tenant-quality profile in this submarket — average credit score on applications, eviction rate, late-payment / NSF rate, and stable-employment percentage? A property-management company in the area should have these aggregated.
- How much new for-sale + rental construction is in the pipeline within 1–3 miles? Heavy new supply typically softens prices + rents 12–24 months out; constrained supply supports both.
Investment metrics
- 1% rule
- 0.95% ✗
- Cap rate
- 6.46%
- Cash-on-cash
- 0.59%
- DSCR
- 1.03
- GRM
- 8.8
CMA / ARV
- ARV (on-the-fly)
- $350,110
- Comps found
- 12
Show comp detail 12 sales within ~0.75 mi
| Address | Dist | Beds/Ba | Sqft | Sold | Price | $/sf | Match |
|---|---|---|---|---|---|---|---|
| 86 E River Dr | 0.39mi | 4/2.0 (+1) | 1,573 (+0%) | 3mo | $265,000 | $168 | 74 |
| 34 E River Dr | 0.20mi | 3/2.0 | 1,438 (-8%) | 4mo | $306,000 | $213 | 74 |
| 534 Charleston Rd | 0.30mi | 3/2.0 | 1,444 (-8%) | 2mo | $407,000 | $282 | 71 |
| 41 Eastgate Ln | 0.44mi | 3/2.0 | 1,438 (-8%) | 2mo | $385,000 | $268 | 64 |
| 16 Echohill Ln | 0.27mi | 3/2.0 | 1,776 (+13%) | 3mo | $310,000 | $175 | 63 |
| 78 Gainscott Ln | 0.46mi | 4/2.0 (+1) | 1,705 (+9%) | 2mo | $379,999 | $223 | 58 |
| 283 Northampton Dr | 0.64mi | 4/2.0 (+1) | 1,500 (-4%) | 0mo | $380,000 | $253 | 57 |
| 12 Neptune Ln | 0.63mi | 4/2.0 (+1) | 1,497 (-5%) | 2mo | $325,000 | $217 | 56 |
| 43 Elsin Ln | 0.35mi | 4/2.0 (+1) | 1,770 (+13%) | 3mo | $415,000 | $234 | 55 |
| 65 Barnwell Ln | 0.68mi | 4/2.0 (+1) | 1,624 (+3%) | 4mo | $257,000 | $158 | 54 |
| 31 Henderson Ln | 0.71mi | 3/2.0 | 1,696 (+8%) | 1mo | $280,000 | $165 | 52 |
| 10 Hancock Ln | 0.59mi | 3/2.5 | 1,799 (+15%) | 1mo | $415,000 | $231 | 46 |
Match score weights: distance 35% · size 25% · config 20% · recency 20%. Top-matched comps best support the ARV.
Projected returns pro-forma
-3.0% appreciation · 3.0% rent growth · sell at horizon
- IRR
- -15.3%
- Equity multiple
- 0.45×
- Total profit
- $-50,458
- Equity at exit
- $49,204
- IRR
- -6.7%
- Equity multiple
- 0.57×
- Total profit
- $-39,680
- Equity at exit
- $28,532
Cash invested: $92,400 (down + closing). Projections, not guarantees.
Landlord ↔ Tenant lean methodology
- Overall (STATE)
- 21 Tenant-Leaning
- State New Jersey
- 21 Tenant-Leaning · D+6
- County
- — inherits STATE
- City
- — inherits STATE
ZIP-level market 08046
- Active inventory
- 151
- Price-to-rent
- 8.8×
Monthly cashflow live
- Estimated rent
- $3,124 high interval (Pro) →
- Mortgage (P&I)
- −$1,731
- Tax from tax record
- −$555 /mo · $6,660/yr
- Insurance
- −$138
- HOA
- −$0
- Vacancy / Maint / Mgmt
- −$656
- Net cashflow
- $45
Break-even live
UW: 25.0% down · 7.5% · 30yr · 1.5% tax · 5.0% vac · 8.0% maint · 8.0% mgmt
Financing live
Cash to close
- Down payment
- $82,500
- Closing costs
- $9,900
- Reserves months
- —
- Total cash needed
- —
Loan-product check · same deal, 3 products live
Conventional
25% down · 7.5% · 30yr
- Down + closing
- —
- Monthly P&I
- —
- Monthly cashflow
- —
- DSCR
- —
- Eligible?
- —
Personal DTI + credit; lowest rate.
DSCR
20% down · 8.5% · 30yr
- Down + closing
- —
- Monthly P&I
- —
- Monthly cashflow
- —
- DSCR
- —
- Eligible?
- —
No personal income docs; deal must DSCR.
Hard money
10% down · 12.0% · 12mo
- Down + closing
- —
- Monthly P&I
- —
- Monthly cashflow
- —
- DSCR
- —
- Eligible?
- —
Short-term bridge; refi at stabilization.
Rent comps 12 comps
| Address | Beds | Baths | Sqft | Rent | $/sqft | DOM | Units | Dist |
|---|---|---|---|---|---|---|---|---|
| 16 Elridge Ln Willingboro, NJ | 3.0 | 2.0 | 1350 | $2,650 | $1.96 | 1d | 1 | 0.36mi |
| 89 Hampshire Ln Willingboro, NJ | 4.0 | 2.0 | 1562 | $3,400 | $2.18 | 10d | 1 | 0.56mi |
| 89 Oakcrest Ln Westampton, NJ | 2.0 | 1.5 | 1358 | $2,500 | $1.84 | 1d | 1 | 0.66mi |
| 34 Hopkins Ln Willingboro, NJ | 3.0 | 2.0 | 1696 | $3,200 | $1.89 | 1d | 1 | 0.83mi |
| 10 Melville Ln Willingboro, NJ | 4.0 | 2.5 | 1797 | $3,000 | $1.67 | 14d | 1 | 0.89mi |
| 29 Hinsdale Ln Willingboro, NJ | 4.0 | 2.0 | 1570 | $3,750 | $2.39 | 1d | 1 | 0.97mi |
| 4 Elliot Ln Westampton, NJ | 3.0 | 2.5 | 1500 | $2,900 | $1.93 | 1d | 1 | 1.03mi |
| 62 Sharpless Blvd Westampton, NJ | 3.0 | 1.5 | 1490 | $2,275 | $1.53 | 1d | 1 | 1.06mi |
| 48 Marboro Ln Willingboro, NJ | 4.0 | 2.0 | 1497 | $3,995 | $2.67 | 3d | 1 | 1.13mi |
| 1 Mystic Way Willingboro, NJ | 4.0 | 2.5 | 1952 | $3,000 | $1.54 | 5d | 1 | 1.14mi |
| 17 Bonnie Ln Willingboro, NJ | 4.0 | 2.5 | 1797 | $2,890 | $1.61 | 24d | 1 | 1.15mi |
| 106 Whaler Way Burlington, NJ | 1.0–3.0 | 1.0 | 932 | $2,585 | $2.77 | 1d | 1 | 1.38mi |
Listing history 8 events
-
2026-05-18status Pending
-
2026-05-13historical Active Under Contract
-
2026-04-13price $330,000
-
2026-02-19status Active
-
2025-11-11status Pending
-
2025-11-05historical Active Under Contract
-
2025-08-21price $339,000
-
2025-08-01$345,000 Active
ⓘ Source: listings_history table (triggers on properties + properties_extension) + one-shot
backfill from property_details.listing_events for pre-trigger history.
Tax reassessment forecast NJ · Partial reset (capped growth)
- Current annual tax
- $6,660 · $555/mo
- Projected year-2 tax
- $7,439 · $620/mo
- Expected delta
- +$778/yr (+$65/mo · 11.7%)
ⓘ Screening estimate from a state-policy table — verify with the county assessor before closing.
Climate risk First Street
- Flood 1/10 Low FEMA zone X (unshaded) · 0% chance over 30 yrs
- Wildfire 1/10 Low
- Heat 6/10 Major 7 d/yr ≥103°F today · 15 d/yr by 30 yrs out
- Wind 6/10 Major 27% chance of damaging wind over 30 yrs
- Air quality 4/10 Moderate 5 unhealthy d/yr today · 7 by 30 yrs out
Nearby sold comps map
Loading sold comps map…
Walkable amenities ~0.75 mi
Loading nearby amenities…
Taxation est. · year 1
- Rental income
- $37,494
- − Mortgage interest
- −$18,485
- − Property taxes
- −$6,660
- − Insurance
- −$1,650
- − Repairs & maintenance
- −$2,999
- − Management
- −$2,999
- − Depreciation
- −$9,600
- Taxable loss
- −$4,901
- Est. tax savings @ 24.0%
- +$1,176
- After-tax cash flow
- $1,719/yr
For passive investors: Depreciation is non-cash, so a rental often shows a tax loss while cash-flowing — sheltering income. Rental losses are passive: they offset passive income freely, and up to $25,000/yr can offset ordinary (W-2) income if you actively participate and your MAGI is under $100k (phasing out to $0 by $150k); unused losses carry forward. On sale, claimed depreciation is recaptured at up to 25%, and gains may owe capital-gains tax (a 1031 exchange can defer both). Figures are a year-1 estimate at your 24.0% rate — not tax advice; consult a CPA.
Schools (NCES district)
- District
- Willingboro Public School District
- NCES district ID
- 3418000
- Math proficiency
- 5% ▼ -11.00%
- Reading proficiency
- 30% ▼ -1.00%
- Median HH income
- $67,064
- Composite
- 17.37/100
- National rank
- #9074
- State rank
- #433 of 472 in NJ
Livability — Burlington
- Score
- 78/100
- State rank
- #89
- US rank
- #2359
Category grades
Schools grade is shown separately in the Schools card above.
Census & demographics
- County
- Burlington County · 323,710 people
- Metro
- Philadelphia-Camden-Wilmington, PA-NJ-DE-MD
- Population (ZIP)
- 31,981
- Household income
- $98,178
- Rent vs Own
- Severe rent burden
- 342.0
Population outlook (Burlington County) Hauer SSP2
- Today (2025)
- 453,425 people
- By 2030
- 452,359 · -0.2%
- By 2040
- 445,033 · -1.9%
- By 2050
- 431,760 · -4.8%
- By 2075
- 406,277 · -10.4%
- By 2100
- 364,732 · -19.6%
Race, ethnicity, and origin ACS 2023
- Neighborhood character
- Predominantly Black (66%)
- Race & ethnicity
- Black 66% Hispanic / Latino 15% Two or more races 14% White 10%
- Hispanic origin (detail)
- Puerto Rican 9% Dominican 2%
- Common ancestry
- Swiss 4% Romanian 2% Hispanic 1%
- Foreign-born
- 15% · Canada, Jamaica
- Languages at home
- 82% English-only · Spanish 10% French/Haitian/Cajun 2% Other Indo-European 1%
Political lean MEDSL · Burlington
- 2024 margin
- D (+16.6) · D 57.6% · R 41.0% · Other 1.3%
- 2008→2024 swing
- -2.0pp toward R · 2008: 18.6pp · 2024: 16.6pp
- All cycles
- 2024: D+16.6 2020: D+19.5 2016: D+14.8 2012: D+18.7 2008: D+18.6
Not yet ingested
- Civics
- —
Market trends
- HPI YoY
- ▼ -273.52%
- Current HPI
- 348.3441
- Rent YoY
- —
- Metro
- Philadelphia-Camden-Wilmington, PA-NJ-DE-MD
- State GDP YoY
- ▲ 2.05%
- F500 in state
- 34
Industry mix (Fortune 500 HQ in NJ)
| Industry | F500 HQs | Revenue |
|---|---|---|
| Consumer Goods | 3 | $31B |
|
||
| Pharmaceuticals | 2 | $153B |
|
||
| Technology | 2 | $21B |
|
||
| Insurance | 2 | $20B |
|
||
| Healthcare | 2 | $19B |
|
||
| Financial Services | 1 | $70B |
|
||
Price history
-4.3% since first listed8 events — show timeline
- 2026-05-18 Pending — BRIGHT MLS
- 2026-05-13 Contingent — BRIGHT MLS
- 2026-04-13 Price Changed $330,000 BRIGHT MLS
- 2026-02-19 Relisted — BRIGHT MLS
- 2025-11-11 Pending — BRIGHT MLS
- 2025-11-05 Contingent — BRIGHT MLS
- 2025-08-21 Price Changed $339,000 BRIGHT MLS
- 2025-08-01 Listed $345,000 BRIGHT MLS
Property tax history
+2.6%/yrLatest (2025): $6,660 · +2.0% YoY. Source: county tax records.
Cash-flow waterfall
monthlySold comps — $/sqft
last 12 mo · ≤1 miLoading sold comps…