29402 685th Ave · Laona, MN
Flood risk 1/10 · Minimal
- FEMA flood zone
- X (unshaded)
- Chance of flooding over 30 yrs
- 0.0%
- Est. flood insurance / yr
- $507 – $1,088
Fire risk 4/10 · Minor
- Est. fire insurance / yr
- $888 – $1,650
Heat risk 1/10 · Minimal
- Hot days now (above 93°F)
- 7 days/yr
- Hot days in 30 yrs
- 11 days/yr
Wind risk 1/10 · Minimal
- Chance of severe wind over 30 yrs
- —
Air-quality risk 3/10 · Minor
- Unhealthy air days now
- 3 days/yr
- Unhealthy air days in 30 yrs
- 3 days/yr
Risk factors via First Street. Map © Google.
Why this score? — see what drove the B+ grade
The composite is a weighted blend of 9 inputs, each scored 0–100. Each bar is that input's sub-score; the figure is the points it added to the 100-point composite (weight × sub-score).
- Cash flow +30.0/30.0
- 1% rule +10.0/10.0
- DSCR +10.0/10.0
- ARV discount +7.5/15.0
- Appreciation +7.5/10.0
- Schools +4.1/10.0
- Rent growth +2.5/5.0
- Livability +2.5/5.0
- Condition / age +2.5/5.0
$49,000
🖨 Deal sheet 📄 Offer letter ✓ Due diligence
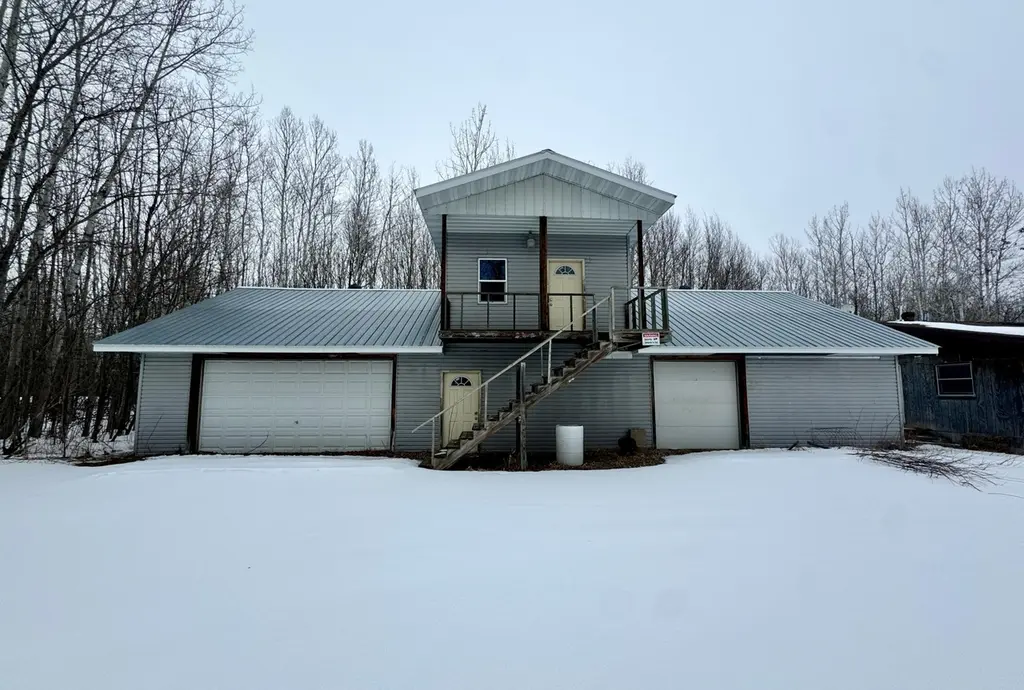
Listing remarks
GARAGE SPACE! 3 bedroom, 1 bath manufactured home on 3 acres off a quiet road in Roosevelt. 32x64 garage for storing toys, cars or use as a space to create, tinker or build. The home is in need of repair (sold as-is) and is priced accordingly. Seller would consider a Contract for Deed. Bring your tools - a great opportunity for the right buyer!
Key facts
- Quiet road
- 3 acres
- 32x64 garage
Tags
Neighborhood map
What this means for you Summary
Snapshot
- This is a 3-bed/1.0-bath manufactured listed at $49k.
Deal economics
- At list price, monthly cash flow is $617 ($7k/yr) — positive.
- The deal already cash-flows at list — no discount required.
- Meets the 1% rule at list price ($1k rent vs $49k).
Location & tenants
- Location reads: area grade B — affects rentability + tenant quality, not the cash-flow math above.
- Warroad Public School District (rural): math 42% / reading 53% proficiency, ranked #153 of 301 in MN (top 51%) — families likely to look elsewhere, expect single-tenant / working-renter base with shorter leases.
- Market conditions: 9 active listings in the ZIP; 49 units permitted in Roseau County in 2024 (15 in 5+ unit buildings).
Forward outlook
- In year one you build about $3k of equity ($339 loan paydown + $2k appreciation (5.0% local appreciation)).
- Roseau County population projected to shrink 7% by 2050 — rents likely to lag national; underwrite the cash flow, not the appreciation.
- At projected returns (5.0% appreciation + 3.0% rent growth), your $14k cash investment doubles in ~2 years — after that, you're playing with house money.
Negotiation context
- Only 5 days on market — expect competitive offers; lowballing is unlikely to land.
- 4 sale attempts since 18y ago with the ask held roughly flat each time — persistent listings suggest the price (not the market) is what's stuck; bring a comps-based counter.
- Current owner paid $32k; list at $49k implies a 53% gain — meaningful room to come down on a strong offer.
Questions for the listing agent
- Built in 1977 — when were the roof, HVAC, electrical panel, plumbing, and water heater last replaced?
- Is there a deadline driving the sale (1031 exchange, divorce, estate, relocation)? That informs how much negotiation room exists.
- What's the average days-on-market for RENTAL listings here right now (not sales)? A rising rental-DOM trend means longer vacancies and softer asking-rent achievability than the comps imply.
- What's the recent tenant-quality profile in this submarket — average credit score on applications, eviction rate, late-payment / NSF rate, and stable-employment percentage? A property-management company in the area should have these aggregated.
- How much new for-sale + rental construction is in the pipeline within 1–3 miles? Heavy new supply typically softens prices + rents 12–24 months out; constrained supply supports both.
Investment metrics
- 1% rule
- 2.51% ✓
- Cap rate
- 21.41%
- Cash-on-cash
- 54.00%
- DSCR
- 3.40
- GRM
- 3.3
CMA / ARV
No comps found within radius.
Projected returns pro-forma
4.96% appreciation · 3.0% rent growth · sell at horizon
- IRR
- 61.3%
- Equity multiple
- 4.68×
- Total profit
- $50,535
- Equity at exit
- $27,652
- IRR
- 59.1%
- Equity multiple
- 9.66×
- Total profit
- $118,883
- Equity at exit
- $47,628
Cash invested: $13,720 (down + closing). Projections, not guarantees.
Landlord ↔ Tenant lean methodology
- Overall (STATE)
- 46 Balanced
- State Minnesota
- 46 Balanced · D+2
- County
- — inherits STATE
- City
- — inherits STATE
ZIP-level market 56673
- Home prices YoY
- 3.5%
- Active inventory
- 9
- Price-to-rent
- 3.3×
Monthly cashflow live
- Estimated rent
- $1,228 medium interval (Pro) →
- Mortgage (P&I)
- −$257
- Tax from tax record
- −$75 /mo · $904/yr
- Insurance
- −$20
- HOA
- −$0
- Vacancy / Maint / Mgmt
- −$258
- Net cashflow
- $617
Break-even live
UW: 25.0% down · 7.5% · 30yr · 1.5% tax · 5.0% vac · 8.0% maint · 8.0% mgmt
Financing live
Cash to close
- Down payment
- $12,250
- Closing costs
- $1,470
- Reserves months
- —
- Total cash needed
- —
Loan-product check · same deal, 3 products live
Conventional
25% down · 7.5% · 30yr
- Down + closing
- —
- Monthly P&I
- —
- Monthly cashflow
- —
- DSCR
- —
- Eligible?
- —
Personal DTI + credit; lowest rate.
DSCR
20% down · 8.5% · 30yr
- Down + closing
- —
- Monthly P&I
- —
- Monthly cashflow
- —
- DSCR
- —
- Eligible?
- —
No personal income docs; deal must DSCR.
Hard money
10% down · 12.0% · 12mo
- Down + closing
- —
- Monthly P&I
- —
- Monthly cashflow
- —
- DSCR
- —
- Eligible?
- —
Short-term bridge; refi at stabilization.
Listing history 7 events
-
2026-03-23status Pending
-
2026-03-17$49,000 Active
-
2025-06-27soldstatus $32,000
-
2012-02-13soldstatus $20,000
-
2011-01-21$20,000
-
2009-10-21$20,000
-
2008-08-12$29,000
ⓘ Source: listings_history table (triggers on properties + properties_extension) + one-shot
backfill from property_details.listing_events for pre-trigger history.
Tax reassessment forecast MN · Partial reset (capped growth)
- Current annual tax
- $904 · $75/mo
- Projected year-2 tax
- $904 · $75/mo
- Expected delta
- $0/yr ($0/mo · 0.0%)
ⓘ Screening estimate from a state-policy table — verify with the county assessor before closing.
Climate risk First Street
- Flood 1/10 Low FEMA zone X (unshaded) · 0% chance over 30 yrs
- Wildfire 4/10 Moderate
- Heat 1/10 Low 7 d/yr ≥93°F today · 11 d/yr by 30 yrs out
- Wind 1/10 Low
- Air quality 3/10 Moderate 3 unhealthy d/yr today · 3 by 30 yrs out
Nearby sold comps map
Loading sold comps map…
Walkable amenities ~0.75 mi
Loading nearby amenities…
Taxation est. · year 1
- Rental income
- $14,736
- − Mortgage interest
- −$2,745
- − Property taxes
- −$904
- − Insurance
- −$245
- − Repairs & maintenance
- −$1,179
- − Management
- −$1,179
- − Depreciation
- −$1,425
- Taxable income
- $7,059
- Est. tax owed @ 24.0%
- −$1,694
- After-tax cash flow
- $5,715/yr
For passive investors: Depreciation is non-cash, so a rental often shows a tax loss while cash-flowing — sheltering income. Rental losses are passive: they offset passive income freely, and up to $25,000/yr can offset ordinary (W-2) income if you actively participate and your MAGI is under $100k (phasing out to $0 by $150k); unused losses carry forward. On sale, claimed depreciation is recaptured at up to 25%, and gains may owe capital-gains tax (a 1031 exchange can defer both). Figures are a year-1 estimate at your 24.0% rate — not tax advice; consult a CPA.
Schools (NCES district)
- District
- Warroad Public School District
- NCES district ID
- 2741850
- Math proficiency
- 42% ▼ -7.00%
- Reading proficiency
- 53% ▼ -14.00%
- Median HH income
- $49,106
- Composite
- 40.59/100
- National rank
- #3697
- State rank
- #153 of 301 in MN
Livability — Laona
No livability data for this city. (Only ~50 U.S. cities are tracked.)
Census & demographics
- Population (ZIP)
- 608
Population outlook (Roseau County) Hauer SSP2
- Today (2025)
- 15,709 people
- By 2030
- 15,559 · -1.0%
- By 2040
- 15,168 · -3.4%
- By 2050
- 14,539 · -7.4%
- By 2075
- 13,430 · -14.5%
- By 2100
- 11,713 · -25.4%
Race, ethnicity, and origin ACS 2023
- Neighborhood character
- Predominantly White (94%)
- Race & ethnicity
- White 94% Two or more races 5%
- Common ancestry
- Portuguese 17% Lithuanian 7% Scottish 5%
- Languages at home
- 97% English-only · Russian/Polish/Slavic 3%
Political lean MEDSL · Roseau
- 2024 margin
- Solid R (+49.3) · D 24.7% · R 74.0% · Other 1.3%
- 2008→2024 swing
- -31.9pp toward R · 2008: -17.4pp · 2024: -49.3pp
- All cycles
- 2024: R+49.3 2020: R+46.0 2016: R+46.3 2012: R+22.3 2008: R+17.4
Not yet ingested
- Civics
- —
Market trends
- HPI YoY
- ▲ 4.96%
- Current HPI
- 146.8293
- Rent YoY
- —
- Metro
- —
- State GDP YoY
- ▲ 2.41%
- F500 in state
- 34
Industry mix (Fortune 500 HQ in MN)
| Industry | F500 HQs | Revenue |
|---|---|---|
| Healthcare | 2 | $407B |
|
||
| Retail | 2 | $150B |
|
||
| Consumer Goods | 2 | $32B |
|
||
| Industrial Machinery | 2 | $6B |
|
||
| Agriculture | 1 | $40B |
|
||
| Healthcare / Medical Devices | 1 | $32B |
|
||
Price history
+69.0% since first listed7 events — show timeline
- 2026-03-23 Pending — NORTHSTARMLS as Distributed by MLS Grid
- 2026-03-17 Listed $49,000 NORTHSTARMLS as Distributed by MLS Grid
- 2025-06-27 Sold (Public Records) $32,000 Public Records
- 2012-02-13 Sold (MLS) $20,000 NORTHSTARMLS as Distributed by MLS Grid
- 2011-01-21 Listed $20,000 NORTHSTARMLS as Distributed by MLS Grid
- 2009-10-21 Listed $20,000 NORTHSTARMLS as Distributed by MLS Grid
- 2008-08-12 Listed $29,000 NORTHSTARMLS as Distributed by MLS Grid
Property tax history
+3.9%/yrLatest (2026): $904 · +7.9% YoY. Source: county tax records.
Cash-flow waterfall
monthlySold comps — $/sqft
last 12 mo · ≤1 miLoading sold comps…