406 S Church St #416 · St. Peters, MO
Flood risk 1/10 · Minimal
- FEMA flood zone
- X (unshaded)
- Chance of flooding over 30 yrs
- 0.0%
- Est. flood insurance / yr
- $507 – $1,088
Fire risk 1/10 · Minimal
- Est. fire insurance / yr
- $1,054 – $1,958
Heat risk 5/10 · Moderate
- Hot days now (above 108°F)
- 7 days/yr
- Hot days in 30 yrs
- 21 days/yr
Wind risk 2/10 · Minimal
- Chance of severe wind over 30 yrs
- 1.0%
Air-quality risk 2/10 · Minimal
- Unhealthy air days now
- 2 days/yr
- Unhealthy air days in 30 yrs
- 2 days/yr
Risk factors via First Street. Map © Google.
Why this score? — see what drove the D grade
The composite is a weighted blend of 9 inputs, each scored 0–100. Each bar is that input's sub-score; the figure is the points it added to the 100-point composite (weight × sub-score).
- Cash flow +11.8/30.0
- ARV discount +7.5/15.0
- 1% rule +5.2/10.0
- Schools +5.1/10.0
- DSCR +3.5/10.0
- Rent growth +3.2/5.0
- Livability +2.5/5.0
- Condition / age +2.5/5.0
- Appreciation +0.0/10.0
$175,000
🖨 Deal sheet (PDF) 📄 Offer letter ✓ Due diligence
Listing remarks MLS
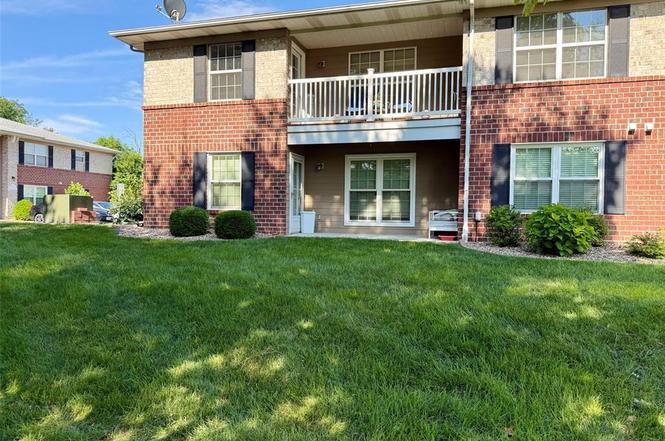
Welcome home to this Quaint, 2 Bedroom, 2 Bathroom Condo in the heart of St. Peters! Enjoy this Meticulously Maintained, Ground Level, Corner unit ready for new owners! This no step entry unit has an Open Floor Plan, Nice entry foyer, Large Kitchen w/ample Cabinets, Tile Backsplash, Refrigerator that stays and walks out to private, covered back patio overlooking grassy area. Master Bedroom Suite Features LARGE walk-in closet, Ceiling Fan, and Master Bath is professionally tiled. Oversized guest bedroom with lots of closet space, and tons of natural light. Guest Bathroom is Spacious w/large linen cabinet. Laundry Room offers an abundant amount of space with plenty of shelving plus washer and dryer stay! Westbury Place is close restaurants, shopping, coffee shops, hospital and parks and offers picnic / BBQ area to be used by owners and family. You won't want to miss out on this one!
Key facts
- Large eat in kitchen
- Built in shelving
- $274 HOA
Tags
Property features AI
Finance
- Other: Living area reported as 1,130 (public records)
- HOA & community: HOA managed by Century Management; Monthly HOA fee of $274; HOA covers common area maintenance, water, sewer, trash, and snow removal; Association management available
Exterior
- Utilities: Public water; Public sewer; Single phase electric; Underground utilities
- Home design: Condominium (residential); One level
- Construction: Brick veneer construction
- Exterior features: Covered patio; Patio; Level lot
Interior
- Kitchen: Electric oven; Electric range
- Bedrooms: 2 bedrooms (both on the main level)
- Bathrooms: 2 full bathrooms (main level)
- Heating & cooling: Electric heating; Central air; Ceiling fans
- Interior features: Disposal; Accessible entrance; No-step entry
Neighborhood map
What this means for you Summary
Snapshot
- This is a 2-bed/2.0-bath condo listed at $175k.
Deal economics
- At list price, monthly cash flow is $-47 ($-569/yr) — negative.
- To cash-flow at today's rent, offer at most $167k (4.8% below list).
- Meets the 1% rule at list price ($2k rent vs $175k).
- Recommended offer: $167k (4.8% below list) — sets the bar for cash-flow.
- Cap rate 6.0% vs local median 4.2% in St. Peters — top-decile yield for the area; either an underpriced asset or a hidden risk that comps aren't pricing in. Stress-test before assuming the spread holds.
Location & tenants
- Location reads: area grade D — affects rentability + tenant quality, not the cash-flow math above.
- Ft. Zumwalt R-II (suburban): math 54% / reading 60% proficiency, ranked #14 of 324 in MO (top 4%) — acceptable for families but not a draw, mixed tenant base, ~2y average lease; only 18% free/reduced lunch — higher-income household profile.
- Zoned schools: St. Peters Elem. (384 students, 32% FRL); Ft. Zumwalt East High (math 50% / reading 64%, grade C, #51 of 521 statewide, top 11%, 1,226 students, 25% FRL).
- Market conditions: Rents rising (+2.7%/yr); 297 active listings in the ZIP; 6 comparable units currently listed for rent nearby; rentals leasing fast (median 6d on market — plan ~1-2 weeks tenant-placement turnaround); solid renter incomes; 2,021 units permitted in St. Charles County in 2024 (568 in 5+ unit buildings).
Forward outlook
- Local home prices are declining (-3.0%/yr); year-one equity from $1k of loan paydown is wiped out by about $5k of value loss. Plan a longer hold.
- St. Charles County population projected at +22% by 2050 — long-run rental-demand tailwind backs the buy-and-hold thesis.
Negotiation context
- Only 3 days on market — expect competitive offers; lowballing is unlikely to land.
Risks & watch-outs
- Climate carrying-cost: extreme-heat days projected 7→21/yr by 2055 (HVAC capex compounding) — expect insurance premiums to compound above CPI over the hold.
Questions for the listing agent
- What do current leases actually rent for vs. the listed asking? Can we see a recent rent roll and the last 12 months of T-12 income?
- What does the HOA fee cover, when was the last increase, and are there any pending special assessments or reserve-fund shortfalls?
- Any open or pending special assessments — roof, HVAC, plumbing, elevator, façade? What's the per-unit balance and payoff schedule, and is the seller paying it off at close or rolling it to the buyer?
- Is there a deadline driving the sale (1031 exchange, divorce, estate, relocation)? That informs how much negotiation room exists.
- The area grade is low — what's the realistic commute time and amenity access for the typical tenant pool here? Any planned neighborhood developments (good or bad) we should know about?
- What's the average days-on-market for RENTAL listings here right now (not sales)? A rising rental-DOM trend means longer vacancies and softer asking-rent achievability than the comps imply.
- What's the recent tenant-quality profile in this submarket — average credit score on applications, eviction rate, late-payment / NSF rate, and stable-employment percentage? A property-management company in the area should have these aggregated.
- How much new apartment / multifamily construction is in the pipeline within 1–3 miles? Heavy new supply (>2% of stock underway) typically softens rents 12–24 months out; light construction supports rent growth.
Investment metrics
- 1% rule
- 1.02% ✓
- Cap rate
- 5.97%
- Cash-on-cash
- -1.16%
- DSCR
- 0.95
- GRM
- 8.2
CMA / ARV
No comps found within radius.
Projected returns pro-forma
-3.0% appreciation · 2.69% rent growth · sell at horizon
- IRR
- -18.5%
- Equity multiple
- 0.35×
- Total profit
- $-31,754
- Equity at exit
- $26,093
- IRR
- -11.4%
- Equity multiple
- 0.33×
- Total profit
- $-33,073
- Equity at exit
- $15,131
Cash invested: $49,000 (down + closing). Projections, not guarantees.
Landlord ↔ Tenant lean methodology
- Overall (STATE)
- 81 Strongly Landlord-Friendly
- State Missouri
- 81 Strongly Landlord-Friendly · R+10
- County
- — inherits STATE
- City
- — inherits STATE
ZIP-level market 63376
- Rents YoY
- 2.7%
- Active inventory
- 297
- Price-to-rent
- 8.2×
Monthly cashflow live
- Estimated rent
- $1,788 high interval (Pro) →
- Mortgage (P&I)
- −$918
- Tax from tax record
- −$195 /mo · $2,341/yr
- Insurance
- −$73
- HOA
- −$274
- Vacancy / Maint / Mgmt
- −$375
- Net cashflow
- $-47
Break-even live
Sensitivity live
| Price | -10% $52 | -5% $2 | +0% $-47 | +5% $-97 | +10% $-146 |
|---|---|---|---|---|---|
| Rent | -10% $-189 | -5% $-118 | +0% $-47 | +5% $23 | +10% $94 |
| Rate | -1.0pp $41 | -0.5pp $-3 | base $-47 | +0.5pp $-93 | +1.0pp $-139 |
UW: 25.0% down · 7.5% · 30yr · 1.5% tax · 5.0% vac · 8.0% maint · 8.0% mgmt
Financing live
Cash to close
- Down payment
- $43,750
- Closing costs
- $5,250
- Reserves months
- —
- Total cash needed
- —
Loan-product check · same deal, 3 products live
Conventional
25% down · 7.5% · 30yr
- Down + closing
- —
- Monthly P&I
- —
- Monthly cashflow
- —
- DSCR
- —
- Eligible?
- —
Personal DTI + credit; lowest rate.
DSCR
20% down · 8.5% · 30yr
- Down + closing
- —
- Monthly P&I
- —
- Monthly cashflow
- —
- DSCR
- —
- Eligible?
- —
No personal income docs; deal must DSCR.
Hard money
10% down · 12.0% · 12mo
- Down + closing
- —
- Monthly P&I
- —
- Monthly cashflow
- —
- DSCR
- —
- Eligible?
- —
Short-term bridge; refi at stabilization.
Rent comps 6 comps
| Address | Beds | Baths | Sqft | Rent | $/sqft | DOM | Units | Dist |
|---|---|---|---|---|---|---|---|---|
| 23 Steeplechase Dr Saint Peters, MO | 3.0 | 1.0 | 1073 | $1,776 | $1.66 | 14d | 1 | 0.19mi |
| 28 Jamestown Dr Saint Peters, MO | 3.0 | 1.0 | 1073 | $1,825 | $1.70 | 6d | 1 | 0.22mi |
| 2000 Enson LN St Peters, MO | 1.0–2.0 | 1.0–2.0 | 930 | $1,815 | $1.95 | 0d | 19 | 0.45mi |
| 131 Oak Dr Saint Peters, MO | 3.0 | 2.0 | 1500 | $1,950 | $1.30 | 25d | 1 | 0.59mi |
| 100 Ridgegate Ln Saint Peters, MO | 1.0–2.0 | 1.0–2.0 | 847 | $1,695 | $2.00 | 0d | 9 | 0.72mi |
| 8 Oak Dr Saint Peters, MO | 3.0 | 1.5 | 1134 | $2,171 | $1.91 | 0d | 1 | 0.77mi |
HOA detail condo
- Monthly dues
- $274 · $3,288/yr
- Assessments
- None detected in remarks — confirm with the listing agent.
Listing history 3 events
-
2026-06-21days on market $175,000 Coming Soon 3 DOM
-
2026-06-19remarks 699-char remark
-
2026-06-19$175,000 Coming Soon 1 DOM
ⓘ Source: listings_history table (triggers on properties + properties_extension) + one-shot
backfill from property_details.listing_events for pre-trigger history.
Tax reassessment forecast MO · Resets to sale price
- Current annual tax
- $2,341 · $195/mo
- Projected year-2 tax
- $2,341 · $195/mo
- Expected delta
- $0/yr ($0/mo · 0.0%)
ⓘ Screening estimate from a state-policy table — verify with the county assessor before closing.
Climate risk First Street
- Flood 1/10 Low FEMA zone X (unshaded) · 0% chance over 30 yrs
- Wildfire 1/10 Low
- Heat 5/10 Major 7 d/yr ≥108°F today · 21 d/yr by 30 yrs out
- Wind 2/10 Low 100% chance of damaging wind over 30 yrs
- Air quality 2/10 Low 2 unhealthy d/yr today · 2 by 30 yrs out
Nearby sold comps map
Loading sold comps map…
Walkable amenities ~0.75 mi
Loading nearby amenities…
Taxation est. · year 1
- Rental income
- $21,452
- − Mortgage interest
- −$9,803
- − Property taxes
- −$2,341
- − Insurance
- −$875
- − Repairs & maintenance
- −$1,716
- − Management
- −$1,716
- − HOA
- −$3,288
- − Depreciation
- −$5,091
- Taxable loss
- −$3,378
- Est. tax savings @ 24.0%
- +$811
- After-tax cash flow
- $241/yr
For passive investors: Depreciation is non-cash, so a rental often shows a tax loss while cash-flowing — sheltering income. Rental losses are passive: they offset passive income freely, and up to $25,000/yr can offset ordinary (W-2) income if you actively participate and your MAGI is under $100k (phasing out to $0 by $150k); unused losses carry forward. On sale, claimed depreciation is recaptured at up to 25%, and gains may owe capital-gains tax (a 1031 exchange can defer both). Figures are a year-1 estimate at your 24.0% rate — not tax advice; consult a CPA.
Schools (NCES district)
- District
- Ft. Zumwalt R-II
- NCES district ID
- 2908370
- Math proficiency
- 54% ▼ -7.00%
- Reading proficiency
- 60% ▼ -4.00%
- Median HH income
- $75,817
- Composite
- 51.04/100
- National rank
- #1772
- State rank
- #14 of 324 in MO
Livability — St. Peters
No livability data for this city. (Only ~50 U.S. cities are tracked.)
Census & demographics
- Census place
- St. Peters, MO
- County
- Saint Charles County · 399,703 people
- City population
- 74,876
- Metro
- St. Louis, MO-IL
- Population (ZIP)
- 74,962
- Household income
- $96,393
- Rent vs Own
- Severe rent burden
- 964.0
Population outlook (St. Charles County) Hauer SSP2
- Today (2025)
- 437,857 people
- By 2030
- 461,707 · +5.4%
- By 2040
- 503,222 · +14.9%
- By 2050
- 534,684 · +22.1%
- By 2075
- 597,047 · +36.4%
- By 2100
- 609,682 · +39.2%
Race, ethnicity, and origin ACS 2023
- Neighborhood character
- Predominantly White (86%)
- Race & ethnicity
- White 86% Two or more races 6% Black 5% Hispanic / Latino 2% Asian 2%
- Common ancestry
- Lithuanian 3% Romanian 3% Italian 2%
- Foreign-born
- 3% · China, Canada
- Languages at home
- 96% English-only · Spanish 1% Chinese 1% Other Asian/Pacific 1%
Political lean MEDSL · St. Charles
- 2024 margin
- R (+17.0) · D 40.8% · R 57.8% · Other 1.4%
- 2008→2024 swing
- -7.2pp toward R · 2008: -9.7pp · 2024: -17.0pp
- All cycles
- 2024: R+17.0 2020: R+17.5 2016: R+26.4 2012: R+21.0 2008: R+9.7
Not yet ingested
- Civics
- —
Market trends
- HPI YoY
- ▼ -315.50%
- Current HPI
- 230.3362
- Rent YoY
- ▲ 2.69%
- Metro
- St. Louis, MO-IL
- State GDP YoY
- ▲ 1.84%
- F500 in state
- 20
Industry mix (Fortune 500 HQ in MO)
| Industry | F500 HQs | Revenue |
|---|---|---|
| Healthcare | 1 | $163B |
|
||
| Insurance | 1 | $21B |
|
||
| Industrial Technology | 1 | $17B |
|
||
| Retail | 1 | $16B |
|
||
| Industrial Distribution | 1 | $10B |
|
||
| Utilities | 1 | $9B |
|
||
Price history
+2.9% since first listed8 events — show timeline
- 2026-06-18 Coming Soon $175,000 MARIS as Distributed by MLS Grid
- 2022-12-13 Sold (Public Records) $173,000 Public Records
- 2022-12-13 Sold (Public Records) — Public Records
- 2022-12-08 Sold (MLS) — MARIS as Distributed by MLS Grid
- 2022-12-03 Pending — MARIS as Distributed by MLS Grid
- 2022-11-12 Contingent — MARIS as Distributed by MLS Grid
- 2022-11-09 Listed $170,000 MARIS as Distributed by MLS Grid
- 2007-11-19 Sold (Public Records) — Public Records
Property tax history
+6.0%/yrLatest (2025): $2,341 · +7.6% YoY. Source: county tax records.
Cash-flow waterfall
monthlySold comps — $/sqft
last 12 mo · ≤1 miLoading sold comps…