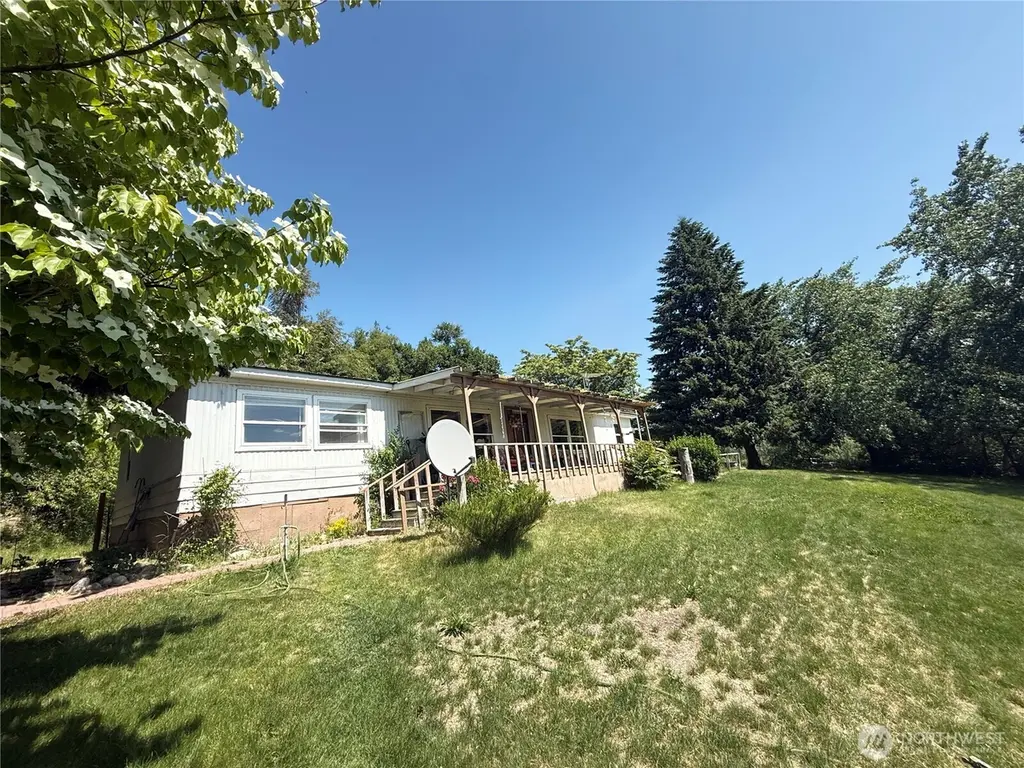
24 Hubbert Rd · Omak, WA
Flood risk 1/10 · Minimal
- FEMA flood zone
- X
- Chance of flooding over 30 yrs
- 0.0%
- Est. flood insurance / yr
- $507 – $1,088
Fire risk 9/10 · Severe
- Est. fire insurance / yr
- $604 – $1,122
Heat risk 4/10 · Minor
- Hot days now (above 97°F)
- 7 days/yr
- Hot days in 30 yrs
- 14 days/yr
Wind risk 1/10 · Minimal
- Chance of severe wind over 30 yrs
- —
Air-quality risk 10/10 · Severe
- Unhealthy air days now
- 22 days/yr
- Unhealthy air days in 30 yrs
- 23 days/yr
Risk factors via First Street. Map © Google.
Why this score? — see what drove the D+ grade
The composite is a weighted blend of 9 inputs, each scored 0–100. Each bar is that input's sub-score; the figure is the points it added to the 100-point composite (weight × sub-score).
- Cash flow +15.0/30.0
- ARV discount +15.0/15.0
- DSCR +4.6/10.0
- Schools +3.6/10.0
- Livability +3.2/5.0
- 1% rule +3.1/10.0
- Rent growth +2.5/5.0
- Condition / age +2.5/5.0
- Appreciation +0.0/10.0
$179,900
🖨 Deal sheet (PDF) 📄 Offer letter ✓ Due diligence
Listing remarks
GREAT PRIVATE location at this 3 bd/2 ba MH on 2.53 irrigated acres minutes from Omak. Living room w/ wood stove; dining room with China hutch; family room; utility room. Primary bed/bath suite with soaking tub. Covered front deck; attached carport. Landscaped yard, OID irrigated pasture with solid-set sprinklers. Several outbuildings with shop, guest cabin, storage sheds, RV Hkup. New on-demand water heater, extra insulation blown in, some upgraded windows. CASH ONLY. SEE AGENT FOR DETAILS. $179,900 H-3767/MLS2538261
Key facts
- Wood stove
- Utility room
- Soaking tub
Tags
Property features AI
Finance
- Other: Lot size: 2.53 acres; Lot features include lot number 1
- Financial info: Listing terms: cash
- HOA & community: Irrigation district fee applies (OID irrigation - $530/yr)
Exterior
- Parking: Attached carport (1 covered space)
- Security: Partially fenced
- Utilities: Community water; Septic tank sewer; Power provided by PUD; Energy sources: electric and wood
- Home design: Manufactured on-land (double wide); One story; Main-level entry; Average condition; Facing direction: not specified
- Construction: Metal/vinyl exterior; Metal roof; Pillar/post/pier foundation; Structure type: manufactured house; Style: double wide manufactured
- Exterior features: Deck; Partially fenced; High-speed internet available; Irrigation; Outbuildings; Patio; Shop; Has view; Garden space; Pasture; Dead-end street; Paved access
Interior
- Kitchen: Dishwasher; Refrigerator; Stove/Range
- Bedrooms: 3 bedrooms (all on main level)
- Flooring: Vinyl; Vinyl plank
- Bathrooms: 2 full bathrooms (both on main level); 2 bathtubs and 2 showers
- Heating & cooling: Forced air heating; Window unit(s) for cooling
- Interior features: Ceiling fan(s); Dining room; Fireplace (wood-burning); Vaulted ceilings; On-demand water heater
- Laundry & utility: Water heater: on demand
Neighborhood map
What this means for you Summary
Snapshot
- This is a 3-bed/2.0-bath manufactured listed at $180k.
Deal economics
- At list price, monthly cash flow is $56 ($678/yr) — positive.
- The deal already cash-flows at list — no discount required.
- To meet the 1% rule (rent ≥ 1% of price), the offer needs to be $146k (18.8% below list).
- Recommended offer: $146k (18.8% below list) — sets the bar for 1% rule.
- Cap rate 6.7% vs local median 2.4% in Omak — top-decile yield for the area; either an underpriced asset or a hidden risk that comps aren't pricing in. Stress-test before assuming the spread holds.
Location & tenants
- Location reads 63/100 on livability (#386 in WA) — a middle-class / working-renter tenant base. Strengths: cost of living A+; Watch: crime C-, health & safety C-, employment D.
- Omak School District (town): math 29% / reading 49% proficiency, ranked #227 of 291 in WA (top 78%) — families likely to look elsewhere, expect single-tenant / working-renter base with shorter leases.
- Zoned schools: Washington Virtual Academy Omak Elementary (1,409 students, 61% FRL); Washington Virtual Academy Omak Middle School (1,277 students, 60% FRL); Washington Virtual Academy Omak High School (1,511 students, 54% FRL) — zoned schools average 58% FRL vs 37% district-wide (22 pts higher); higher-poverty schools than district average — tighter screening recommended.
- Market conditions: 106 active listings in the ZIP; 234 units permitted in Okanogan County in 2024 (0 in 5+ unit buildings).
Forward outlook
- Local home prices are declining (-3.0%/yr); year-one equity from $1k of loan paydown is wiped out by about $5k of value loss. Plan a longer hold.
- Okanogan County population projected at -12% by 2050 — secular population decline; favor cash flow + early exit over multi-decade hold.
Negotiation context
- Only 11 days on market — expect competitive offers; lowballing is unlikely to land.
Risks & watch-outs
- Climate carrying-cost: severe wildfire risk — expect insurance premiums to compound above CPI over the hold.
Questions for the listing agent
- Built in 1977 — when were the roof, HVAC, electrical panel, plumbing, and water heater last replaced?
- Is there a deadline driving the sale (1031 exchange, divorce, estate, relocation)? That informs how much negotiation room exists.
- The area grade is low — what's the realistic commute time and amenity access for the typical tenant pool here? Any planned neighborhood developments (good or bad) we should know about?
- What's the average days-on-market for RENTAL listings here right now (not sales)? A rising rental-DOM trend means longer vacancies and softer asking-rent achievability than the comps imply.
- What's the recent tenant-quality profile in this submarket — average credit score on applications, eviction rate, late-payment / NSF rate, and stable-employment percentage? A property-management company in the area should have these aggregated.
- How much new for-sale + rental construction is in the pipeline within 1–3 miles? Heavy new supply typically softens prices + rents 12–24 months out; constrained supply supports both.
Investment metrics
- 1% rule
- 0.81% ✗
- Cap rate
- 6.67%
- Cash-on-cash
- 1.35%
- DSCR
- 1.06
- GRM
- 10.3
CMA / ARV
- ARV (on-the-fly)
- $306,720
- Comps found
- 2
Show comp detail 2 sales within ~0.75 mi
| Address | Dist | Beds/Ba | Sqft | Sold | Price | $/sf | Match |
|---|---|---|---|---|---|---|---|
| 6 Summerwind Rd | 0.63mi | 3/2.0 | 1,546 (+7%) | 13mo | $330,000 | $213 | 48 |
| 84 Weatherstone Rd | 0.74mi | 3/2.0 | 1,568 (+9%) | 10mo | $255,000 | $163 | 42 |
Match score weights: distance 35% · size 25% · config 20% · recency 20%. Top-matched comps best support the ARV.
Projected returns pro-forma
-3.0% appreciation · 3.0% rent growth · sell at horizon
- IRR
- -14.2%
- Equity multiple
- 0.49×
- Total profit
- $-25,623
- Equity at exit
- $26,824
- IRR
- -5.5%
- Equity multiple
- 0.64×
- Total profit
- $-17,956
- Equity at exit
- $15,554
Cash invested: $50,372 (down + closing). Projections, not guarantees.
Landlord ↔ Tenant lean methodology
- Overall (STATE)
- 28 Tenant-Leaning
- State Washington
- 28 Tenant-Leaning · D+8
- County
- — inherits STATE
- City
- — inherits STATE
ZIP-level market 98841
- Active inventory
- 106
- Price-to-rent
- 10.3×
Monthly cashflow live
- Estimated rent
- $1,460 medium interval (Pro) →
- Mortgage (P&I)
- −$943
- Tax from tax record
- −$79 /mo · $946/yr
- Insurance
- −$75
- HOA
- −$0
- Vacancy / Maint / Mgmt
- −$307
- Net cashflow
- $56
Break-even live
Sensitivity live
| Price | -10% $158 | -5% $107 | +0% $56 | +5% $6 | +10% $-45 |
|---|---|---|---|---|---|
| Rent | -10% $-59 | -5% $-1 | +0% $56 | +5% $114 | +10% $172 |
| Rate | -1.0pp $147 | -0.5pp $102 | base $56 | +0.5pp $10 | +1.0pp $-38 |
UW: 25.0% down · 7.5% · 30yr · 1.5% tax · 5.0% vac · 8.0% maint · 8.0% mgmt
Financing live
Cash to close
- Down payment
- $44,975
- Closing costs
- $5,397
- Reserves months
- —
- Total cash needed
- —
Loan-product check · same deal, 3 products live
Conventional
25% down · 7.5% · 30yr
- Down + closing
- —
- Monthly P&I
- —
- Monthly cashflow
- —
- DSCR
- —
- Eligible?
- —
Personal DTI + credit; lowest rate.
DSCR
20% down · 8.5% · 30yr
- Down + closing
- —
- Monthly P&I
- —
- Monthly cashflow
- —
- DSCR
- —
- Eligible?
- —
No personal income docs; deal must DSCR.
Hard money
10% down · 12.0% · 12mo
- Down + closing
- —
- Monthly P&I
- —
- Monthly cashflow
- —
- DSCR
- —
- Eligible?
- —
Short-term bridge; refi at stabilization.
Listing history 10 events
-
2026-06-21days on market $179,900 Active 11 DOM
-
2026-06-21days on market $179,900 Active 10 DOM
-
2026-06-18days on market $179,900 Active 8 DOM
-
2026-06-17days on market $179,900 Active 7 DOM
-
2026-06-16days on market $179,900 Active 6 DOM
-
2026-06-15days on market $179,900 Active 5 DOM
-
2026-06-15days on market $179,900 Active 4 DOM
-
2026-06-13days on market $179,900 Active 3 DOM
-
2026-06-12remarks 523-char remark
-
2026-06-12$179,900 Active 2 DOM
ⓘ Source: listings_history table (triggers on properties + properties_extension) + one-shot
backfill from property_details.listing_events for pre-trigger history.
Tax reassessment forecast WA · Resets to sale price
- Current annual tax
- $946 · $79/mo
- Projected year-2 tax
- $1,763 · $147/mo
- Expected delta
- +$817/yr (+$68/mo · 86.3%)
ⓘ Screening estimate from a state-policy table — verify with the county assessor before closing.
Climate risk First Street
- Flood 1/10 Low FEMA zone X · 0% chance over 30 yrs
- Wildfire 9/10 Extreme
- Heat 4/10 Moderate 7 d/yr ≥97°F today · 14 d/yr by 30 yrs out
- Wind 1/10 Low
- Air quality 10/10 Extreme 22 unhealthy d/yr today · 23 by 30 yrs out
Nearby sold comps map
Loading sold comps map…
Walkable amenities ~0.75 mi
Loading nearby amenities…
Taxation est. · year 1
- Rental income
- $17,525
- − Mortgage interest
- −$10,077
- − Property taxes
- −$946
- − Insurance
- −$900
- − Repairs & maintenance
- −$1,402
- − Management
- −$1,402
- − Depreciation
- −$5,233
- Taxable loss
- −$2,436
- Est. tax savings @ 24.0%
- +$585
- After-tax cash flow
- $1,262/yr
For passive investors: Depreciation is non-cash, so a rental often shows a tax loss while cash-flowing — sheltering income. Rental losses are passive: they offset passive income freely, and up to $25,000/yr can offset ordinary (W-2) income if you actively participate and your MAGI is under $100k (phasing out to $0 by $150k); unused losses carry forward. On sale, claimed depreciation is recaptured at up to 25%, and gains may owe capital-gains tax (a 1031 exchange can defer both). Figures are a year-1 estimate at your 24.0% rate — not tax advice; consult a CPA.
Schools (NCES district)
- District
- Omak School District
- NCES district ID
- 5306220
- Math proficiency
- 29% ▬ 0.00%
- Reading proficiency
- 49% ▲ 1.00%
- Median HH income
- $44,421
- Composite
- 35.56/100
- National rank
- #9729
- State rank
- #227 of 291 in WA
Livability — Omak
- Score
- 63/100
- State rank
- #386
- US rank
- #15185
Category grades
Schools grade is shown separately in the Schools card above.
Census & demographics
- Population (ZIP)
- 9,376
Population outlook (Okanogan County) Hauer SSP2
- Today (2025)
- 40,288 people
- By 2030
- 39,265 · -2.5%
- By 2040
- 37,110 · -7.9%
- By 2050
- 35,389 · -12.2%
- By 2075
- 31,609 · -21.5%
- By 2100
- 26,647 · -33.9%
Race, ethnicity, and origin ACS 2023
- Neighborhood character
- Predominantly White (65%)
- Race & ethnicity
- White 65% Hispanic / Latino 16% Two or more races 16% Native American 14%
- Hispanic origin (detail)
- Mexican 14% Puerto Rican 1%
- Common ancestry
- Portuguese 4% Slovak 3% Lithuanian 2%
- Foreign-born
- 6% · Canada
- Languages at home
- 91% English-only · Spanish 8%
Political lean MEDSL · Okanogan
- 2024 margin
- R (+15.0) · D 41.1% · R 56.0% · Other 2.9%
- 2008→2024 swing
- -8.0pp toward R · 2008: -7.0pp · 2024: -15.0pp
- All cycles
- 2024: R+15.0 2020: R+13.8 2016: R+21.3 2012: R+14.8 2008: R+7.0
Not yet ingested
- Civics
- —
Market trends
- HPI YoY
- ▼ -144.79%
- Current HPI
- 190.8789
- Rent YoY
- —
- Metro
- —
- State GDP YoY
- ▲ 4.65%
- F500 in state
- 22
Industry mix (Fortune 500 HQ in WA)
| Industry | F500 HQs | Revenue |
|---|---|---|
| Retail | 2 | $269B |
|
||
| Technology / Retail | 1 | $638B |
|
||
| Technology | 1 | $245B |
|
||
| Telecommunications | 1 | $38B |
|
||
| Food / Beverage | 1 | $36B |
|
||
| Automotive / Trucks | 1 | $34B |
|
||
Price history
1 event — show timeline
- 2026-06-10 Listed $179,900 NWMLS as Distributed by MLS Grid
Property tax history
-0.0%/yrLatest (2026): $946 · +212.1% YoY. Source: county tax records.
Cash-flow waterfall
monthlySold comps — $/sqft
last 12 mo · ≤1 miLoading sold comps…