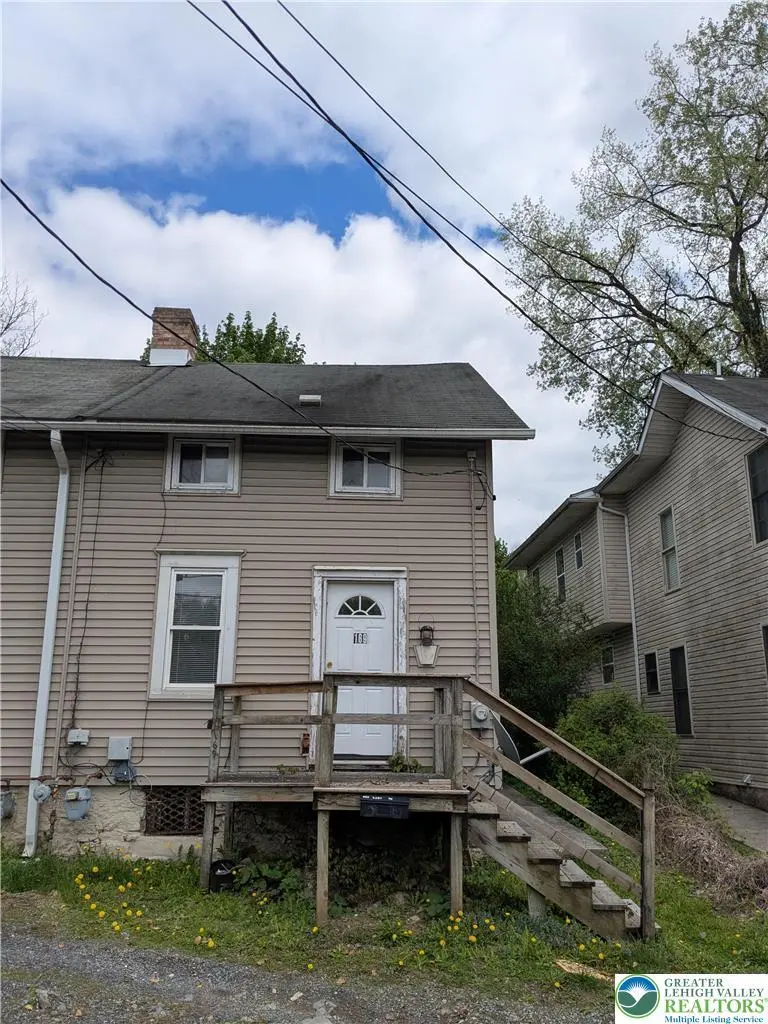
169 Main St · Glendon, PA
Flood risk 6/10 · Moderate
- FEMA flood zone
- X (unshaded)
- Chance of flooding over 30 yrs
- 0.27%
- Est. flood insurance / yr
- $473 – $860
Fire risk 4/10 · Minor
- Est. fire insurance / yr
- $511 – $949
Heat risk 4/10 · Minor
- Hot days now (above 99°F)
- 7 days/yr
- Hot days in 30 yrs
- 15 days/yr
Wind risk 4/10 · Minor
- Chance of severe wind over 30 yrs
- 17.0%
Air-quality risk 3/10 · Minor
- Unhealthy air days now
- 3 days/yr
- Unhealthy air days in 30 yrs
- 5 days/yr
Risk factors via First Street. Map © Google.
Why this score? — see what drove the C grade
The composite is a weighted blend of 9 inputs, each scored 0–100. Each bar is that input's sub-score; the figure is the points it added to the 100-point composite (weight × sub-score).
- Cash flow +18.7/30.0
- ARV discount +15.0/15.0
- DSCR +5.9/10.0
- 1% rule +4.9/10.0
- Rent growth +3.7/5.0
- Livability +3.7/5.0
- Schools +3.5/10.0
- Condition / age +2.5/5.0
- Appreciation +0.0/10.0
$169,900
🖨 Deal sheet (PDF) 📄 Offer letter ✓ Due diligence
Listing remarks
* * Colonial Style End Unit Home * * * * Desirable Wilson Area School District * * First Floor Features A Large Eat In Kitchen With Granite Counters / Upgraded Floors, Spacious Living Room, Laundry Room, and Large Full Bathroom. Second Floor Features Two Bedrooms that offer new carpet and newer upgraded flooring. The spacious rear yard offers a concrete patio / concrete walkway to the 2 car parking pad.
Key facts
- Large eat in kitchen
- Laundry room
- Granite counters
Tags
Property features AI
Exterior
- Parking: Off-street parking; Parking pad
- Utilities: 100-amp electric service with circuit breakers; Public water; Public sewer
- Home design: Single-story exterior appearance; Wood siding
- Construction: Asphalt/fiberglass roof; Wood siding construction; Full basement
- Exterior features: Waterfront lot
Interior
- Kitchen: Electric oven
- Bedrooms: Second-level bedrooms (2): one about 10 x 9, another about 14 x 10
- Flooring: Carpet; Hardwood
- Bathrooms: One full bathroom (first level)
- Heating & cooling: Forced-air heating (gas)
- Interior features: Eat-in kitchen; Kitchen island
- Laundry & utility: Main-level laundry; Gas water heater
Neighborhood map
What this means for you Summary
Snapshot
- This is a 2-bed/1.0-bath single-family listed at $170k.
Deal economics
- At list price, monthly cash flow is $169 ($2k/yr) — positive.
- The deal already cash-flows at list — no discount required.
- To meet the 1% rule (rent ≥ 1% of price), the offer needs to be $168k (1.2% below list).
- Recommended offer: $167k (1.5% below list) — sets the bar for market timing.
Location & tenants
- Location reads 74/100 on livability (#512 in PA, #4,688 nationally) — a middle-class / working-renter tenant base. Strengths: cost of living A+, employment A, housing A-; Watch: schools F, amenities F, commute F.
- Wilson Area SD (suburban): math 28% / reading 52% proficiency, ranked #338 of 539 in PA (top 63%) — families likely to look elsewhere, expect single-tenant / working-renter base with shorter leases.
- Market conditions: Rents rising fast (+4.9%/yr); 185 active listings in the ZIP; 21 comparable units currently listed for rent nearby; rentals at typical pace (median 15d on market — plan ~3-4 weeks tenant-placement turnaround); solid renter incomes; 567 units permitted in Northampton County in 2024 (151 in 5+ unit buildings).
Forward outlook
- Local home prices are declining (-3.0%/yr); year-one equity from $1k of loan paydown is wiped out by about $5k of value loss. Plan a longer hold.
Negotiation context
- It's been on market 18 days — a 2% lower offer ($167k) is reasonable based on typical stale-listing flexibility.
Risks & watch-outs
- Watch-outs: built in 1900 — expect roof / HVAC / electrical / plumbing capex.
- Climate carrying-cost: major flood risk — expect insurance premiums to compound above CPI over the hold.
Questions for the listing agent
- Built in 1900 — when were the roof, HVAC, electrical panel, plumbing, and water heater last replaced?
- Is there a deadline driving the sale (1031 exchange, divorce, estate, relocation)? That informs how much negotiation room exists.
- Schools are F-rated, which usually means shorter tenancies and higher turnover. Who's the typical renter profile here, and what's been the actual vacancy rate?
- What's the average days-on-market for RENTAL listings here right now (not sales)? A rising rental-DOM trend means longer vacancies and softer asking-rent achievability than the comps imply.
- What's the recent tenant-quality profile in this submarket — average credit score on applications, eviction rate, late-payment / NSF rate, and stable-employment percentage? A property-management company in the area should have these aggregated.
- How much new for-sale + rental construction is in the pipeline within 1–3 miles? Heavy new supply typically softens prices + rents 12–24 months out; constrained supply supports both.
Investment metrics
- 1% rule
- 0.99% ✗
- Cap rate
- 7.49%
- Cash-on-cash
- 4.26%
- DSCR
- 1.19
- GRM
- 8.4
CMA / ARV
- ARV (median comp)
- $246,552
- List price
- $169,900
- Delta
- -31.09%
- Verdict
- UNDERPRICED
- Comps
- 20 within 1.0 mi
Show comp detail 5 sales within ~0.75 mi
| Address | Dist | Beds/Ba | Sqft | Sold | Price | $/sf | Match |
|---|---|---|---|---|---|---|---|
| 306 Lehigh Dr | 0.36mi | 2/2.0 | 864 (-3%) | 18mo | $300,000 | $347 | 60 |
| 2312 4th St | 0.62mi | 2/1.0 | 960 (+8%) | 0mo | $274,900 | $286 | 57 |
| 2218 2nd St | 0.48mi | 3/1.0 (+1) | 1,008 (+14%) | 1mo | $325,000 | $322 | 49 |
| 2497 Lincoln Ave | 0.66mi | 2/1.0 | 960 (+8%) | 15mo | $220,000 | $229 | 44 |
| 2604 Burrows St | 0.73mi | 3/1.0 (+1) | 1,008 (+14%) | 10mo | $280,000 | $278 | 30 |
Match score weights: distance 35% · size 25% · config 20% · recency 20%. Top-matched comps best support the ARV.
Projected returns pro-forma
-3.0% appreciation · 4.94% rent growth · sell at horizon
- IRR
- -7.5%
- Equity multiple
- 0.72×
- Total profit
- $-13,425
- Equity at exit
- $25,333
- IRR
- 4.4%
- Equity multiple
- 1.35×
- Total profit
- $16,474
- Equity at exit
- $14,690
Cash invested: $47,572 (down + closing). Projections, not guarantees.
Landlord ↔ Tenant lean methodology
- Overall (STATE)
- 62 Landlord-Friendly
- State Pennsylvania
- 62 Landlord-Friendly · EVEN
- County
- — inherits STATE
- City
- — inherits STATE
ZIP-level market 18042
- Rents YoY
- 4.9%
- Active inventory
- 185
- Price-to-rent
- 8.4×
Monthly cashflow live
- Estimated rent
- $1,679 high interval (Pro) →
- Mortgage (P&I)
- −$891
- Tax from tax record
- −$196 /mo · $2,348/yr
- Insurance
- −$71
- HOA
- −$0
- Vacancy / Maint / Mgmt
- −$353
- Net cashflow
- $169
Break-even live
Sensitivity live
| Price | -10% $265 | -5% $217 | +0% $169 | +5% $121 | +10% $73 |
|---|---|---|---|---|---|
| Rent | -10% $36 | -5% $102 | +0% $169 | +5% $235 | +10% $301 |
| Rate | -1.0pp $254 | -0.5pp $212 | base $169 | +0.5pp $125 | +1.0pp $80 |
UW: 25.0% down · 7.5% · 30yr · 1.5% tax · 5.0% vac · 8.0% maint · 8.0% mgmt
Financing live
Cash to close
- Down payment
- $42,475
- Closing costs
- $5,097
- Reserves months
- —
- Total cash needed
- —
Loan-product check · same deal, 3 products live
Conventional
25% down · 7.5% · 30yr
- Down + closing
- —
- Monthly P&I
- —
- Monthly cashflow
- —
- DSCR
- —
- Eligible?
- —
Personal DTI + credit; lowest rate.
DSCR
20% down · 8.5% · 30yr
- Down + closing
- —
- Monthly P&I
- —
- Monthly cashflow
- —
- DSCR
- —
- Eligible?
- —
No personal income docs; deal must DSCR.
Hard money
10% down · 12.0% · 12mo
- Down + closing
- —
- Monthly P&I
- —
- Monthly cashflow
- —
- DSCR
- —
- Eligible?
- —
Short-term bridge; refi at stabilization.
Rent comps 21 comps
| Address | Beds | Baths | Sqft | Rent | $/sqft | DOM | Units | Dist |
|---|---|---|---|---|---|---|---|---|
| 100 Woodmont Cir Easton, PA | 1.0–2.0 | 1.0–2.0 | 978 | $2,450 | $2.51 | 3d | 11 | 0.78mi |
| 1115 Keane St Unit 1 Easton, PA | 1.0 | 1.0 | 554 | $1,400 | $2.53 | 44d | 1 | 0.80mi |
| 2321 Sycamore St Unit 2 Easton, PA | 1.0 | 1.0 | 630 | $1,300 | $2.06 | 3d | 1 | 0.93mi |
| 817 Ridge St Easton, PA | 2.0 | 1.0 | 1014 | $1,900 | $1.87 | 44d | 1 | 1.00mi |
| 94 Jonathan Dr Easton, PA | 2.0 | 1.0 | 1045 | $2,200 | $2.11 | 3d | 1 | 1.15mi |
| 2250 Butler St Unit 06 Easton, PA | 2.0 | 1.0 | 1000 | $1,700 | $1.70 | 19d | 1 | 1.16mi |
| 457 W Lincoln St Easton, PA | 1.0–2.0 | 1.0–2.0 | 837 | $1,932 | $2.31 | 3d | 6 | 1.17mi |
| 600 Canal St Easton, PA | 2.0 | 1.0 | 900 | $1,599 | $1.78 | 24d | 2 | 1.21mi |
| 600 Canal St Easton, PA | 2.0 | 1.0 | 900 | $1,599 | $1.78 | 3d | 2 | 1.21mi |
| 1619 Butler St Easton, PA | 3.0 | 1.0 | 965 | $2,050 | $2.12 | 24d | 1 | 1.21mi |
| 1237 Butler St Unit 2 Easton, PA | 3.0 | 1.0 | 900 | $1,700 | $1.89 | 3d | 1 | 1.30mi |
| 1401 Washington St Fl Rear Easton, PA | 1.0 | 1.0 | 600 | $1,050 | $1.75 | 19d | 1 | 1.31mi |
| 1205 Butler St Easton, PA | 2.0 | 1.0 | 900 | $1,700 | $1.89 | 15d | 1 | 1.32mi |
| 613 Oakwood St Easton, PA | 2.0 | 1.0 | 1025 | $1,898 | $1.85 | 3d | 1 | 1.35mi |
| 1304 Lehigh St Unit 1 Easton, PA | 2.0 | 1.0 | 733 | $1,295 | $1.77 | 3d | 1 | 1.37mi |
| 1224 Lehigh St Unit 2 Easton, PA | 1.0 | 1.0 | 750 | $1,250 | $1.67 | 44d | 1 | 1.40mi |
| 135 S 13th St Unit 1 Easton, PA | 1.0 | 1.0 | 800 | $1,325 | $1.66 | 44d | 1 | 1.42mi |
| 1051 Washington St Easton, PA | 3.0 | 1.0 | 900 | $1,550 | $1.72 | 15d | 1 | 1.43mi |
| 203 S 11th St Unit 1st floor Easton, PA | 2.0 | 1.0 | 900 | $1,450 | $1.61 | 44d | 1 | 1.45mi |
| 1911 Ferry St Easton, PA | 1.0 | 1.0 | 718 | $1,350 | $1.88 | 15d | 1 | 1.46mi |
| 932 Washington St Easton, PA | 2.0 | 1.0 | 765 | $1,600 | $2.09 | 44d | 1 | 1.46mi |
Listing history 3 events
-
2026-05-15status Pending 416-char remark
-
2026-05-11price $169,900 416-char remark
-
2026-04-27$179,900 Active 416-char remark
ⓘ Source: listings_history table (triggers on properties + properties_extension) + one-shot
backfill from property_details.listing_events for pre-trigger history.
Tax reassessment forecast PA · Partial reset (capped growth)
- Current annual tax
- $2,348 · $196/mo
- Projected year-2 tax
- $2,516 · $210/mo
- Expected delta
- +$168/yr (+$14/mo · 7.2%)
ⓘ Screening estimate from a state-policy table — verify with the county assessor before closing.
Climate risk First Street
- Flood 6/10 Major FEMA zone X (unshaded) · 27% chance over 30 yrs
- Wildfire 4/10 Moderate
- Heat 4/10 Moderate 7 d/yr ≥99°F today · 15 d/yr by 30 yrs out
- Wind 4/10 Moderate 17% chance of damaging wind over 30 yrs
- Air quality 3/10 Moderate 3 unhealthy d/yr today · 5 by 30 yrs out
Nearby sold comps map
Loading sold comps map…
Walkable amenities ~0.75 mi
Loading nearby amenities…
Taxation est. · year 1
- Rental income
- $20,145
- − Mortgage interest
- −$9,517
- − Property taxes
- −$2,348
- − Insurance
- −$850
- − Repairs & maintenance
- −$1,612
- − Management
- −$1,612
- − Depreciation
- −$4,943
- Taxable loss
- −$735
- Est. tax savings @ 24.0%
- +$176
- After-tax cash flow
- $2,202/yr
For passive investors: Depreciation is non-cash, so a rental often shows a tax loss while cash-flowing — sheltering income. Rental losses are passive: they offset passive income freely, and up to $25,000/yr can offset ordinary (W-2) income if you actively participate and your MAGI is under $100k (phasing out to $0 by $150k); unused losses carry forward. On sale, claimed depreciation is recaptured at up to 25%, and gains may owe capital-gains tax (a 1031 exchange can defer both). Figures are a year-1 estimate at your 24.0% rate — not tax advice; consult a CPA.
Schools (NCES district)
- District
- Wilson Area SD
- NCES district ID
- 4226550
- Math proficiency
- 28% ▼ -29.00%
- Reading proficiency
- 52% ▼ -21.00%
- Median HH income
- $58,534
- Composite
- 35.22/100
- National rank
- #4984
- State rank
- #338 of 539 in PA
Livability — Glendon
- Score
- 74/100
- State rank
- #512
- US rank
- #4688
Category grades
Schools grade is shown separately in the Schools card above.
Census & demographics
- Census place
- Glendon, PA
- County
- Northampton County · 236,814 people
- Metro
- Allentown-Bethlehem-Easton, PA-NJ
- Population (ZIP)
- 45,532
- Household income
- $77,556
- Rent vs Own
- Severe rent burden
- 1590.0
Population outlook (Northampton County) Hauer SSP2
- Today (2025)
- 312,227 people
- By 2030
- 314,769 · +0.8%
- By 2040
- 316,914 · +1.5%
- By 2050
- 318,037 · +1.9%
- By 2075
- 334,003 · +7.0%
- By 2100
- 344,696 · +10.4%
Race, ethnicity, and origin ACS 2023
- Neighborhood character
- Diverse neighborhood (Simpson 0.61)
- Race & ethnicity
- White 57% Hispanic / Latino 21% Black 12% Two or more races 12% Asian 3%
- Hispanic origin (detail)
- Mexican 3% Puerto Rican 7% Dominican 3%
- Common ancestry
- Romanian 3% Polish 2% Iranian 1%
- Foreign-born
- 13% · Canada, China, Jamaica
- Languages at home
- 80% English-only · Spanish 15% Other Indo-European 1% Arabic 1%
Political lean MEDSL · Northampton
- 2024 margin
- Toss-up / Even · D 48.6% · R 50.4%
- 2008→2024 swing
- -14.1pp toward R · 2008: 12.3pp · 2024: -1.8pp
- All cycles
- 2024: R+1.8 2020: D+0.7 2016: R+3.8 2012: D+4.6 2008: D+12.3
Not yet ingested
- Civics
- —
Market trends
- HPI YoY
- ▼ -460.52%
- Current HPI
- 254.8776
- Rent YoY
- ▲ 4.94%
- Metro
- Allentown-Bethlehem-Easton, PA-NJ
- State GDP YoY
- ▲ 1.68%
- F500 in state
- 34
Industry mix (Fortune 500 HQ in PA)
| Industry | F500 HQs | Revenue |
|---|---|---|
| Healthcare | 2 | $309B |
|
||
| Insurance | 2 | $27B |
|
||
| Telecommunications / Media | 1 | $124B |
|
||
| Industrial Distribution | 1 | $22B |
|
||
| Financial Services | 1 | $20B |
|
||
| Chemicals / Materials | 1 | $18B |
|
||
Price history
-16.6% since first listed4 events — show timeline
- 2026-06-10 Sold (MLS) $150,000 GLVRMLS
- 2026-05-15 Pending — GLVRMLS
- 2026-05-11 Price Changed $169,900 GLVRMLS
- 2026-04-27 Listed $179,900 GLVRMLS
Property tax history
+1.0%/yrLatest (2026): $2,348 · +2.6% YoY. Source: county tax records.
Cash-flow waterfall
monthlySold comps — $/sqft
last 12 mo · ≤1 miLoading sold comps…