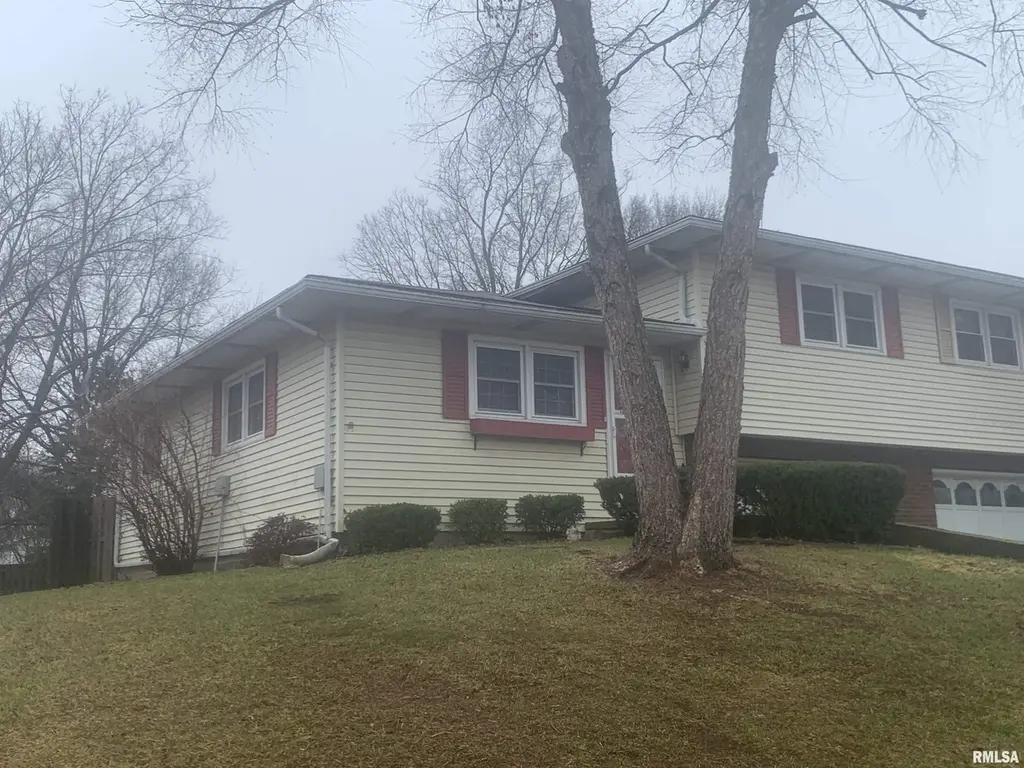
3A Justin Dr · Jacksonville, IL
Flood risk 1/10 · Minimal
- FEMA flood zone
- X (unshaded)
- Chance of flooding over 30 yrs
- 0.0%
- Est. flood insurance / yr
- $473 – $860
Fire risk 1/10 · Minimal
- Est. fire insurance / yr
- $804 – $1,492
Heat risk 4/10 · Minor
- Hot days now (above 106°F)
- 7 days/yr
- Hot days in 30 yrs
- 19 days/yr
Wind risk 2/10 · Minimal
- Chance of severe wind over 30 yrs
- 2.0%
Air-quality risk 2/10 · Minimal
- Unhealthy air days now
- 1 days/yr
- Unhealthy air days in 30 yrs
- 2 days/yr
Risk factors via First Street. Map © Google.
Why this score? — see what drove the D grade
The composite is a weighted blend of 9 inputs, each scored 0–100. Each bar is that input's sub-score; the figure is the points it added to the 100-point composite (weight × sub-score).
- ARV discount +13.0/15.0
- Cash flow +10.6/30.0
- 1% rule +4.1/10.0
- Livability +3.8/5.0
- DSCR +3.1/10.0
- Rent growth +2.5/5.0
- Condition / age +2.5/5.0
- Schools +1.9/10.0
- Appreciation +0.0/10.0
$124,900
🖨 Deal sheet (PDF) 📄 Offer letter ✓ Due diligence
Listing remarks MLS
Condo in Mint condition. Open the doors to a huge living room and and updated kitchen with granite counters. 2 big bedrooms, 2 full bathrooms. Large backyard is fenced with deck.
Key facts
- Garage
- Built 1978
- Listed 101 days
Neighborhood map
What this means for you Summary
Snapshot
- This is a 2-bed/2.0-bath single-family listed at $125k.
Deal economics
- At list price, monthly cash flow is $-61 ($-735/yr) — negative.
- To cash-flow at today's rent, offer at most $114k (8.7% below list).
- To meet the 1% rule (rent ≥ 1% of price), the offer needs to be $114k (8.8% below list).
- Recommended offer: $114k (9.0% below list) — sets the bar for market timing.
Location & tenants
- Location reads 76/100 on livability (#187 in IL, #3,543 nationally) — a middle-class / working-renter tenant base. Strengths: cost of living A+, housing A+, health & safety A+; Watch: crime C-, amenities C-, commute F.
- Jacksonville SD 117 (town): math 20% / reading 23% proficiency, ranked #407 of 620 in IL (top 66%) — low school quality limits family demand, transient renter base, plan for 1-2y turnover.
- Zoned schools: Eisenhower Elem School (math 32% / reading 32%, grade F, #586 of 2,056 statewide, top 31%, 313 students, 0% FRL); Jacksonville Middle School (math 17% / reading 19%, grade F, #444 of 665 statewide, top 67%, 718 students, 0% FRL); Jacksonville High School (math 21% / reading 25%, grade F, #312 of 693 statewide, top 46%, 893 students, 0% FRL) — zoned schools average 0% FRL vs 51% district-wide (51 pts lower); this property's tenant base skews higher-income than the district average.
- Market conditions: 143 active listings in the ZIP; 3 units permitted in Morgan County in 2024 (0 in 5+ unit buildings).
Forward outlook
- Local home prices are declining (-3.0%/yr); year-one equity from $864 of loan paydown is wiped out by about $4k of value loss. Plan a longer hold.
- Morgan County population projected at -20% by 2050 — secular population decline; favor cash flow + early exit over multi-decade hold.
Negotiation context
- It's been on market 102 days — a 9% lower offer ($114k) is reasonable based on typical stale-listing flexibility.
- 4 sale attempts since 22y ago; this cycle's ask has dropped $10k (7%) from the opening price — seller is motivated, your offer sets the floor, not the list.
Questions for the listing agent
- What do current leases actually rent for vs. the listed asking? Can we see a recent rent roll and the last 12 months of T-12 income?
- It's been on market 102 days. Have you received any prior offers? Is the seller open to a 9% concession, seller financing, or rate buy-down credit?
- Built in 1978 — when were the roof, HVAC, electrical panel, plumbing, and water heater last replaced?
- Why hasn't it sold? Are there any deal-killer items the seller is aware of (foundation, flood, title, zoning, code violations)?
- Is there a deadline driving the sale (1031 exchange, divorce, estate, relocation)? That informs how much negotiation room exists.
- Schools are D-rated, which usually means shorter tenancies and higher turnover. Who's the typical renter profile here, and what's been the actual vacancy rate?
- The area grade is low — what's the realistic commute time and amenity access for the typical tenant pool here? Any planned neighborhood developments (good or bad) we should know about?
- What's the average days-on-market for RENTAL listings here right now (not sales)? A rising rental-DOM trend means longer vacancies and softer asking-rent achievability than the comps imply.
- What's the recent tenant-quality profile in this submarket — average credit score on applications, eviction rate, late-payment / NSF rate, and stable-employment percentage? A property-management company in the area should have these aggregated.
- How much new for-sale + rental construction is in the pipeline within 1–3 miles? Heavy new supply typically softens prices + rents 12–24 months out; constrained supply supports both.
Investment metrics
- 1% rule
- 0.91% ✗
- Cap rate
- 5.70%
- Cash-on-cash
- -2.10%
- DSCR
- 0.91
- GRM
- 9.1
CMA / ARV
- ARV (median comp)
- $142,298
- List price
- $124,900
- Delta
- -12.23%
- Verdict
- UNDERPRICED
- Comps
- 5 within 1.0 mi
Show comp detail 12 sales within ~0.75 mi
| Address | Dist | Beds/Ba | Sqft | Sold | Price | $/sf | Match |
|---|---|---|---|---|---|---|---|
| 1 Sunset Dr | 0.35mi | 2/1.0 | 1,120 (+3%) | 2mo | $140,000 | $125 | 72 |
| 121 City Pl | 0.49mi | 2/2.0 | 1,177 (+9%) | 5mo | $127,000 | $108 | 58 |
| 1845 Cedar St | 0.57mi | 3/2.0 (+1) | 1,118 (+3%) | 8mo | $170,000 | $152 | 57 |
| 1203 W Chambers St | 0.45mi | 3/1.0 (+1) | 1,052 (-3%) | 11mo | $160,000 | $152 | 56 |
| 509 Woodland Pl | 0.35mi | 3/1.0 (+1) | 1,226 (+13%) | 4mo | $145,000 | $118 | 50 |
| 310 Woodland Pl | 0.51mi | 2/1.0 | 1,200 (+11%) | 5mo | $132,500 | $110 | 50 |
| 604 Gladstone Rd | 0.73mi | 3/1.5 (+1) | 1,156 (+7%) | 1mo | $125,750 | $109 | 47 |
| 1839 Mound Rd | 0.51mi | 2/1.0 | 1,016 (-6%) | 20mo | $148,900 | $147 | 45 |
| 119 Fairview Ter | 0.39mi | 2/1.0 | 1,200 (+11%) | 19mo | $161,950 | $135 | 44 |
| 208 Locust St | 0.65mi | 3/2.0 (+1) | 1,004 (-7%) | 12mo | $136,500 | $136 | 42 |
| 1856 Plum St | 0.63mi | 2/1.0 | 960 (-11%) | 6mo | $129,900 | $135 | 42 |
| 610 Gladstone Rd | 0.73mi | 3/1.5 (+1) | 950 (-12%) | 19mo | $102,000 | $107 | 22 |
Match score weights: distance 35% · size 25% · config 20% · recency 20%. Top-matched comps best support the ARV.
Projected returns pro-forma
-3.0% appreciation · 3.0% rent growth · sell at horizon
- IRR
- -19.7%
- Equity multiple
- 0.31×
- Total profit
- $-24,065
- Equity at exit
- $18,623
- IRR
- -12.4%
- Equity multiple
- 0.27×
- Total profit
- $-25,668
- Equity at exit
- $10,799
Cash invested: $34,972 (down + closing). Projections, not guarantees.
Landlord ↔ Tenant lean methodology
- Overall (STATE)
- 43 Moderately Tenant-Leaning
- State Illinois
- 43 Moderately Tenant-Leaning · D+7
- County
- — inherits STATE
- City
- — inherits STATE
ZIP-level market 62650
- Active inventory
- 143
- Price-to-rent
- 9.1×
Monthly cashflow live
- Estimated rent
- $1,139 medium interval (Pro) →
- Mortgage (P&I)
- −$655
- Tax from tax record
- −$254 /mo · $3,050/yr
- Insurance
- −$52
- HOA
- −$0
- Vacancy / Maint / Mgmt
- −$239
- Net cashflow
- $-61
Break-even live
Sensitivity live
| Price | -10% $9 | -5% $-26 | +0% $-61 | +5% $-97 | +10% $-132 |
|---|---|---|---|---|---|
| Rent | -10% $-151 | -5% $-106 | +0% $-61 | +5% $-16 | +10% $29 |
| Rate | -1.0pp $2 | -0.5pp $-30 | base $-61 | +0.5pp $-94 | +1.0pp $-127 |
UW: 25.0% down · 7.5% · 30yr · 1.5% tax · 5.0% vac · 8.0% maint · 8.0% mgmt
Financing live
Cash to close
- Down payment
- $31,225
- Closing costs
- $3,747
- Reserves months
- —
- Total cash needed
- —
Loan-product check · same deal, 3 products live
Conventional
25% down · 7.5% · 30yr
- Down + closing
- —
- Monthly P&I
- —
- Monthly cashflow
- —
- DSCR
- —
- Eligible?
- —
Personal DTI + credit; lowest rate.
DSCR
20% down · 8.5% · 30yr
- Down + closing
- —
- Monthly P&I
- —
- Monthly cashflow
- —
- DSCR
- —
- Eligible?
- —
No personal income docs; deal must DSCR.
Hard money
10% down · 12.0% · 12mo
- Down + closing
- —
- Monthly P&I
- —
- Monthly cashflow
- —
- DSCR
- —
- Eligible?
- —
Short-term bridge; refi at stabilization.
Listing history 27 events
-
2026-06-13days on market $124,900 Under Contract 102 DOM
-
2026-06-12days on market $124,900 Under Contract 101 DOM
-
2026-06-09days on market $124,900 Under Contract 98 DOM
-
2026-06-08days on market $124,900 Under Contract 97 DOM
-
2026-06-07days on market $124,900 Under Contract 96 DOM
-
2026-06-07days on market $124,900 Under Contract 95 DOM
-
2026-06-04days on market $124,900 Under Contract 92 DOM
-
2026-06-02days on market $124,900 Under Contract 91 DOM
-
2026-06-01days on market $124,900 Under Contract 90 DOM
-
2026-05-31days on market $124,900 Under Contract 89 DOM
-
2026-05-31days on market $124,900 Under Contract 88 DOM
-
2026-05-18historical Under Contract 178-char remark
Show marketing remark (178 chars)
Condo in Mint condition. Open the doors to a huge living room and and updated kitchen with granite counters. 2 big bedrooms, 2 full bathrooms. Large backyard is fenced with deck.
-
2026-04-14price $124,900 178-char remark
Show marketing remark (178 chars)
Condo in Mint condition. Open the doors to a huge living room and and updated kitchen with granite counters. 2 big bedrooms, 2 full bathrooms. Large backyard is fenced with deck.
-
2026-03-19price $129,900 178-char remark
Show marketing remark (178 chars)
Condo in Mint condition. Open the doors to a huge living room and and updated kitchen with granite counters. 2 big bedrooms, 2 full bathrooms. Large backyard is fenced with deck.
-
2026-03-03$135,000 Active 178-char remark
Show marketing remark (178 chars)
Condo in Mint condition. Open the doors to a huge living room and and updated kitchen with granite counters. 2 big bedrooms, 2 full bathrooms. Large backyard is fenced with deck.
-
2023-11-16soldstatus $112,000 Closed 492-char remark
Show marketing remark (492 chars)
Attractive condo in MINT condition! Open the doors to a super sized living room and an updated kitchen with GRANITE counters and appliances! 2 big bedrooms, 2 FULL bathrooms ----a hard to find amenity in this price range! Large backyard is fenced with deck, fish pond and a oversized shed to use for all your storage needs. Bring your electric car, this home is equipped with a charging port in the garage. Welcome home to 3A Justin Dr where you can sit back, relax and enjoy home ownership!
-
2023-10-17status Pending 492-char remark
Show marketing remark (492 chars)
Attractive condo in MINT condition! Open the doors to a super sized living room and an updated kitchen with GRANITE counters and appliances! 2 big bedrooms, 2 FULL bathrooms ----a hard to find amenity in this price range! Large backyard is fenced with deck, fish pond and a oversized shed to use for all your storage needs. Bring your electric car, this home is equipped with a charging port in the garage. Welcome home to 3A Justin Dr where you can sit back, relax and enjoy home ownership!
-
2023-10-07$119,900 Active 492-char remark
Show marketing remark (492 chars)
Attractive condo in MINT condition! Open the doors to a super sized living room and an updated kitchen with GRANITE counters and appliances! 2 big bedrooms, 2 FULL bathrooms ----a hard to find amenity in this price range! Large backyard is fenced with deck, fish pond and a oversized shed to use for all your storage needs. Bring your electric car, this home is equipped with a charging port in the garage. Welcome home to 3A Justin Dr where you can sit back, relax and enjoy home ownership!
-
2019-06-05soldstatus $77,900
-
2019-06-05soldstatus $77,900
-
2019-04-01$79,900
-
2006-12-04soldstatus $87,000
-
2006-11-22soldstatus $87,000
-
2005-03-03soldstatus $77,000
-
2004-07-15soldstatus $72,500
-
2004-07-15soldstatus $72,500
-
2004-05-27$73,500
ⓘ Source: listings_history table (triggers on properties + properties_extension) + one-shot
backfill from property_details.listing_events for pre-trigger history.
Tax reassessment forecast IL · Partial reset (capped growth)
- Current annual tax
- $3,050 · $254/mo
- Projected year-2 tax
- $3,050 · $254/mo
- Expected delta
- $0/yr ($0/mo · 0.0%)
ⓘ Screening estimate from a state-policy table — verify with the county assessor before closing.
Climate risk First Street
- Flood 1/10 Low FEMA zone X (unshaded) · 0% chance over 30 yrs
- Wildfire 1/10 Low
- Heat 4/10 Moderate 7 d/yr ≥106°F today · 19 d/yr by 30 yrs out
- Wind 2/10 Low 2% chance of damaging wind over 30 yrs
- Air quality 2/10 Low 1 unhealthy d/yr today · 2 by 30 yrs out
Nearby sold comps map
Loading sold comps map…
Walkable amenities ~0.75 mi
Loading nearby amenities…
Taxation est. · year 1
- Rental income
- $13,669
- − Mortgage interest
- −$6,996
- − Property taxes
- −$3,050
- − Insurance
- −$624
- − Repairs & maintenance
- −$1,094
- − Management
- −$1,094
- − Depreciation
- −$3,633
- Taxable loss
- −$2,822
- Est. tax savings @ 24.0%
- +$677
- After-tax cash flow
- $-58/yr
For passive investors: Depreciation is non-cash, so a rental often shows a tax loss while cash-flowing — sheltering income. Rental losses are passive: they offset passive income freely, and up to $25,000/yr can offset ordinary (W-2) income if you actively participate and your MAGI is under $100k (phasing out to $0 by $150k); unused losses carry forward. On sale, claimed depreciation is recaptured at up to 25%, and gains may owe capital-gains tax (a 1031 exchange can defer both). Figures are a year-1 estimate at your 24.0% rate — not tax advice; consult a CPA.
Schools (NCES district)
- District
- Jacksonville SD 117
- NCES district ID
- 1720280
- Math proficiency
- 20% ▼ -3.00%
- Reading proficiency
- 23% ▼ -6.00%
- Median HH income
- $44,909
- Composite
- 18.66/100
- National rank
- #8888
- State rank
- #407 of 620 in IL
Livability — Jacksonville
- Score
- 76/100
- State rank
- #187
- US rank
- #3543
Category grades
Schools grade is shown separately in the Schools card above.
Census & demographics
- Census place
- Jacksonville, IL
- City population
- 24,318
- Population (ZIP)
- 24,318
Population outlook (Morgan County) Hauer SSP2
- Today (2025)
- 32,874 people
- By 2030
- 31,698 · -3.6%
- By 2040
- 29,050 · -11.6%
- By 2050
- 26,381 · -19.8%
- By 2075
- 20,235 · -38.4%
- By 2100
- 14,324 · -56.4%
Race, ethnicity, and origin ACS 2023
- Neighborhood character
- Predominantly White (85%)
- Race & ethnicity
- White 85% Black 7% Two or more races 5% Hispanic / Latino 3%
- Common ancestry
- Lithuanian 2% Slovak 1% Iranian 1%
- Foreign-born
- 1% · Canada, South Korea
- Languages at home
- 97% English-only · Spanish 2%
Political lean MEDSL · Morgan
- 2024 margin
- Solid R (+32.5) · D 33.1% · R 65.6% · Other 1.3%
- 2008→2024 swing
- -31.7pp toward R · 2008: -0.8pp · 2024: -32.5pp
- All cycles
- 2024: R+32.5 2020: R+31.8 2016: R+29.9 2012: R+15.4 2008: R+0.8
Not yet ingested
- Civics
- —
Market trends
- HPI YoY
- ▼ -84.33%
- Current HPI
- 126.5712
- Rent YoY
- —
- Metro
- —
- State GDP YoY
- ▲ 1.59%
- F500 in state
- 60
Industry mix (Fortune 500 HQ in IL)
| Industry | F500 HQs | Revenue |
|---|---|---|
| Insurance | 4 | $201B |
|
||
| Consumer Goods | 4 | $87B |
|
||
| Industrial Machinery | 3 | $64B |
|
||
| Healthcare | 2 | $55B |
|
||
| Retail / Pharmacy | 1 | $148B |
|
||
| Agriculture / Food | 1 | $86B |
|
||
Price history
+69.9% since first listed16 events — show timeline
- 2026-05-18 Contingent — RMLSA as Distributed by MLS Grid
- 2026-04-14 Price Changed $124,900 RMLSA as Distributed by MLS Grid
- 2026-03-19 Price Changed $129,900 RMLSA as Distributed by MLS Grid
- 2026-03-03 Listed $135,000 RMLSA as Distributed by MLS Grid
- 2023-11-16 Sold (MLS) $112,000 RMLSA as Distributed by MLS Grid
- 2023-10-17 Pending — RMLSA as Distributed by MLS Grid
- 2023-10-07 Listed $119,900 RMLSA as Distributed by MLS Grid
- 2019-06-05 Sold (Public Records) $77,900 Public Records
- 2019-06-05 Sold (MLS) $77,900 RMLSA as Distributed by MLS Grid
- 2019-04-01 Listed $79,900 RMLSA as Distributed by MLS Grid
- 2006-12-04 Sold (Public Records) $87,000 Public Records
- 2006-11-22 Sold (Public Records) $87,000 Public Records
- 2005-03-03 Sold (Public Records) $77,000 Public Records
- 2004-07-15 Sold (Public Records) $72,500 Public Records
- 2004-07-15 Sold (MLS) $72,500 RMLSA as Distributed by MLS Grid
- 2004-05-27 Listed $73,500 RMLSA as Distributed by MLS Grid
Property tax history
+2.6%/yrLatest (2024): $3,050 · -15.4% YoY. Source: county tax records.
Cash-flow waterfall
monthlySold comps — $/sqft
last 12 mo · ≤1 miLoading sold comps…