 Triplex
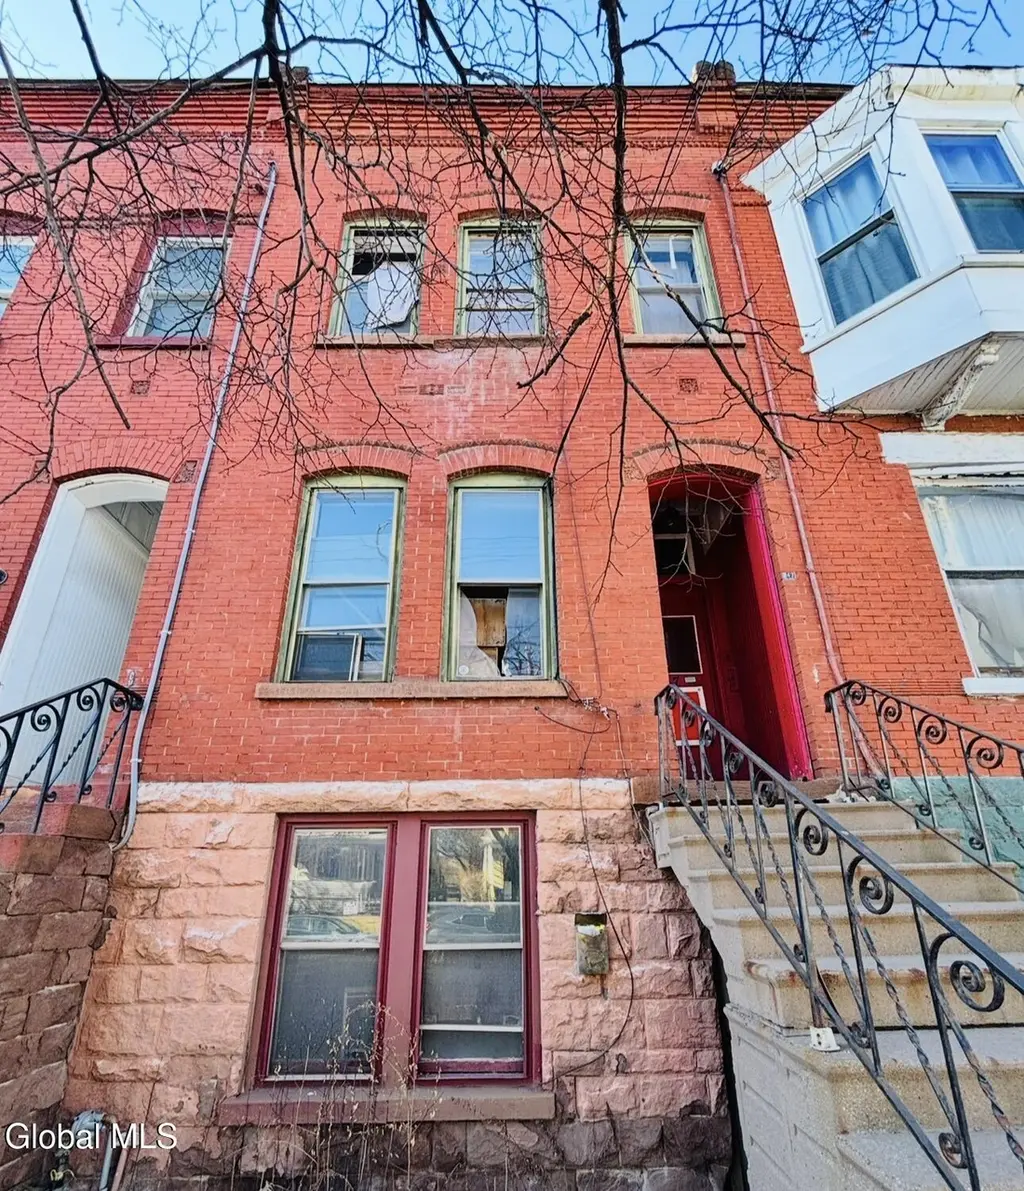
247 Quail St · Albany, NY
Flood risk 1/10 · Minimal
- FEMA flood zone
- X (unshaded)
- Chance of flooding over 30 yrs
- 0.0%
- Est. flood insurance / yr
- $473 – $860
Fire risk 1/10 · Minimal
- Est. fire insurance / yr
- $691 – $1,283
Heat risk 4/10 · Minor
- Hot days now (above 97°F)
- 7 days/yr
- Hot days in 30 yrs
- 16 days/yr
Wind risk 3/10 · Minor
- Chance of severe wind over 30 yrs
- 6.0%
Air-quality risk 1/10 · Minimal
- Unhealthy air days now
- 0 days/yr
- Unhealthy air days in 30 yrs
- 0 days/yr
Risk factors via First Street. Map © Google.
Why this score? — see what drove the B+ grade
The composite is a weighted blend of 9 inputs, each scored 0–100. Each bar is that input's sub-score; the figure is the points it added to the 100-point composite (weight × sub-score).
- Cash flow +30.0/30.0
- ARV discount +15.0/15.0
- 1% rule +10.0/10.0
- DSCR +10.0/10.0
- Livability +4.0/5.0
- Schools +3.2/10.0
- Rent growth +3.0/5.0
- Condition / age +2.5/5.0
- Appreciation +0.0/10.0
$269,900
🖨 Deal sheet 📄 Offer letter ✓ Due diligence
Multi-family units
County records classify this as Multi-Family (2-4 Unit). Listing-text estimate: 3 units. confirmed
Listing remarks MLS
Looking for your next project? Look no further! Investor special with strong upside potential! This spacious brick triplex offers a fantastic opportunity for renovation and value creation. Featuring high ceilings, original architectural details, and multiple fireplaces, the home has solid bones and plenty of character ready to be brought back to life. Natural light flows throughout, and the property includes classic elements such as original trim work and exposed brick, offering the perfect canvas for a modern restoration. The property is in need of some renovation and is being sold as-is making it ideal for investors, contractors, or buyers looking to customize a property to their vision. Conveniently located near local amenities, transportation, and neighborhood conveniences. Bring your ideas and unlock this property's full potential! Seller is open to subject to or seller financing. Ask listing agent for details.
Key facts
- Multiple fireplaces
- Original trim work
- Exposed brick
Tags
Neighborhood map
What this means for you Summary
Snapshot
- This is a 3 × 3-bed/3.0-bath units multifamily listed at $270k.
Deal economics
- At list price, monthly cash flow is $2k ($23k/yr) — positive. Per door: $648/mo.
- The deal already cash-flows at list — no discount required.
- Meets the 1% rule at list price ($5k rent vs $270k).
- Recommended offer: $254k (6.0% below list) — sets the bar for market timing.
- Cap rate 14.9% vs local median 5.7% in Albany — top-decile yield for the area; either an underpriced asset or a hidden risk that comps aren't pricing in. Stress-test before assuming the spread holds.
Location & tenants
- Location reads 79/100 on livability (#129 in NY, #2,083 nationally) — a middle-class / working-renter tenant base. Strengths: amenities A+, commute A+, housing A+; Watch: employment C-, crime F.
- Albany City School District (urban): math 37% / reading 40% proficiency, ranked #543 of 590 in NY (top 92%) — families likely to look elsewhere, expect single-tenant / working-renter base with shorter leases; 66% free/reduced lunch — lower-income household profile, screen leases tightly.
- Market conditions: Rents rising (+1.9%/yr); 124 active listings in the ZIP; 1 comparable units currently listed for rent nearby; solid renter incomes; 675 units permitted in Albany County in 2024 (451 in 5+ unit buildings).
- At $5,168/mo this rent would consume 75% of the median local household income ($83k/yr) (locally 1704% of renters already pay >50% of income on rent) — very limited rent-growth headroom before tenants either downsize or default.
Forward outlook
- Local home prices are declining (-3.0%/yr); year-one equity from $2k of loan paydown is wiped out by about $8k of value loss. Plan a longer hold.
- Albany County population projected at +9% by 2050 — modest demand growth; plan on rents tracking national, not racing it.
- At projected returns (-3.0% appreciation + 1.9% rent growth), your $76k cash investment doubles in ~5 years — after that, you're playing with house money.
Negotiation context
- It's been on market 85 days — a 6% lower offer ($254k) is reasonable based on typical stale-listing flexibility.
- 3 sale attempts since 21y ago with the ask held roughly flat each time — persistent listings suggest the price (not the market) is what's stuck; bring a comps-based counter.
- Current owner paid $148k; list at $270k implies a 82% gain — meaningful room to come down on a strong offer.
Risks & watch-outs
- Watch-outs: property tax is 2.7% of price; built in 1889 — expect roof / HVAC / electrical / plumbing capex.
Questions for the listing agent
- It's been on market 85 days. Have you received any prior offers? Is the seller open to a 6% concession, seller financing, or rate buy-down credit?
- Can we see the unit-by-unit rent roll, current vacancy, and any below-market leases? What's the average tenancy length?
- What capital expenditures (roof, boiler, parking lot, exteriors) have been made in the last 5 years, and what's planned in the next 2?
- Built in 1889 — when were the roof, HVAC, electrical panel, plumbing, and water heater last replaced?
- Property tax is high relative to price — has the assessment been appealed recently, and will the sale trigger a re-assessment?
- Why hasn't it sold? Are there any deal-killer items the seller is aware of (foundation, flood, title, zoning, code violations)?
- Is there a deadline driving the sale (1031 exchange, divorce, estate, relocation)? That informs how much negotiation room exists.
- Crime grade is F in this area — have there been break-ins, vandalism, or insurance claims at this property in the last 3 years? What carrier currently insures it and at what premium?
- What's the average days-on-market for RENTAL listings here right now (not sales)? A rising rental-DOM trend means longer vacancies and softer asking-rent achievability than the comps imply.
- What's the recent tenant-quality profile in this submarket — average credit score on applications, eviction rate, late-payment / NSF rate, and stable-employment percentage? A property-management company in the area should have these aggregated.
- How much new apartment / multifamily construction is in the pipeline within 1–3 miles? Heavy new supply (>2% of stock underway) typically softens rents 12–24 months out; light construction supports rent growth.
Investment metrics
- 1% rule
- 1.91% ✓
- Cap rate
- 14.93%
- Cash-on-cash
- 30.86%
- DSCR
- 2.37
- GRM
- 4.4
CMA / ARV
- ARV (median comp)
- $498,620
- List price
- $269,900
- Delta
- -45.87%
- Verdict
- UNDERPRICED
- Comps
- 20 within 1.0 mi
Show comp detail 12 sales within ~0.75 mi
| Address | Dist | Beds/Ba | Sqft | Sold | Price | $/sf | Match |
|---|---|---|---|---|---|---|---|
| 687 Myrtle Ave | 0.29mi | 6/2.0 | 2,238 (+1%) | 6mo | $310,000 | $139 | 76 |
| 380-382 Morris St | 0.19mi | 6/2.0 | 2,344 (+6%) | 3mo | $300,000 | $128 | 74 |
| 531 Hamilton St | 0.22mi | 5/3.0 (-1) | 2,112 (-4%) | 5mo | $284,750 | $135 | 74 |
| 538 Myrtle Ave | 0.25mi | 5/5.0 (-1) | 2,216 (+0%) | 2mo | $410,000 | $185 | 73 |
| 563 Morris St | 0.36mi | 6/2.0 | 2,224 (+1%) | 6mo | $275,000 | $124 | 73 |
| 157 Western Ave | 0.25mi | 7/2.0 (+1) | 2,144 (-3%) | 5mo | $215,000 | $100 | 70 |
| 645 Myrtle Ave | 0.22mi | 6/2.0 | 2,000 (-9%) | 5mo | $270,000 | $135 | 66 |
| 391 Washington Ave | 0.48mi | 7/4.0 (+1) | 2,217 (+0%) | 5mo | $350,000 | $158 | 64 |
| 189-B Quail St | 0.18mi | 6/2.0 | 2,512 (+14%) | 3mo | $185,000 | $74 | 62 |
| 676 Providence St | 0.45mi | 5/2.0 (-1) | 2,118 (-4%) | 2mo | $250,000 | $118 | 61 |
| 24 Kent St | 0.46mi | 6/2.0 | 2,364 (+7%) | 4mo | $210,000 | $89 | 59 |
| 534 1st St | 0.66mi | 6/2.0 | 2,464 (+12%) | 0mo | $175,000 | $71 | 46 |
Match score weights: distance 35% · size 25% · config 20% · recency 20%. Top-matched comps best support the ARV.
Projected returns pro-forma
-3.0% appreciation · 1.85% rent growth · sell at horizon
- IRR
- 24.3%
- Equity multiple
- 1.98×
- Total profit
- $74,375
- Equity at exit
- $40,243
- IRR
- 31.3%
- Equity multiple
- 3.67×
- Total profit
- $201,442
- Equity at exit
- $23,336
Cash invested: $75,572 (down + closing). Projections, not guarantees.
Landlord ↔ Tenant lean methodology
- Overall (STATE)
- 15 Strongly Tenant-Friendly
- State New York
- 15 Strongly Tenant-Friendly · D+10
- County
- — inherits STATE
- City
- — inherits STATE
ZIP-level market 12203
- Home prices YoY
- -31.0%
- Rents YoY
- 1.9%
- Active inventory
- 124
- Price-to-rent
- 13.1×
Monthly cashflow live
- Estimated rent
- $5,168 high interval (Pro) →
- Mortgage (P&I)
- −$1,415
- Tax from tax record
- −$611 /mo · $7,338/yr
- Insurance
- −$112
- HOA
- −$0
- Vacancy / Maint / Mgmt
- −$1,085
- Net cashflow
- $1,943
Break-even live
3-unit breakdown (identical units grouped — click to expand)
| Units | Beds | Baths | Est. rent |
|---|---|---|---|
| 3× units | 3 | 3 | $5,169 |
| #1 | 3 | 3 | $1,723 |
| #2 | 3 | 3 | $1,723 |
| #3 | 3 | 3 | $1,723 |
| Total (3 units) | $5,168 | ||
UW: 25.0% down · 7.5% · 30yr · 1.5% tax · 5.0% vac · 8.0% maint · 8.0% mgmt
Financing live
Cash to close
- Down payment
- $67,475
- Closing costs
- $8,097
- Reserves months
- —
- Total cash needed
- —
Loan-product check · same deal, 3 products live
Conventional
25% down · 7.5% · 30yr
- Down + closing
- —
- Monthly P&I
- —
- Monthly cashflow
- —
- DSCR
- —
- Eligible?
- —
Personal DTI + credit; lowest rate.
DSCR
20% down · 8.5% · 30yr
- Down + closing
- —
- Monthly P&I
- —
- Monthly cashflow
- —
- DSCR
- —
- Eligible?
- —
No personal income docs; deal must DSCR.
Hard money
10% down · 12.0% · 12mo
- Down + closing
- —
- Monthly P&I
- —
- Monthly cashflow
- —
- DSCR
- —
- Eligible?
- —
Short-term bridge; refi at stabilization.
Rent comps 1 comps
| Address | Beds | Baths | Sqft | Rent | $/sqft | DOM | Units | Dist |
|---|---|---|---|---|---|---|---|---|
| 69 Winthrop Ave Albany, NY | 6.0 | 2.0 | 2800 | $2,795 | $1.00 | 23d | 1 | 1.09mi |
Listing history 21 events
-
2026-06-18days on market $269,900 Active 85 DOM
-
2026-06-17days on market $269,900 Active 84 DOM
-
2026-06-16days on market $269,900 Active 83 DOM
-
2026-06-15days on market $269,900 Active 82 DOM
-
2026-06-14days on market $269,900 Active 80 DOM
-
2026-06-10days on market $269,900 Active 77 DOM
-
2026-06-08days on market $269,900 Active 75 DOM
-
2026-06-07days on market $269,900 Active 74 DOM
-
2026-06-03days on market $269,900 Active 70 DOM
-
2026-06-02days on market $269,900 Active 69 DOM
-
2026-06-01days on market $269,900 Active 68 DOM
-
2026-05-31days on market $269,900 Active 67 DOM
-
2026-05-31days on market $269,900 Active 66 DOM
-
2026-04-08price $269,900 935-char remark
Show marketing remark (935 chars)
Looking for your next project? Look no further! Investor special with strong upside potential! This spacious brick triplex offers a fantastic opportunity for renovation and value creation. Featuring high ceilings, original architectural details, and multiple fireplaces, the home has solid bones and plenty of character ready to be brought back to life. Natural light flows throughout, and the property includes classic elements such as original trim work and exposed brick, offering the perfect canvas for a modern restoration. The property is in need of some renovation and is being sold as-is making it ideal for investors, contractors, or buyers looking to customize a property to their vision. Conveniently located near local amenities, transportation, and neighborhood conveniences. Bring your ideas and unlock this property's full potential! Seller is open to subject to or seller financing. Ask listing agent for details.
-
2026-03-25$279,900 Active 935-char remark
Show marketing remark (935 chars)
Looking for your next project? Look no further! Investor special with strong upside potential! This spacious brick triplex offers a fantastic opportunity for renovation and value creation. Featuring high ceilings, original architectural details, and multiple fireplaces, the home has solid bones and plenty of character ready to be brought back to life. Natural light flows throughout, and the property includes classic elements such as original trim work and exposed brick, offering the perfect canvas for a modern restoration. The property is in need of some renovation and is being sold as-is making it ideal for investors, contractors, or buyers looking to customize a property to their vision. Conveniently located near local amenities, transportation, and neighborhood conveniences. Bring your ideas and unlock this property's full potential! Seller is open to subject to or seller financing. Ask listing agent for details.
-
2022-05-05status Pending 208-char remark
Show marketing remark (208 chars)
Solid Triplex Brownstone - 3 1BR & 1BA units. $36,000 Annual Income in an area where there is constant rental demand - blocks from the universities, hospital, nightlife, daily needs, bus lines, and parks.
-
2022-04-26$239,900 Active 208-char remark
Show marketing remark (208 chars)
Solid Triplex Brownstone - 3 1BR & 1BA units. $36,000 Annual Income in an area where there is constant rental demand - blocks from the universities, hospital, nightlife, daily needs, bus lines, and parks.
-
2006-01-24soldstatus $148,000
-
2005-12-29soldstatus $148,000
-
2005-11-02historical
-
2005-10-29$139,750
ⓘ Source: listings_history table (triggers on properties + properties_extension) + one-shot
backfill from property_details.listing_events for pre-trigger history.
Tax reassessment forecast NY · Partial reset (capped growth)
- Current annual tax
- $7,338 · $611/mo
- Projected year-2 tax
- $7,338 · $611/mo
- Expected delta
- $0/yr ($0/mo · 0.0%)
ⓘ Screening estimate from a state-policy table — verify with the county assessor before closing.
Climate risk First Street
- Flood 1/10 Low FEMA zone X (unshaded) · 0% chance over 30 yrs
- Wildfire 1/10 Low
- Heat 4/10 Moderate 7 d/yr ≥97°F today · 16 d/yr by 30 yrs out
- Wind 3/10 Moderate 6% chance of damaging wind over 30 yrs
- Air quality 1/10 Low 0 unhealthy d/yr today · 0 by 30 yrs out
Nearby sold comps map
Loading sold comps map…
Walkable amenities ~0.75 mi
Loading nearby amenities…
Taxation est. · year 1
- Rental income
- $62,016
- − Mortgage interest
- −$15,119
- − Property taxes
- −$7,338
- − Insurance
- −$1,350
- − Repairs & maintenance
- −$4,961
- − Management
- −$4,961
- − Depreciation
- −$7,852
- Taxable income
- $20,436
- Est. tax owed @ 24.0%
- −$4,905
- After-tax cash flow
- $18,416/yr
For passive investors: Depreciation is non-cash, so a rental often shows a tax loss while cash-flowing — sheltering income. Rental losses are passive: they offset passive income freely, and up to $25,000/yr can offset ordinary (W-2) income if you actively participate and your MAGI is under $100k (phasing out to $0 by $150k); unused losses carry forward. On sale, claimed depreciation is recaptured at up to 25%, and gains may owe capital-gains tax (a 1031 exchange can defer both). Figures are a year-1 estimate at your 24.0% rate — not tax advice; consult a CPA.
Schools (NCES district)
- District
- Albany City School District
- NCES district ID
- 3602460
- Math proficiency
- 37% ▲ 6.00%
- Reading proficiency
- 40% ▲ 7.00%
- Median HH income
- $40,568
- Composite
- 32.34/100
- National rank
- #5744
- State rank
- #543 of 590 in NY
Livability — Albany
- Score
- 79/100
- State rank
- #129
- US rank
- #2083
Category grades
Schools grade is shown separately in the Schools card above.
Census & demographics
- Census place
- Albany, NY
- County
- Albany County · 196,626 people
- City population
- 116,921
- Metro
- Albany-Schenectady-Troy, NY
- Population (ZIP)
- 30,771
- Household income
- $83,147
- Rent vs Own
- Severe rent burden
- 1704.0
Population outlook (Albany County) Hauer SSP2
- Today (2025)
- 320,794 people
- By 2030
- 327,401 · +2.1%
- By 2040
- 338,218 · +5.4%
- By 2050
- 348,467 · +8.6%
- By 2075
- 381,693 · +19.0%
- By 2100
- 393,809 · +22.8%
Race, ethnicity, and origin ACS 2023
- Neighborhood character
- Predominantly White (69%)
- Race & ethnicity
- White 69% Black 10% Asian 8% Hispanic / Latino 7% Two or more races 7%
- Hispanic origin (detail)
- Mexican 2% Puerto Rican 2%
- Common ancestry
- Romanian 5% Lithuanian 3% Slovak 2%
- Foreign-born
- 16% · Canada, China, South Korea
- Languages at home
- 82% English-only · Other Indo-European 6% Spanish 3% Russian/Polish/Slavic 2%
Political lean MEDSL · Albany
- 2024 margin
- Strong D (+25.8) · D 62.9% · R 37.1%
- 2008→2024 swing
- -3.6pp toward R · 2008: 29.4pp · 2024: 25.8pp
- All cycles
- 2024: D+25.8 2020: D+31.4 2016: D+24.3 2012: D+31.0 2008: D+29.4
Not yet ingested
- Civics
- —
Market trends
- HPI YoY
- ▼ -133.05%
- Current HPI
- 296.0467
- Rent YoY
- ▲ 1.85%
- Metro
- Albany-Schenectady-Troy, NY
- State GDP YoY
- ▲ 2.60%
- F500 in state
- 92
Industry mix (Fortune 500 HQ in NY)
| Industry | F500 HQs | Revenue |
|---|---|---|
| Financial Services | 10 | $950B |
|
||
| Consumer Goods | 9 | $162B |
|
||
| Insurance | 4 | $225B |
|
||
| Telecommunications | 2 | $144B |
|
||
| Pharmaceuticals | 2 | $112B |
|
||
| Media / Entertainment | 2 | $69B |
|
||
Price history
+93.1% since first listed8 events — show timeline
- 2026-04-08 Price Changed $269,900 Global MLS
- 2026-03-25 Listed $279,900 Global MLS
- 2022-05-05 Pending — Global MLS
- 2022-04-26 Listed $239,900 Global MLS
- 2006-01-24 Sold (Public Records) $148,000 Public Records
- 2005-12-29 Sold (MLS) $148,000 Global MLS
- 2005-11-02 Listing Removed — Global MLS
- 2005-10-29 Listed $139,750 Global MLS
Property tax history
+2.6%/yrLatest (2025): $7,338 · -0.7% YoY. Source: county tax records.
Cash-flow waterfall
monthlySold comps — $/sqft
last 12 mo · ≤1 miLoading sold comps…