5745 Marina Dr · Wabasso, FL
Flood risk 10/10 · Severe
- FEMA flood zone
- X (shaded)
- Chance of flooding over 30 yrs
- 0.99%
- Est. flood insurance / yr
- $507 – $1,088
Fire risk 2/10 · Minimal
- Est. fire insurance / yr
- $947 – $1,759
Heat risk 10/10 · Severe
- Hot days now (above 106°F)
- 7 days/yr
- Hot days in 30 yrs
- 24 days/yr
Wind risk 10/10 · Severe
- Chance of severe wind over 30 yrs
- 99.0%
Air-quality risk 1/10 · Minimal
- Unhealthy air days now
- 0 days/yr
- Unhealthy air days in 30 yrs
- 0 days/yr
Risk factors via First Street. Map © Google.
Why this score? — see what drove the D grade
The composite is a weighted blend of 9 inputs, each scored 0–100. Each bar is that input's sub-score; the figure is the points it added to the 100-point composite (weight × sub-score).
- Cash flow +13.1/30.0
- ARV discount +7.5/15.0
- Schools +4.2/10.0
- Rent growth +4.1/5.0
- DSCR +3.9/10.0
- 1% rule +3.7/10.0
- Livability +3.3/5.0
- Condition / age +2.0/5.0
- Appreciation +0.0/10.0
$249,000
🖨 Deal sheet (PDF) 📄 Offer letter ✓ Due diligence
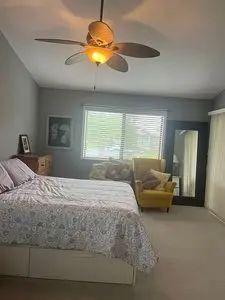
Listing remarks
Renovated vaulted ceilings, three exposures super bright, super quiet, new air conditioner, heater water heater. . second floor water views on both sides a beautiful home.
Key facts
- Water views
- Vaulted ceilings
- Built 1987
Tags
Neighborhood map
What this means for you Summary
Snapshot
- This is a 2-bed/2.0-bath other listed at $249k. Condition is rated fair.
Deal economics
- At list price, monthly cash flow is $-74 ($-887/yr) — negative.
- To cash-flow at today's rent, offer at most $238k (4.3% below list).
- To meet the 1% rule (rent ≥ 1% of price), the offer needs to be $217k (12.9% below list).
- Recommended offer: $217k (12.9% below list) — sets the bar for 1% rule.
- Cap rate 6.3% vs local median 3.4% in Wabasso — top-decile yield for the area; either an underpriced asset or a hidden risk that comps aren't pricing in. Stress-test before assuming the spread holds.
Location & tenants
- Location reads 66/100 on livability (#626 in FL) — a middle-class / working-renter tenant base. Strengths: commute A+, crime A, cost of living A-; Watch: employment D, schools F, amenities F.
- Indian River (other): math 48% / reading 52% proficiency, ranked #35 of 73 in FL (top 48%) — acceptable for families but not a draw, mixed tenant base, ~2y average lease.
- Market conditions: Rents rising fast (+6.2%/yr); 412 active listings in the ZIP; 4 comparable units currently listed for rent nearby; rentals at typical pace (median 22d on market — plan ~3-4 weeks tenant-placement turnaround); 564 units permitted in Indian River County in 2024 (281 in 5+ unit buildings).
- This rent runs 39% of the median local income ($67k/yr) — at the standard rent-burdened threshold; future hikes will face affordability resistance.
Forward outlook
- Local home prices are declining (-3.0%/yr); year-one equity from $2k of loan paydown is wiped out by about $7k of value loss. Plan a longer hold.
- Indian River County population projected at +18% by 2050 — long-run rental-demand tailwind backs the buy-and-hold thesis.
Negotiation context
- It's been on market 24 days — a 2% lower offer ($245k) is reasonable based on typical stale-listing flexibility.
Risks & watch-outs
- Watch-outs: flood insurance adds $66/mo.
- Climate carrying-cost: severe flood risk; severe wind risk, 99% chance of damaging wind over 30y; extreme-heat days projected 7→24/yr by 2055 (HVAC capex compounding) — expect insurance premiums to compound above CPI over the hold.
Questions for the listing agent
- What do current leases actually rent for vs. the listed asking? Can we see a recent rent roll and the last 12 months of T-12 income?
- Have any recent inspections been done? Can we get a copy of the seller's disclosures and any deferred-maintenance estimates?
- What's the actual annual flood-insurance premium (NFIP or private), and is the property in a SFHA with mandatory coverage?
- Is there a deadline driving the sale (1031 exchange, divorce, estate, relocation)? That informs how much negotiation room exists.
- Schools are F-rated, which usually means shorter tenancies and higher turnover. Who's the typical renter profile here, and what's been the actual vacancy rate?
- The area grade is low — what's the realistic commute time and amenity access for the typical tenant pool here? Any planned neighborhood developments (good or bad) we should know about?
- What's the average days-on-market for RENTAL listings here right now (not sales)? A rising rental-DOM trend means longer vacancies and softer asking-rent achievability than the comps imply.
- What's the recent tenant-quality profile in this submarket — average credit score on applications, eviction rate, late-payment / NSF rate, and stable-employment percentage? A property-management company in the area should have these aggregated.
- How much new for-sale + rental construction is in the pipeline within 1–3 miles? Heavy new supply typically softens prices + rents 12–24 months out; constrained supply supports both.
Investment metrics
- 1% rule
- 0.87% ✗
- Cap rate
- 6.26%
- Cash-on-cash
- -0.13%
- DSCR
- 0.99
- GRM
- 9.6
CMA / ARV
No comps found within radius.
Projected returns pro-forma
-3.0% appreciation · 6.22% rent growth · sell at horizon
- IRR
- -14.7%
- Equity multiple
- 0.46×
- Total profit
- $-37,731
- Equity at exit
- $37,127
- IRR
- -1.2%
- Equity multiple
- 0.90×
- Total profit
- $-6,820
- Equity at exit
- $21,529
Cash invested: $69,720 (down + closing). Projections, not guarantees.
Landlord ↔ Tenant lean methodology
- Overall (STATE)
- 87 Strongly Landlord-Friendly
- State Florida
- 87 Strongly Landlord-Friendly · R+3
- County
- — inherits STATE
- City
- — inherits STATE
ZIP-level market 32958
- Home prices YoY
- -13.1%
- Rents YoY
- 6.2%
- Active inventory
- 412
- Price-to-rent
- 9.6×
Monthly cashflow live
- Estimated rent
- $2,169 medium interval (Pro) →
- Mortgage (P&I)
- −$1,306
- Tax est. 1.5%
- −$311 /mo · $3,735/yr
- Insurance
- −$104
- Flood insurance flood zone
- −$66 /mo · $798/yr
- HOA
- −$0
- Vacancy / Maint / Mgmt
- −$455
- Net cashflow
- $-74
Break-even live
Sensitivity live
| Price | -10% $98 | -5% $12 | +0% $-74 | +5% $-160 | +10% $-246 |
|---|---|---|---|---|---|
| Rent | -10% $-245 | -5% $-160 | +0% $-74 | +5% $12 | +10% $97 |
| Rate | -1.0pp $51 | -0.5pp $-11 | base $-74 | +0.5pp $-138 | +1.0pp $-204 |
UW: 25.0% down · 7.5% · 30yr · 1.5% tax · 5.0% vac · 8.0% maint · 8.0% mgmt
Financing live
Cash to close
- Down payment
- $62,250
- Closing costs
- $7,470
- Reserves months
- —
- Total cash needed
- —
Loan-product check · same deal, 3 products live
Conventional
25% down · 7.5% · 30yr
- Down + closing
- —
- Monthly P&I
- —
- Monthly cashflow
- —
- DSCR
- —
- Eligible?
- —
Personal DTI + credit; lowest rate.
DSCR
20% down · 8.5% · 30yr
- Down + closing
- —
- Monthly P&I
- —
- Monthly cashflow
- —
- DSCR
- —
- Eligible?
- —
No personal income docs; deal must DSCR.
Hard money
10% down · 12.0% · 12mo
- Down + closing
- —
- Monthly P&I
- —
- Monthly cashflow
- —
- DSCR
- —
- Eligible?
- —
Short-term bridge; refi at stabilization.
Rent comps 4 comps
| Address | Beds | Baths | Sqft | Rent | $/sqft | DOM | Units | Dist |
|---|---|---|---|---|---|---|---|---|
| 5790 Marina Dr #2 Sebastian, FL | 2.0 | 2.0 | 1060 | $2,200 | $2.08 | 22d | 1 | 0.02mi |
| 5790 Marina Dr #2 Sebastian, FL | 2.0 | 2.0 | 1060 | $2,200 | $2.08 | 14d | 1 | 0.09mi |
| 141 Crawford Dr Sebastian, FL | 2.0 | 1.0 | 1100 | $2,200 | $2.00 | 14d | 1 | 1.22mi |
| 151 Mabry St Sebastian, FL | 3.0 | 2.0 | 1199 | $1,850 | $1.54 | 22d | 1 | 1.32mi |
Listing history 17 events
-
2026-06-19days on market $249,000 Active 24 DOM
-
2026-06-18days on market $249,000 Active 23 DOM
-
2026-06-17days on market $249,000 Active 22 DOM
-
2026-06-16days on market $249,000 Active 21 DOM
-
2026-06-15days on market $249,000 Active 20 DOM
-
2026-06-14days on market $249,000 Active 18 DOM
-
2026-06-13days on market $249,000 Active 17 DOM
-
2026-06-10days on market $249,000 Active 15 DOM
-
2026-06-09days on market $249,000 Active 14 DOM
-
2026-06-08days on market $249,000 Active 13 DOM
-
2026-06-07days on market $249,000 Active 12 DOM
-
2026-06-05days on market $249,000 Active 9 DOM
-
2026-06-02days on market $249,000 Active 7 DOM
-
2026-06-01days on market $249,000 Active 6 DOM
-
2026-05-31days on market $249,000 Active 5 DOM
-
2026-05-30days on market $249,000 Active 4 DOM
-
2026-05-26$249,000 Active
ⓘ Source: listings_history table (triggers on properties + properties_extension) + one-shot
backfill from property_details.listing_events for pre-trigger history.
Climate risk First Street
- Flood 10/10 Extreme FEMA zone X (shaded) · 99% chance over 30 yrs
- Wildfire 2/10 Low
- Heat 10/10 Extreme 7 d/yr ≥106°F today · 24 d/yr by 30 yrs out
- Wind 10/10 Extreme 99% chance of damaging wind over 30 yrs
- Air quality 1/10 Low 0 unhealthy d/yr today · 0 by 30 yrs out
Nearby sold comps map
Loading sold comps map…
Walkable amenities ~0.75 mi
Loading nearby amenities…
Taxation est. · year 1
- Rental income
- $26,025
- − Mortgage interest
- −$13,948
- − Property taxes
- −$3,735
- − Insurance
- −$2,042
- − Repairs & maintenance
- −$2,082
- − Management
- −$2,082
- − Depreciation
- −$7,244
- Taxable loss
- −$5,108
- Est. tax savings @ 24.0%
- +$1,226
- After-tax cash flow
- $339/yr
For passive investors: Depreciation is non-cash, so a rental often shows a tax loss while cash-flowing — sheltering income. Rental losses are passive: they offset passive income freely, and up to $25,000/yr can offset ordinary (W-2) income if you actively participate and your MAGI is under $100k (phasing out to $0 by $150k); unused losses carry forward. On sale, claimed depreciation is recaptured at up to 25%, and gains may owe capital-gains tax (a 1031 exchange can defer both). Figures are a year-1 estimate at your 24.0% rate — not tax advice; consult a CPA.
Condition & rehab AI · 0 photos
The home is in fair condition with cosmetic updates needed, particularly in the kitchen and bathrooms. Fresh paint and new fixtures would significantly enhance its resale value.
Repairs flagged
- Minor kitchen cabinets — No visible damage, but no specific details on condition.
- Minor bathroom fixtures — No visible damage, but no specific details on condition.
- Minor interior paint — No visible damage, but no specific details on condition.
Value-add opportunities
- Resale Paint interior walls — Fresh paint can make a significant difference in the home's appearance and appeal to potential buyers.
- Resale Replace kitchen cabinets — New cabinets can enhance the home's value and appeal to potential buyers.
- Resale Upgrade bathroom fixtures — Modern fixtures can improve the home's appeal and functionality.
Renovation cost estimate screening
| Repair item | Severity | Est. cost |
|---|---|---|
| kitchen cabinets · No visible damage, but no specific details on condition. | Minor | $500–3,000 |
| bathroom fixtures · No visible damage, but no specific details on condition. | Minor | $500–3,000 |
| interior paint · No visible damage, but no specific details on condition. | Minor | $500–3,000 |
| Total estimated repair cost · 3 items | $1,500–9,000 |
Value-add ROI direction
- Resale Paint interior walls — Fresh paint can make a significant difference in the home's appearance and appeal to potential buyers. ↑
- Resale Replace kitchen cabinets — New cabinets can enhance the home's value and appeal to potential buyers. ↑
- Resale Upgrade bathroom fixtures — Modern fixtures can improve the home's appeal and functionality. ↑
ⓘ Cost ranges are severity-bucket heuristics (US national rule-of-thumb). Get contractor quotes + a written scope before underwriting a rehab budget.
Schools (NCES district)
- District
- Indian River
- NCES district ID
- 1200930
- Math proficiency
- 48% ▼ -9.00%
- Reading proficiency
- 52% ▼ -3.00%
- Median HH income
- $46,597
- Composite
- 42.45/100
- National rank
- #3218
- State rank
- #35 of 73 in FL
Livability — Wabasso
- Score
- 66/100
- State rank
- #626
- US rank
- #12197
Category grades
Schools grade is shown separately in the Schools card above.
Census & demographics
- County
- Indian River County · 143,738 people
- City population
- 287
- Metro
- Sebastian-Vero Beach, FL
- Population (ZIP)
- 30,023
- Household income
- $66,840
- Rent vs Own
- Severe rent burden
- 646.0
Population outlook (Indian River County) Hauer SSP2
- Today (2025)
- 165,104 people
- By 2030
- 172,869 · +4.7%
- By 2040
- 185,640 · +12.4%
- By 2050
- 194,465 · +17.8%
- By 2075
- 211,115 · +27.9%
- By 2100
- 211,781 · +28.3%
Race, ethnicity, and origin ACS 2023
- Neighborhood character
- Predominantly White (86%)
- Race & ethnicity
- White 86% Hispanic / Latino 9% Two or more races 7% Black 2% Asian 1%
- Hispanic origin (detail)
- Mexican 1% Puerto Rican 2% Cuban 3%
- Common ancestry
- Lithuanian 4% Slovak 4% Romanian 3%
- Foreign-born
- 7% · Canada, Jamaica
- Languages at home
- 91% English-only · Spanish 6% Other Indo-European 1% Russian/Polish/Slavic 1%
Political lean MEDSL · Indian River
- 2024 margin
- Strong R (+27.4) · D 36.0% · R 63.4%
- 2008→2024 swing
- -12.5pp toward R · 2008: -14.8pp · 2024: -27.4pp
- All cycles
- 2024: R+27.4 2020: R+21.6 2016: R+24.5 2012: R+22.3 2008: R+14.8
Not yet ingested
- Civics
- —
Market trends
- HPI YoY
- ▼ -49.85%
- Current HPI
- 330.1691
- Rent YoY
- ▲ 6.22%
- Metro
- Sebastian-Vero Beach, FL
- State GDP YoY
- ▲ 3.28%
- F500 in state
- 36
Industry mix (Fortune 500 HQ in FL)
| Industry | F500 HQs | Revenue |
|---|---|---|
| Industrial Technology | 2 | $29B |
|
||
| Insurance | 2 | $17B |
|
||
| Retail | 1 | $60B |
|
||
| Technology Distribution | 1 | $58B |
|
||
| Homebuilding | 1 | $35B |
|
||
| Technology Manufacturing | 1 | $35B |
|
||
Price history
1 event — show timeline
- 2026-05-26 Listed $249,000 FSBO.com
Cash-flow waterfall
monthlySold comps — $/sqft
last 12 mo · ≤1 miLoading sold comps…